🟢 ALICE$ /USDT | Technical Analysis
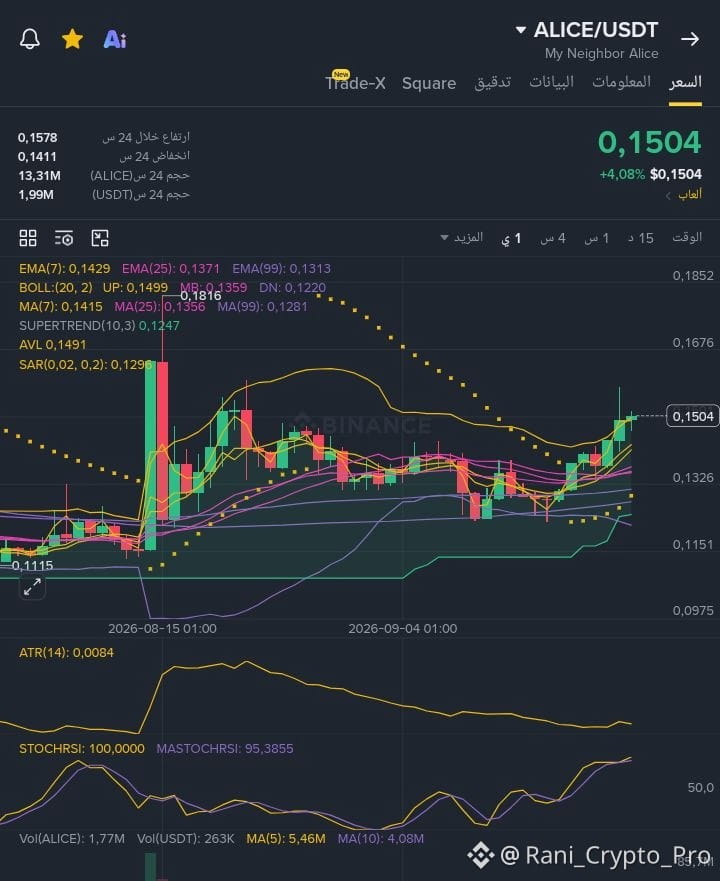
ALICE is currently trading near the 0.1504 USDT level, with a rise of about 4.08%. The technical picture across multiple timeframes suggests continued bullish momentum.
📊 On the short timeframe:
Price is above the EMA7, EMA25, and EMA99.
MACD is in positive territory.
RSI is around 60 on the 15-minute timeframe, indicating buying momentum without strong overbought conditions.
StochRSI is elevated, so the possibility of a pause or a short pullback remains.
📈 On the higher timeframes:
The trend is still bullish, and the price is holding above key moving averages, while OBV shows improvement in trading volume during the up move.
💰 Flows: Flow data shown on Binance indicates buy activity, with total buy orders around 13.66M versus 12.82M for sell orders in the snapshot.
🎯 Key levels: 🔴 Resistance: 0.1515 – 0.1520
🚀 A breakout with strong volume could open the way to monitor 0.1538, then 0.1578.
🟢 Near support: 0.1490 – 0.1485
🟢 Stronger support: 0.1470 – 0.1465
🟢 Important support on the higher timeframe: 0.1420 – 0.1415
⚠️ Despite the strength of the trend, some indicators on the higher timeframes are high, so entering after a sharp rise may be followed by a correction.
This is a technical analysis and personal follow-up, not financial advice.
$ALICE
ALICE is currently trading near the 0.1504 USDT level, with a rise of about 4.08%. The technical picture across multiple timeframes suggests continued bullish momentum.
📊 On the short timeframe:
Price is above the EMA7, EMA25, and EMA99.
MACD is in positive territory.
RSI is around 60 on the 15-minute timeframe, indicating buying momentum without strong overbought conditions.
StochRSI is elevated, so the possibility of a pause or a short pullback remains.
📈 On the higher timeframes:
The trend is still bullish, and the price is holding above key moving averages, while OBV shows improvement in trading volume during the up move.
💰 Flows: Flow data shown on Binance indicates buy activity, with total buy orders around 13.66M versus 12.82M for sell orders in the snapshot.
🎯 Key levels: 🔴 Resistance: 0.1515 – 0.1520
🚀 A breakout with strong volume could open the way to monitor 0.1538, then 0.1578.
🟢 Near support: 0.1490 – 0.1485
🟢 Stronger support: 0.1470 – 0.1465
🟢 Important support on the higher timeframe: 0.1420 – 0.1415
⚠️ Despite the strength of the trend, some indicators on the higher timeframes are high, so entering after a sharp rise may be followed by a correction.
This is a technical analysis and personal follow-up, not financial advice.
$ALICE