On the two global asset value rankings, positions 249 and 251 sit right next to each other: on one side is BNB, and on the other is a custody bank with a 240-year history. On September 22, the figures were roughly $104.4 billion versus about $104.1 billion—BNB was hovering around $783.7.
First, let’s look at what props up the side that got overtaken. Last year, the bank’s net profit was $5.55 billion and revenue was $40.55 billion. In Q2, earnings per share were $2.45, up 27% year over year. The assets it holds and administers in custody total $6.26 trillion; total assets are $472.3 billion. It has about 46,500 employees, and its clients are spread across hundreds of markets.
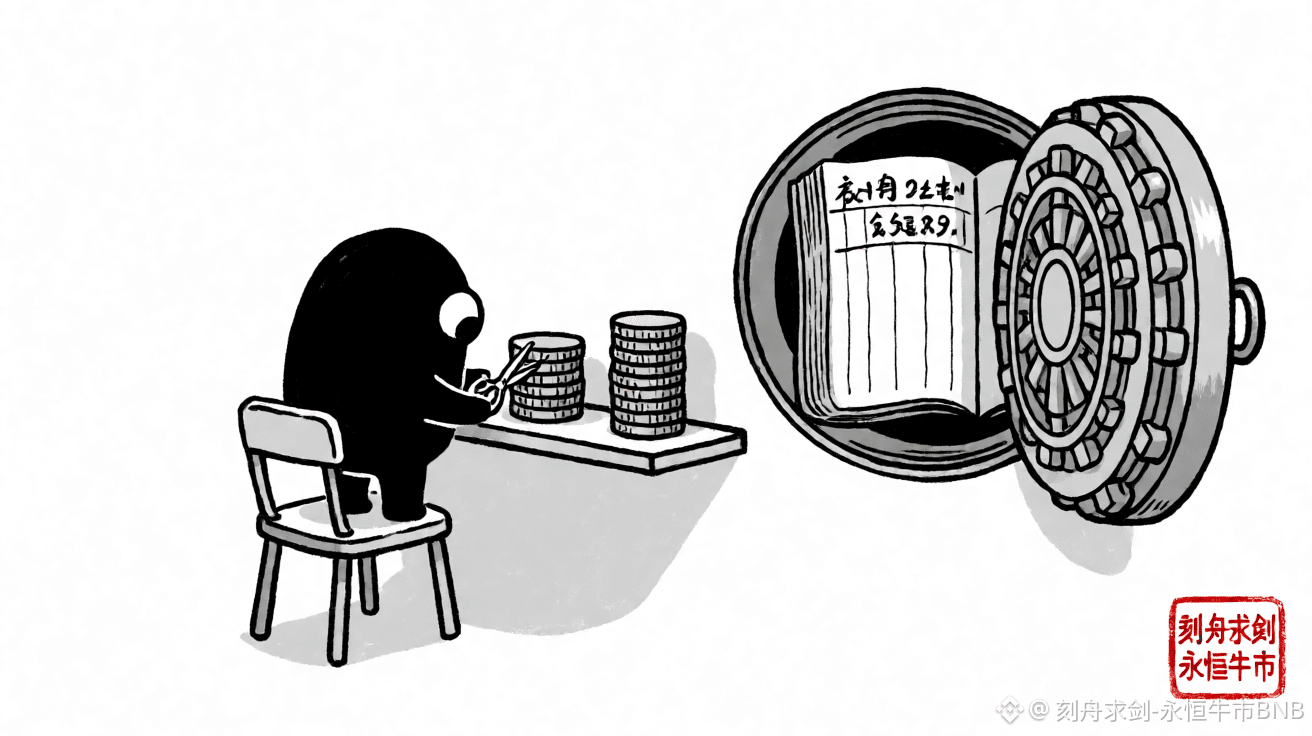
The indicator on the BNB side is something it writes itself: circulating supply of 133.16 million coins, an initial maximum supply of 200 million, with one-third already burned each quarter—totalling 66.84 million. This burn number is reported once per quarter. The amount moves with the platform’s own business activity and its price.
I checked the quantity-and-price from this cycle: 24-hour trading volume is about $1.34 billion, with a turnover rate of 1.28%, which is relatively low among top assets. Over 24 hours it is -2.71%, while the seven-day change for this stretch is +9.76%—and the overtake happens during that upward leg.
The three names that are on Binance spot listings have different supply sources: Ethereum has a market cap of about $335.3 billion and a seven-day change of 14.22%. Its supply cap is left blank, and net issuance is tugged by two lines—usage and burning. Solana is about $69.4 billion, up 21.34% over seven days; its emissions schedule is reduced on an annual basis. BNB is the only one among the three that clearly states a cap and also gets reduced by the project itself by one-third each quarter; its market cap is also the closest to that bank’s ranking.
What gets crossed over is the “market cap” metric—within the two systems, it’s the only item with the same name. But the bank’s $6.26 trillion under custody is tracked under another accounting framework, so its market cap step cannot capture it. Same label doesn’t mean the same origin. When the two readings are offset, this way of measuring doesn’t hold: the quantity burned in the next quarter will keep shrinking, but its market cap keeps rising, suggesting that something else is driving it. The burn amount is reported every quarter as a single line, and it’s the only figure written by the platform itself. BNB’s quoted price sits right there, and balances can also earn interest. This article records viewpoints and does not constitute investment advice.$MUBARAK
$KERNEL
$CHR
#bnb市值超越纽约梅隆银行
First, let’s look at what props up the side that got overtaken. Last year, the bank’s net profit was $5.55 billion and revenue was $40.55 billion. In Q2, earnings per share were $2.45, up 27% year over year. The assets it holds and administers in custody total $6.26 trillion; total assets are $472.3 billion. It has about 46,500 employees, and its clients are spread across hundreds of markets.
The indicator on the BNB side is something it writes itself: circulating supply of 133.16 million coins, an initial maximum supply of 200 million, with one-third already burned each quarter—totalling 66.84 million. This burn number is reported once per quarter. The amount moves with the platform’s own business activity and its price.
I checked the quantity-and-price from this cycle: 24-hour trading volume is about $1.34 billion, with a turnover rate of 1.28%, which is relatively low among top assets. Over 24 hours it is -2.71%, while the seven-day change for this stretch is +9.76%—and the overtake happens during that upward leg.
The three names that are on Binance spot listings have different supply sources: Ethereum has a market cap of about $335.3 billion and a seven-day change of 14.22%. Its supply cap is left blank, and net issuance is tugged by two lines—usage and burning. Solana is about $69.4 billion, up 21.34% over seven days; its emissions schedule is reduced on an annual basis. BNB is the only one among the three that clearly states a cap and also gets reduced by the project itself by one-third each quarter; its market cap is also the closest to that bank’s ranking.
What gets crossed over is the “market cap” metric—within the two systems, it’s the only item with the same name. But the bank’s $6.26 trillion under custody is tracked under another accounting framework, so its market cap step cannot capture it. Same label doesn’t mean the same origin. When the two readings are offset, this way of measuring doesn’t hold: the quantity burned in the next quarter will keep shrinking, but its market cap keeps rising, suggesting that something else is driving it. The burn amount is reported every quarter as a single line, and it’s the only figure written by the platform itself. BNB’s quoted price sits right there, and balances can also earn interest. This article records viewpoints and does not constitute investment advice.$MUBARAK
$KERNEL
$CHR
#bnb市值超越纽约梅隆银行