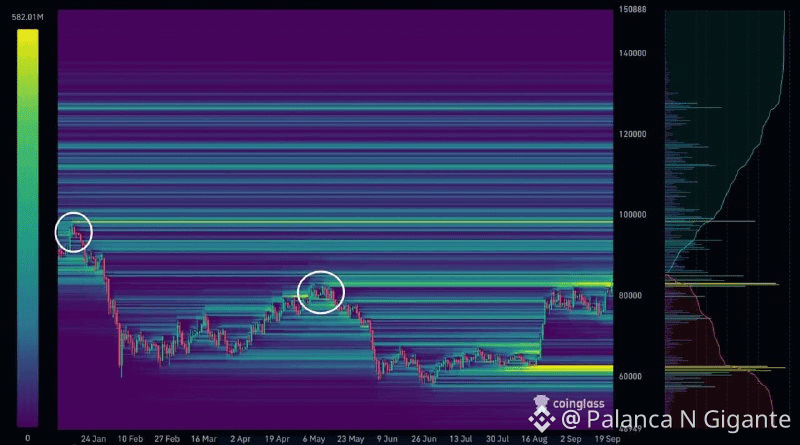
📊 $BTC It surpassed an important Liquidity Level On the liquidity chart, you can see several liquidity levels close to the current price, which align with the extremes over the weekly period: Liquidity above the May market peak has been surpassed✅.
Liquidity above the January high – a long-term target for the bull market🎯.
Liquidity below the July consolidation – an argument for a correction, the best part of the market❗️.
So, the latest upward move is a logical correction to take profits. The price has not yet formed a medium-term consolidation pattern, so we are trying to determine its shape.🕯.
However, I’d like to emphasize that this kind of upward impulse is more typical of a bull market than a bear market. All signals point to the END OF THE BEAR MARKET🐻.
$MUBARAK $CHR 👀👀👀👀
#heatmapupdate #BitcoinBreaksAboveMayHighNears$86K #Liquidations #$14BBitcoinOptionsExpireFriday #bullish
Liquidity above the January high – a long-term target for the bull market🎯.
Liquidity below the July consolidation – an argument for a correction, the best part of the market❗️.
So, the latest upward move is a logical correction to take profits. The price has not yet formed a medium-term consolidation pattern, so we are trying to determine its shape.🕯.
However, I’d like to emphasize that this kind of upward impulse is more typical of a bull market than a bear market. All signals point to the END OF THE BEAR MARKET🐻.
$MUBARAK $CHR 👀👀👀👀
#heatmapupdate #BitcoinBreaksAboveMayHighNears$86K #Liquidations #$14BBitcoinOptionsExpireFriday #bullish