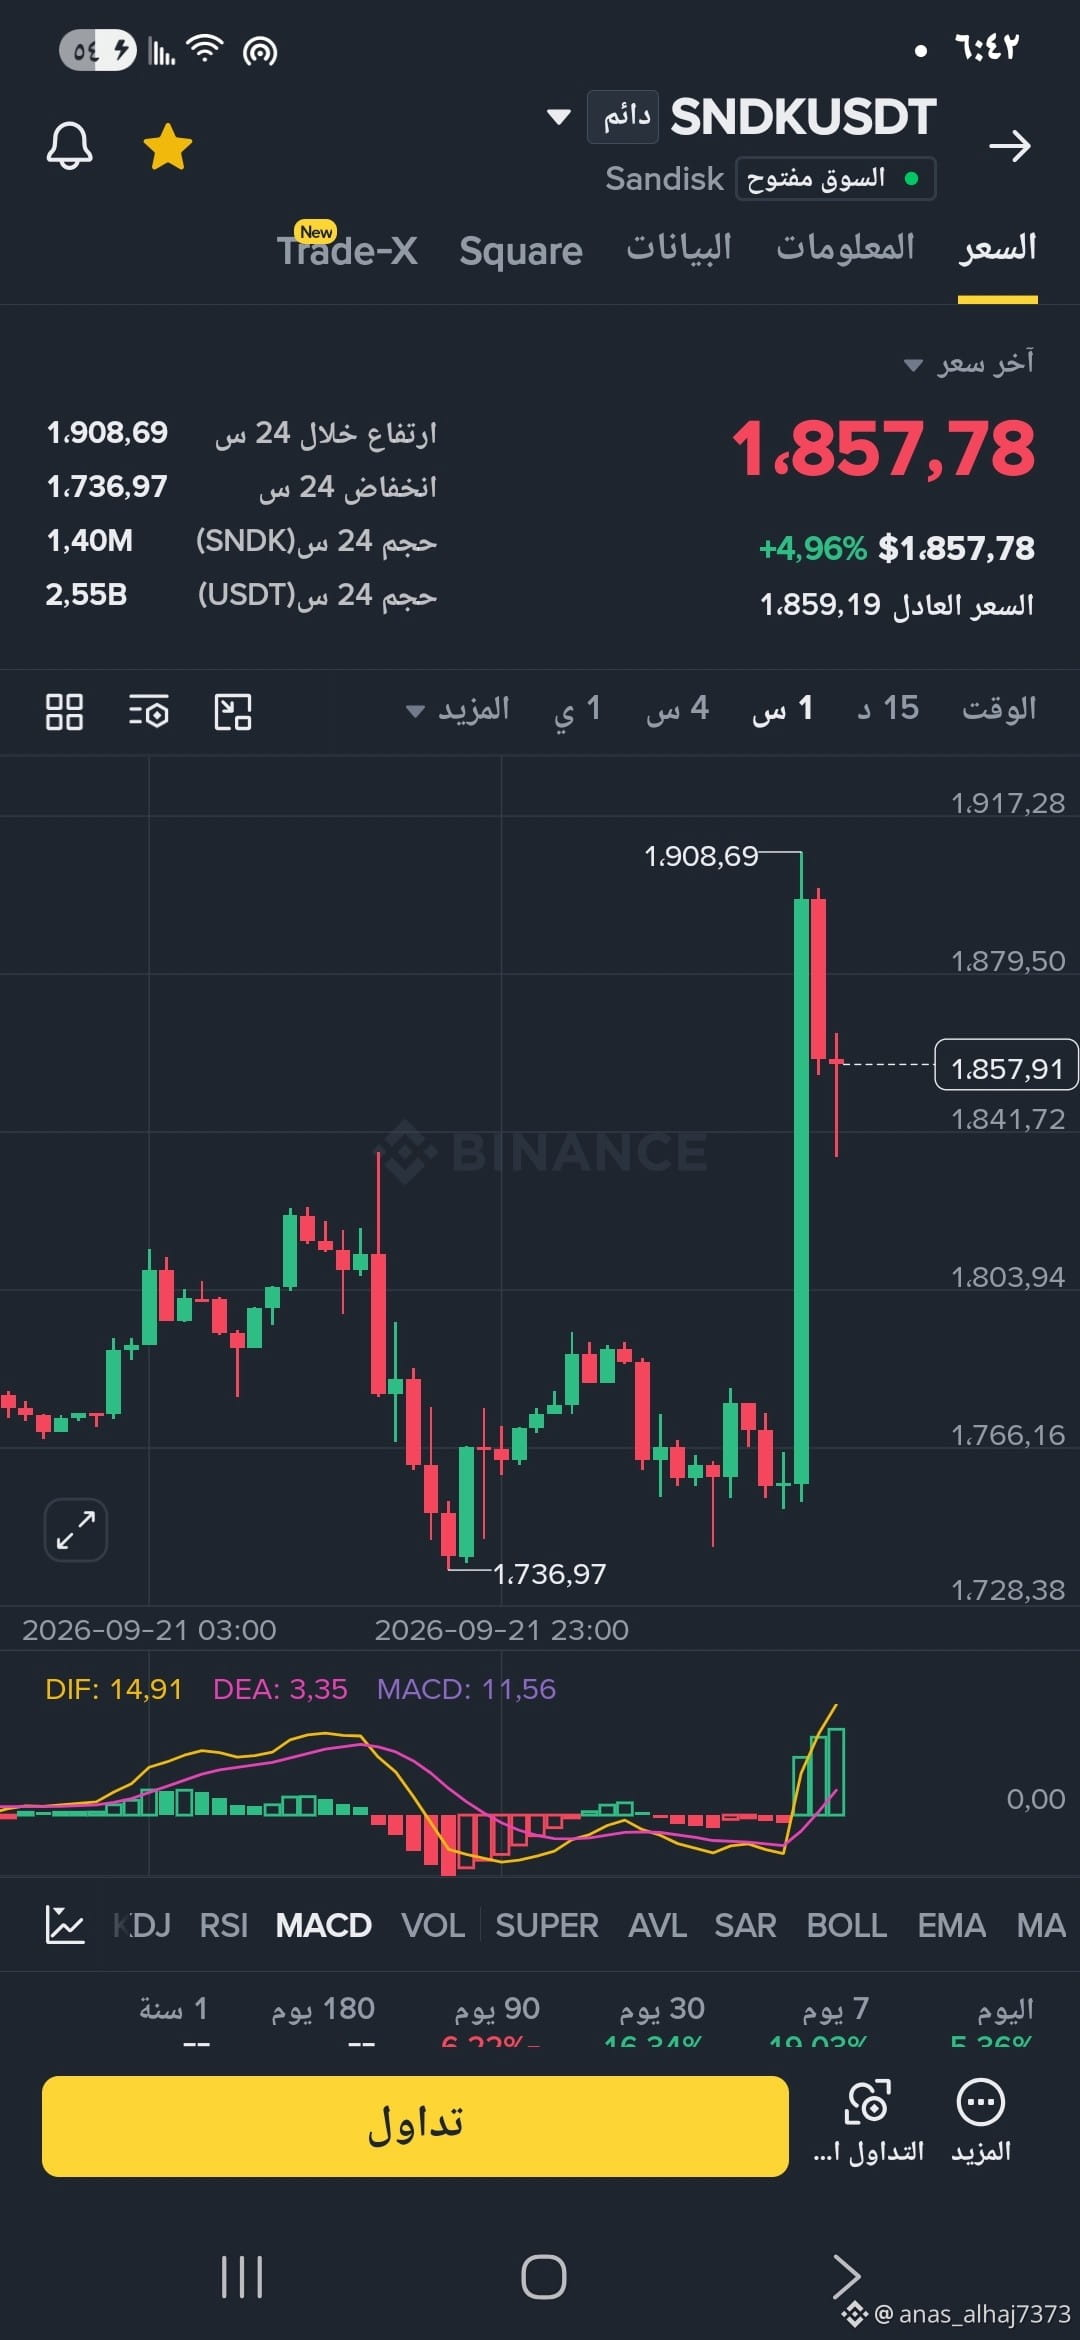
$SNDK shows the chart for SNDKUSDT with a sharp and sudden surge (strong upside) accompanied by a confirmed positive crossover of the MACD indicator.
However, the appearance of a descending red candle immediately after the peak (1.908,69) indicates the start of profit-taking, suggesting that the price may enter a temporary bearish correction to test nearby support levels before determining its next direction.
However, the appearance of a descending red candle immediately after the peak (1.908,69) indicates the start of profit-taking, suggesting that the price may enter a temporary bearish correction to test nearby support levels before determining its next direction.