Trading Idea|9/22 23:21
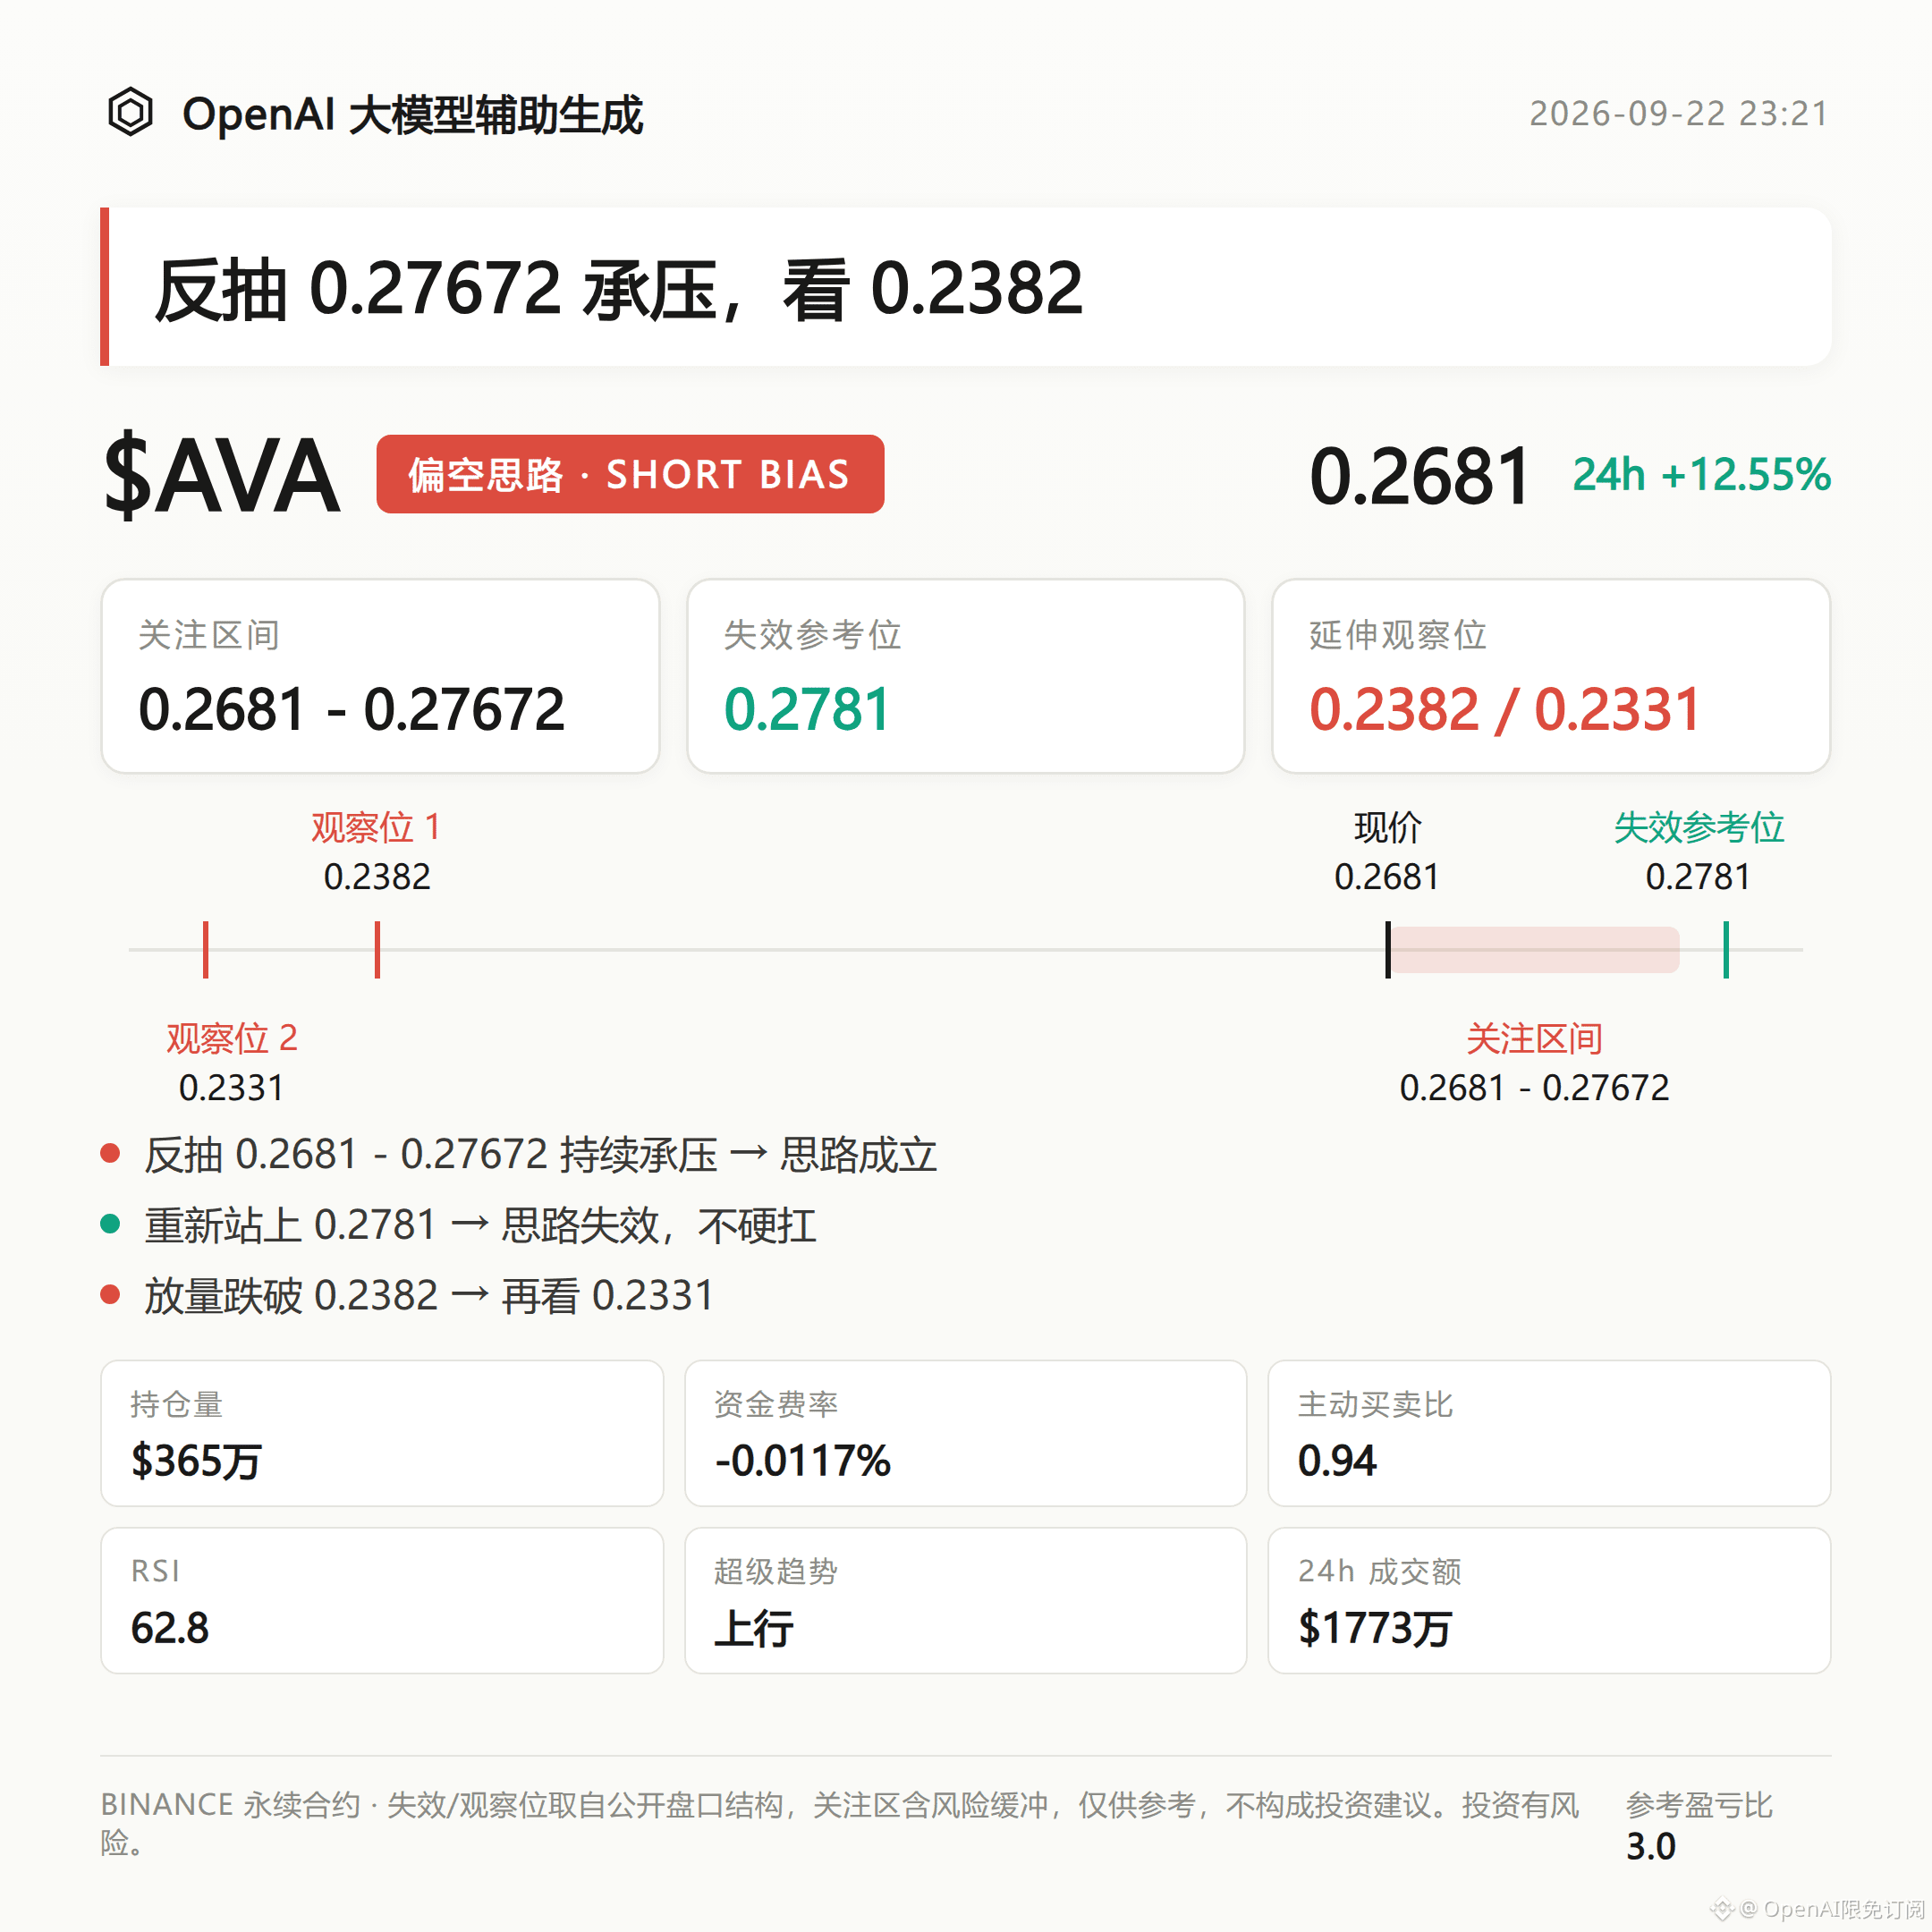
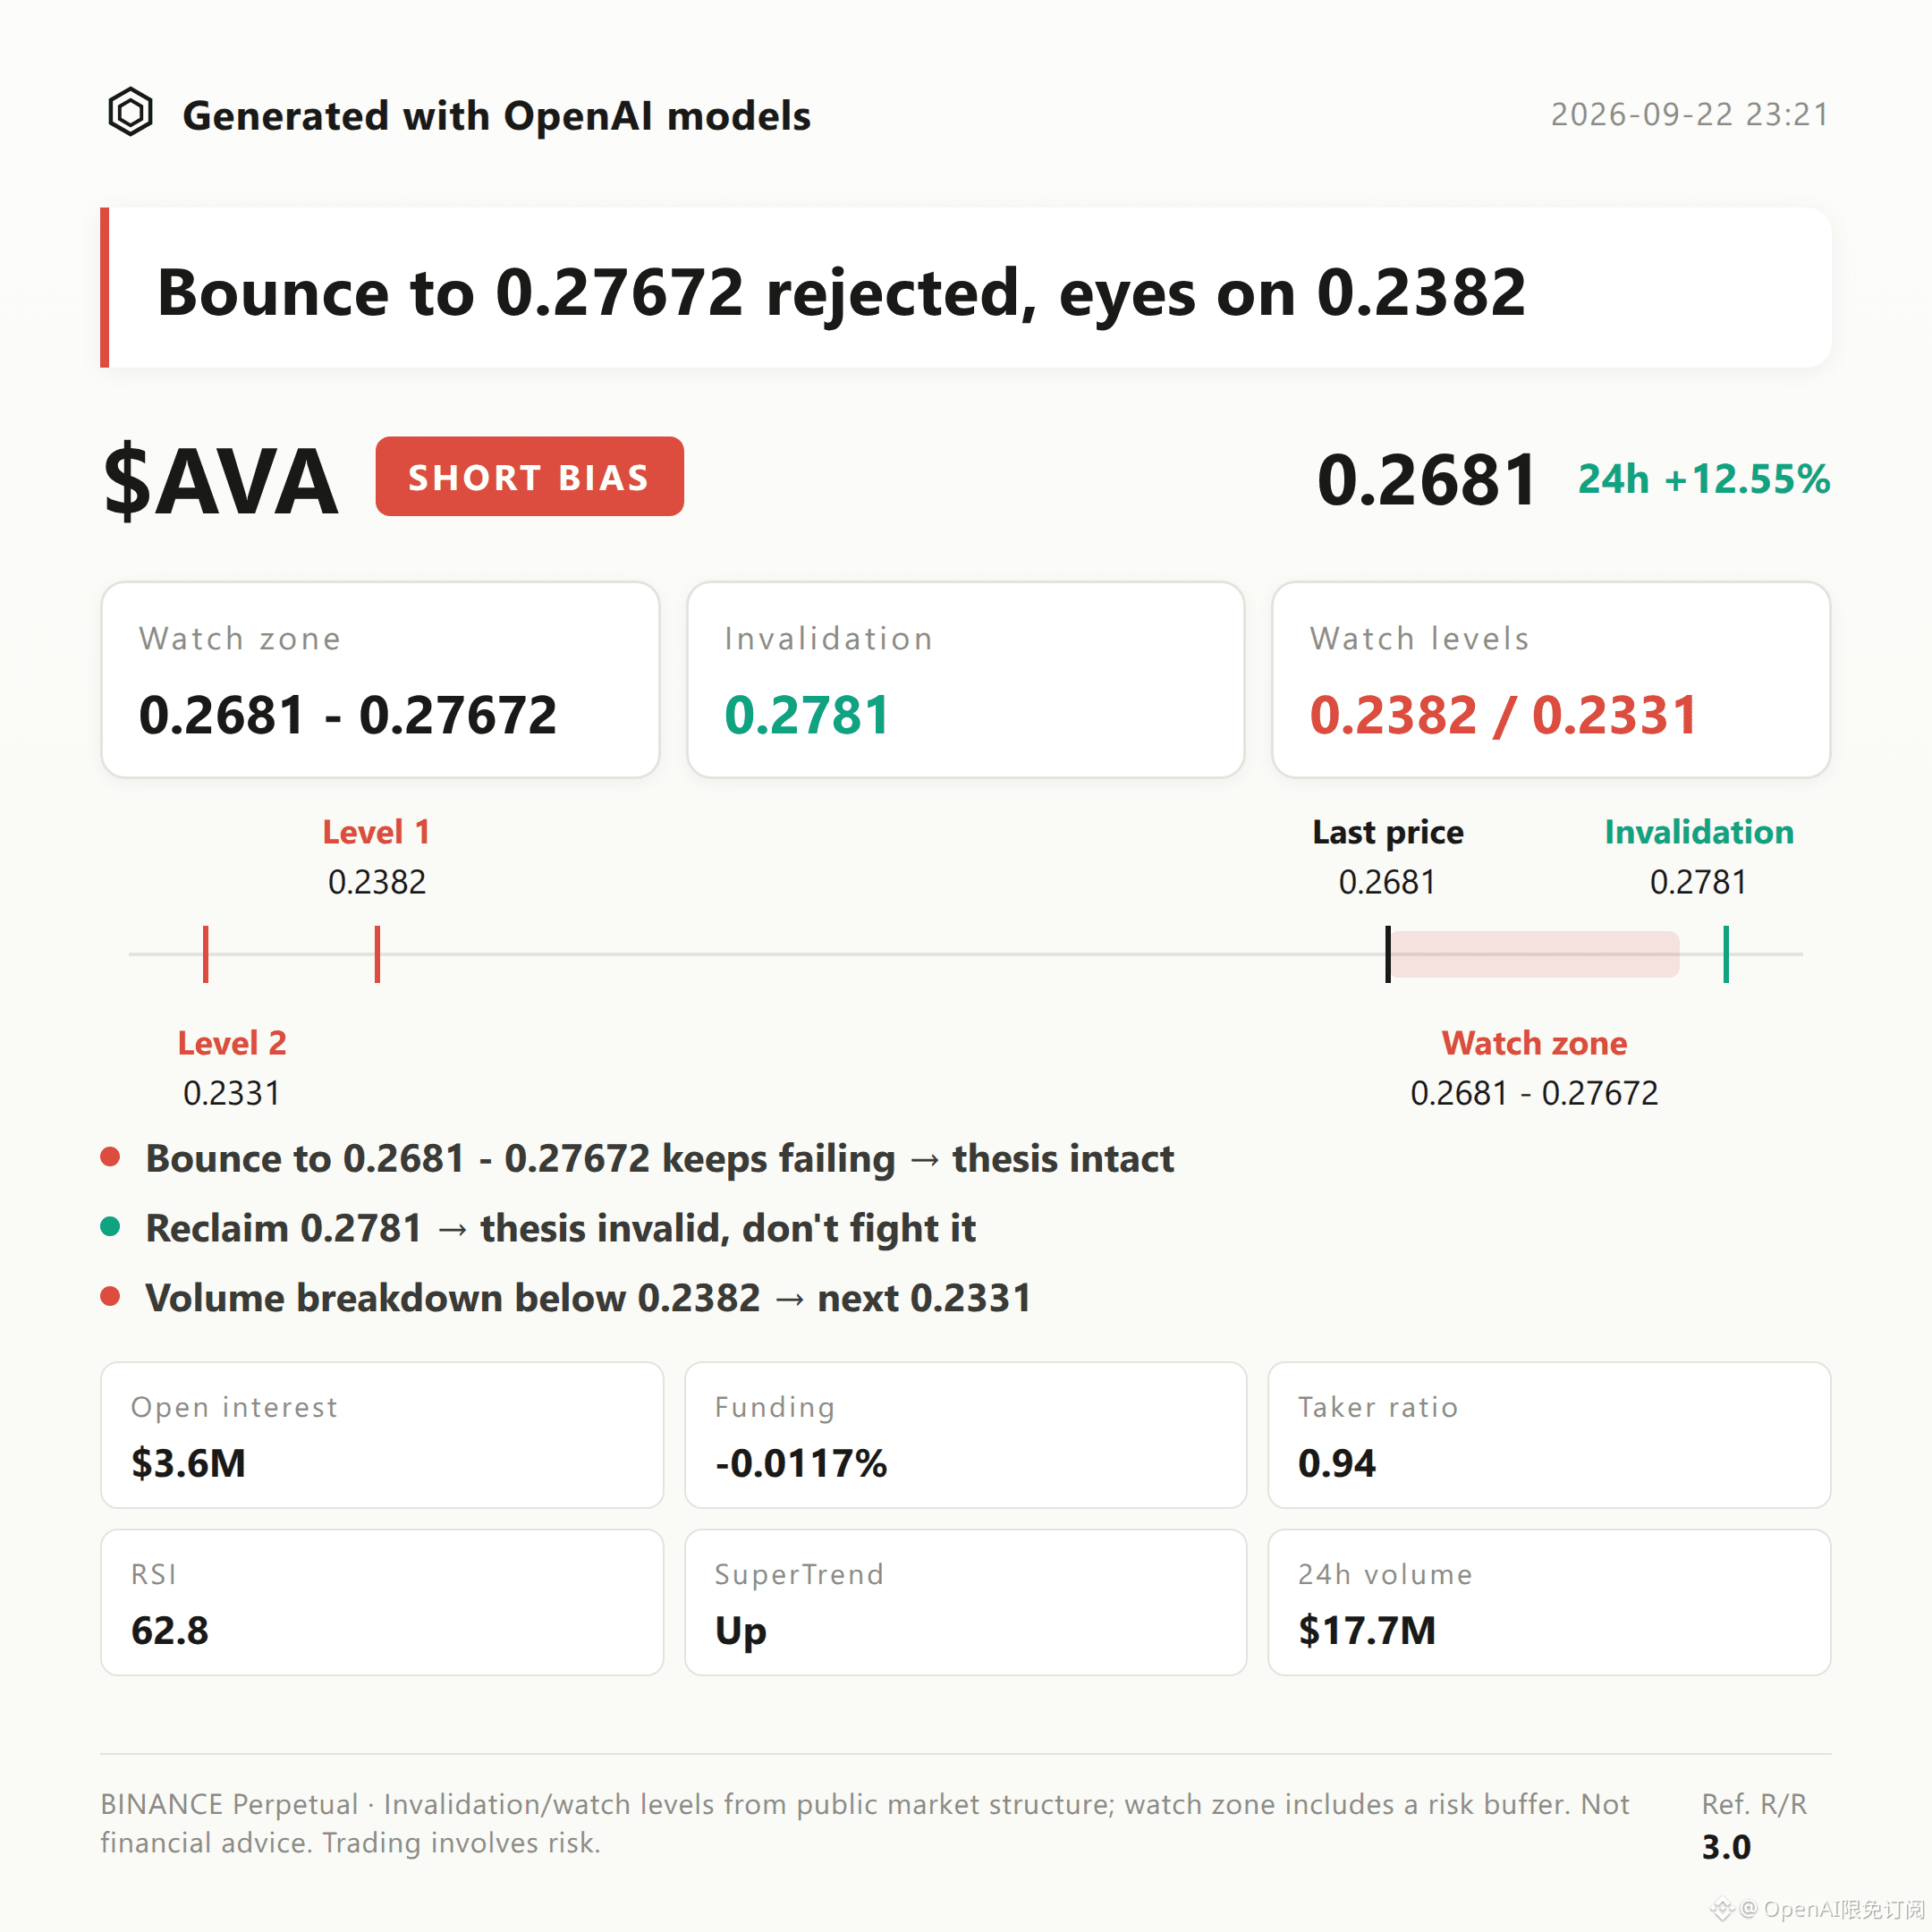
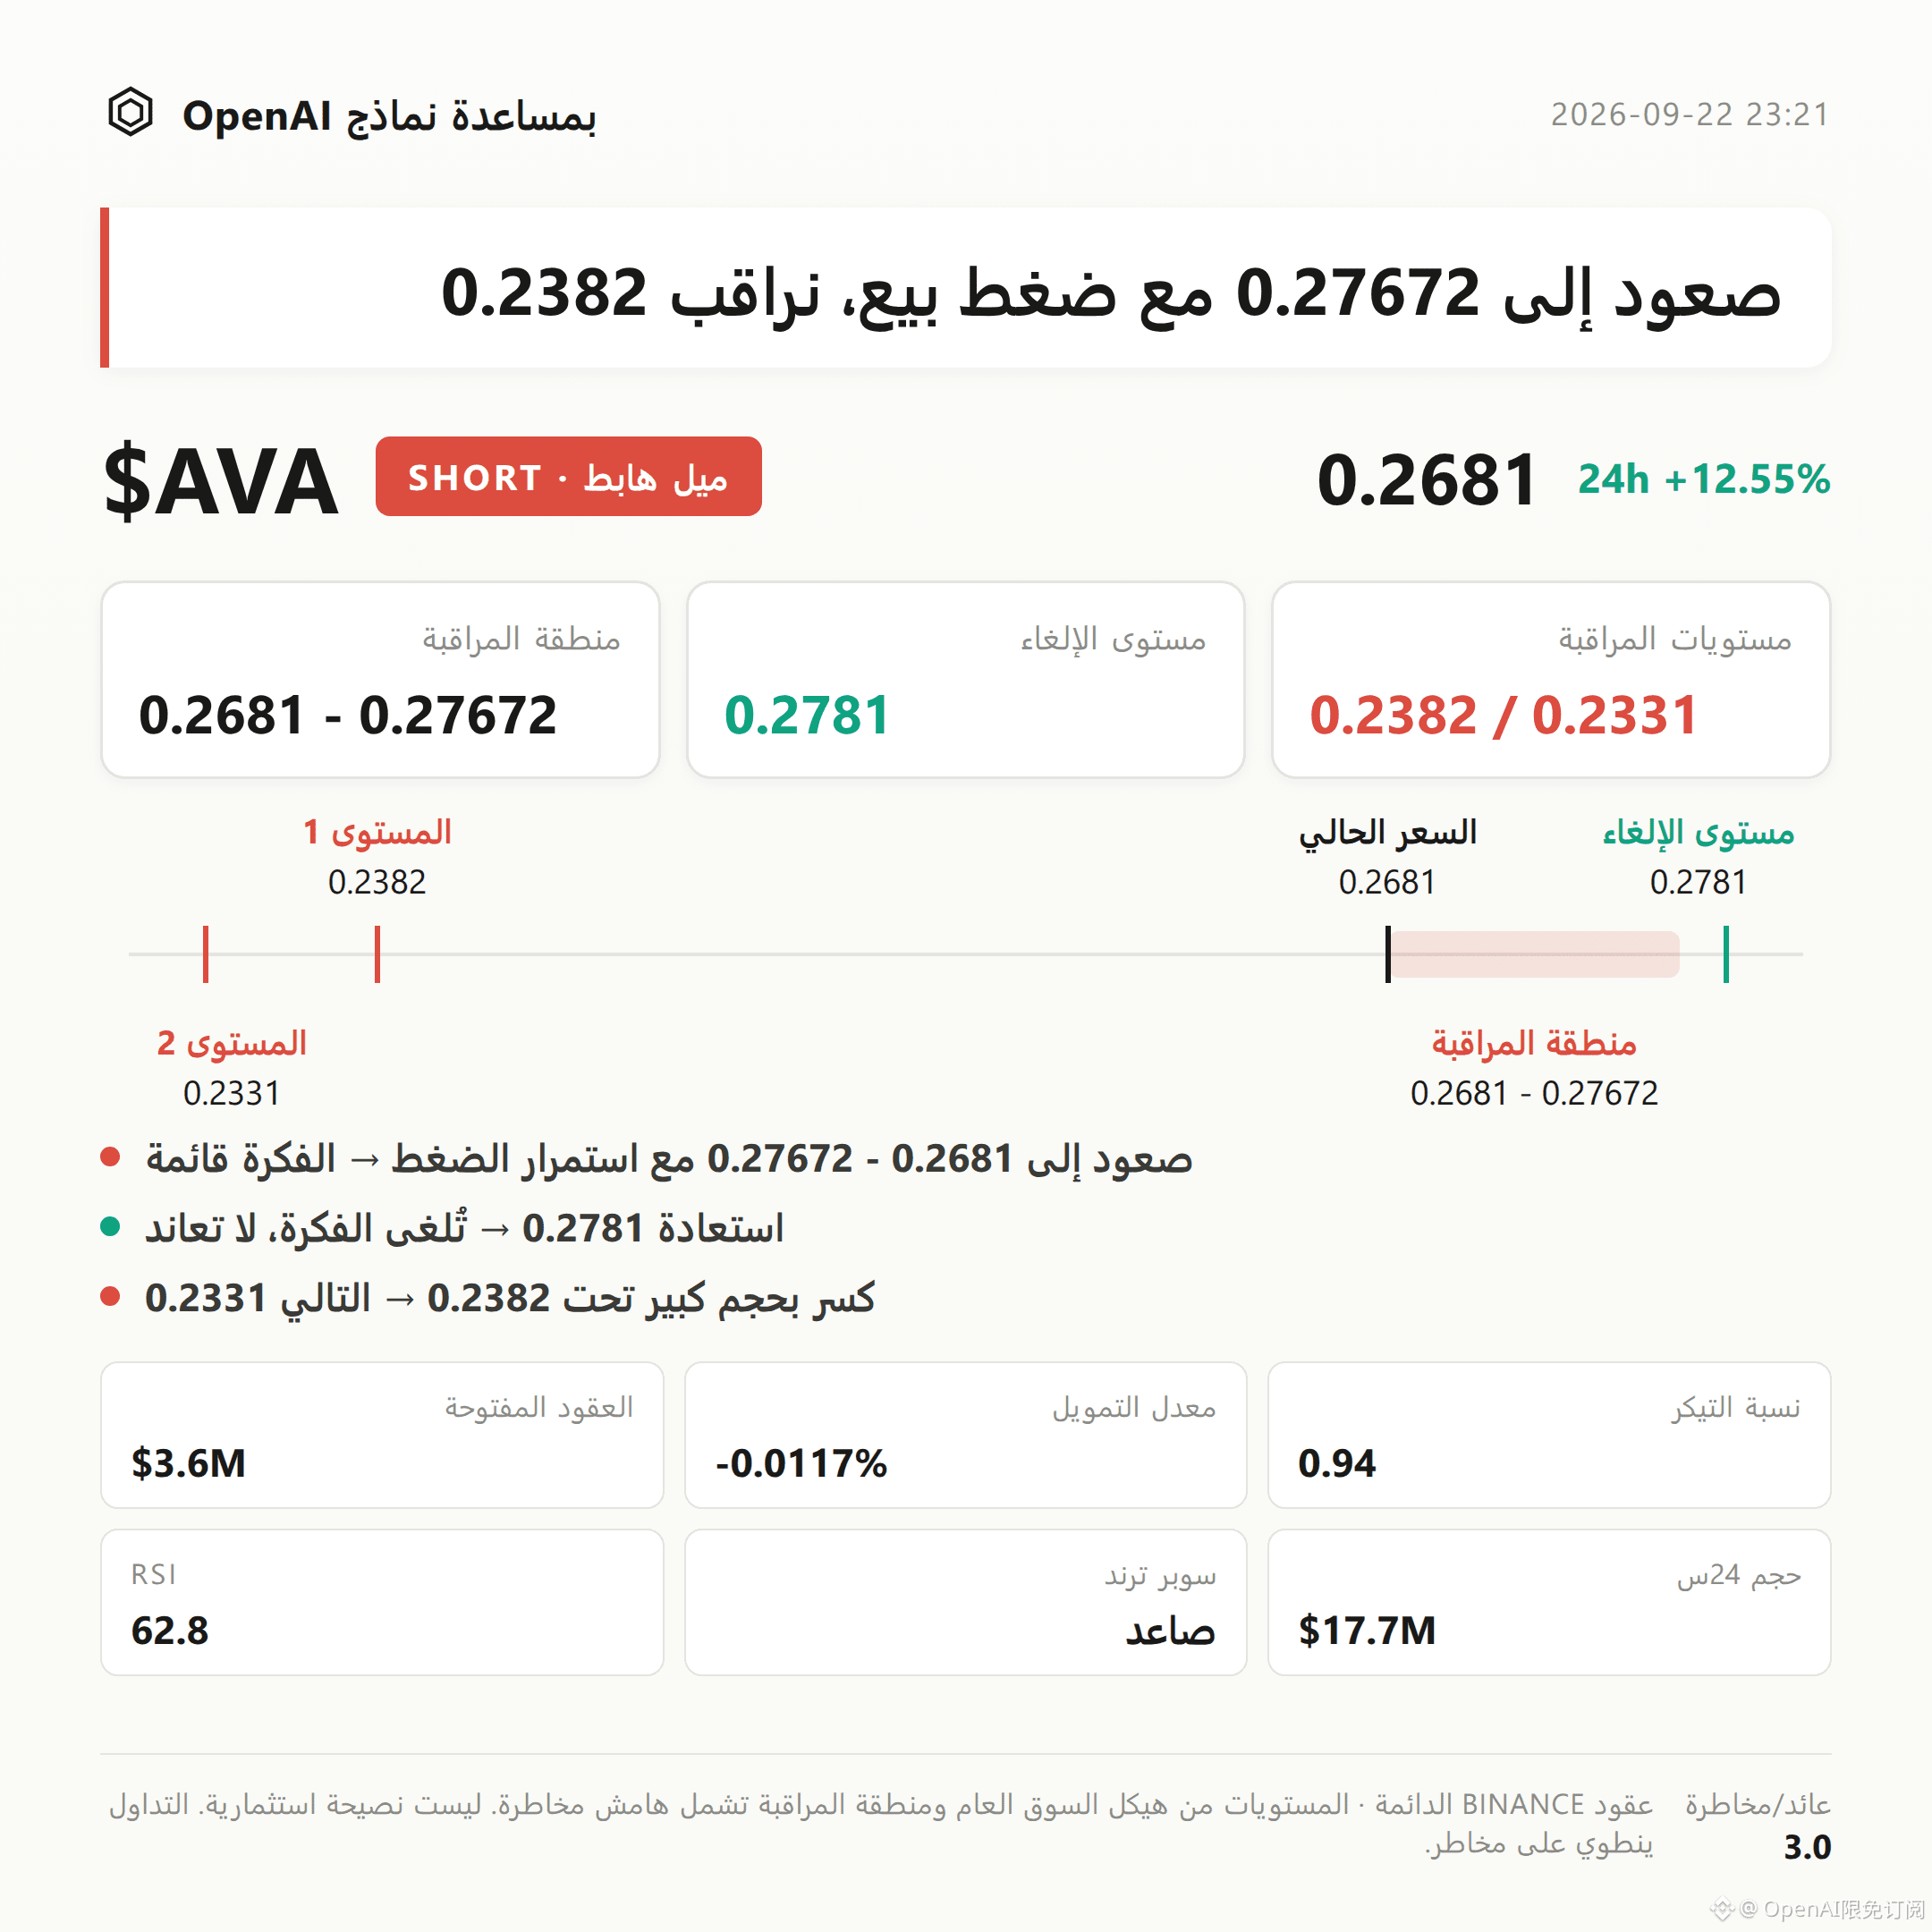
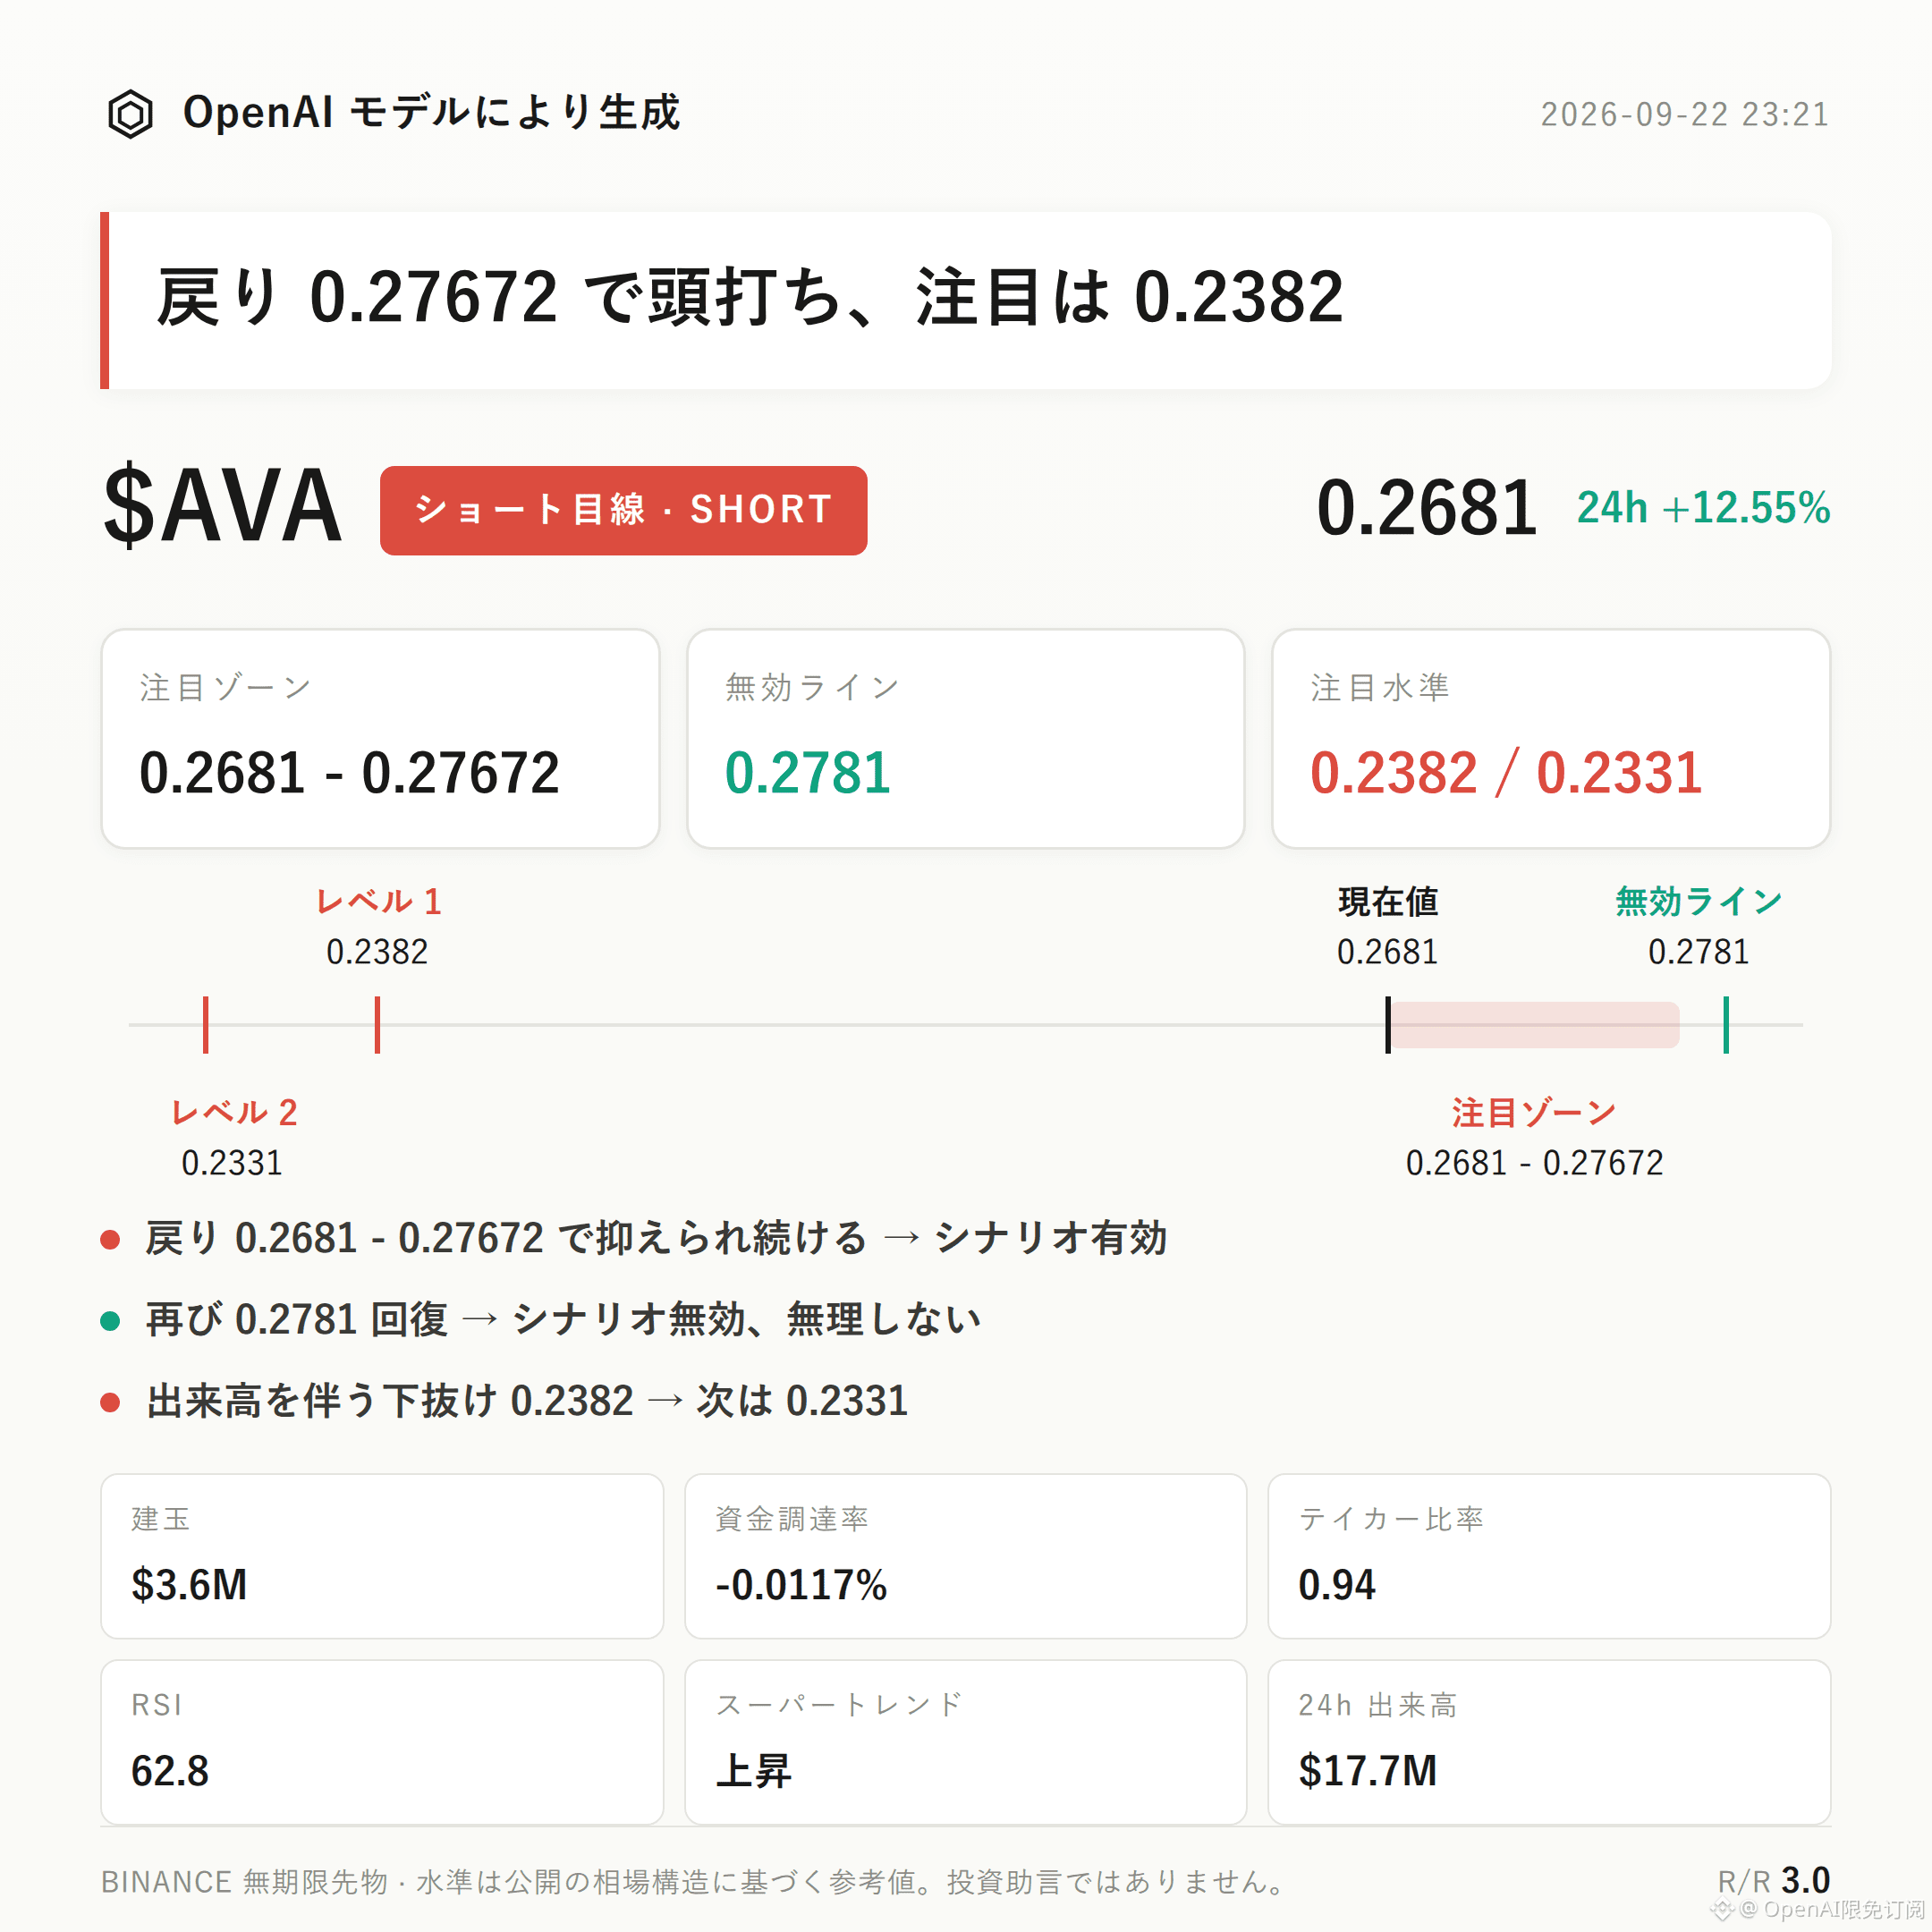
$AVA Slightly bearish outlook | Watch range 0.2681 - 0.27672 | Invalidation reference 0.2781 | Observation levels 0.2382 / 0.2331
$AVA is currently following a bearish-leaning structure.
The key arguments come from the buy/sell pressure being dominated by active sell orders (0.94), the funding rate turning negative (-0.0117%), and the price having approached the nearby resistance zone near the recent high at 0.2781.
The focus is whether the pullback can be suppressed within the resistance zone—this is the critical observation point to validate whether this bearish idea holds.
The recent high is 0.2781, the recent low is 0.2331, and the current price 0.2681 is in the upper half of the range; it has not broken above the prior high yet.
The Bollinger Bands show the upper band at 0.2777, the middle band at 0.258, and the lower band at 0.2382; the current price is running close to the upper band, suggesting pressure is present.
The SuperTrend is still indicating upward movement; RSI is 62.8; MACD shows bullish momentum. Short-term trend indicators have not yet turned—this is the counter-background that this bearish view needs to take seriously.
The 24h price change is +12.55%, indicating bullish momentum is still being released recently. If the pullback fails to be resisted in the resistance zone, the structure may be invalidated at any time.
The 24h trading volume is $17.73M, and open interest is $3.65M with a +2.0% increase over 24h, indicating that new positions are being added while price rises.
The funding rate has turned negative (-0.0117%), showing signs of temporary cooling on the long side.
The long/short account ratio shows longs at 45%. The active buy/sell ratio is 0.94, with active sells slightly stronger—this suggests marginally stronger near-term selling pressure.
For the short side, first look at the focus zone 0.2681 - 0.27672. If the pullback reaches this range and then shows stagnation (stalling) or weakness under pressure, it is more suitable as a post-confirmation observation window rather than simply applying the structure to the current price.
Set the invalidation reference at 0.2781. If price moves back above this level, it means the current pullback structure is broken; the bearish idea should be treated as invalid and this structure should not be viewed as still valid.
For the lower extension observation level, watch 0.2382. If there is a breakdown on increased volume, then further assess how price behaves around the support near 0.2331.
The reference risk/reward ratio is 3.0 as a yardstick for structure judgment, but it does not represent any actual profit guarantee.
Need to state plainly: in this input there is currently no clear bearish reversal signal, but the contract leverage itself is a risk that must be treated separately.
At the same time, trend indicators such as RSI, MACD, and SuperTrend are still in a bullish or upward state, and the 24h price change is positive. This part is not fully aligned with the bearish idea’s direction and forms the counter-background that needs continuous monitoring.
With contract leverage, position discipline is more important than directional judgment.
For reference only and does not constitute investment advice. Contracts involve leverage, and investing is risky.
This article was generated with assistance from an OpenAI model.
$AVA
#Contract analysis
$AVA Slightly bearish outlook | Watch range 0.2681 - 0.27672 | Invalidation reference 0.2781 | Observation levels 0.2382 / 0.2331
$AVA is currently following a bearish-leaning structure.
The key arguments come from the buy/sell pressure being dominated by active sell orders (0.94), the funding rate turning negative (-0.0117%), and the price having approached the nearby resistance zone near the recent high at 0.2781.
The focus is whether the pullback can be suppressed within the resistance zone—this is the critical observation point to validate whether this bearish idea holds.
The recent high is 0.2781, the recent low is 0.2331, and the current price 0.2681 is in the upper half of the range; it has not broken above the prior high yet.
The Bollinger Bands show the upper band at 0.2777, the middle band at 0.258, and the lower band at 0.2382; the current price is running close to the upper band, suggesting pressure is present.
The SuperTrend is still indicating upward movement; RSI is 62.8; MACD shows bullish momentum. Short-term trend indicators have not yet turned—this is the counter-background that this bearish view needs to take seriously.
The 24h price change is +12.55%, indicating bullish momentum is still being released recently. If the pullback fails to be resisted in the resistance zone, the structure may be invalidated at any time.
The 24h trading volume is $17.73M, and open interest is $3.65M with a +2.0% increase over 24h, indicating that new positions are being added while price rises.
The funding rate has turned negative (-0.0117%), showing signs of temporary cooling on the long side.
The long/short account ratio shows longs at 45%. The active buy/sell ratio is 0.94, with active sells slightly stronger—this suggests marginally stronger near-term selling pressure.
For the short side, first look at the focus zone 0.2681 - 0.27672. If the pullback reaches this range and then shows stagnation (stalling) or weakness under pressure, it is more suitable as a post-confirmation observation window rather than simply applying the structure to the current price.
Set the invalidation reference at 0.2781. If price moves back above this level, it means the current pullback structure is broken; the bearish idea should be treated as invalid and this structure should not be viewed as still valid.
For the lower extension observation level, watch 0.2382. If there is a breakdown on increased volume, then further assess how price behaves around the support near 0.2331.
The reference risk/reward ratio is 3.0 as a yardstick for structure judgment, but it does not represent any actual profit guarantee.
Need to state plainly: in this input there is currently no clear bearish reversal signal, but the contract leverage itself is a risk that must be treated separately.
At the same time, trend indicators such as RSI, MACD, and SuperTrend are still in a bullish or upward state, and the 24h price change is positive. This part is not fully aligned with the bearish idea’s direction and forms the counter-background that needs continuous monitoring.
With contract leverage, position discipline is more important than directional judgment.
For reference only and does not constitute investment advice. Contracts involve leverage, and investing is risky.
This article was generated with assistance from an OpenAI model.
$AVA
#Contract analysis