Trading Thesis|9/22 13:21
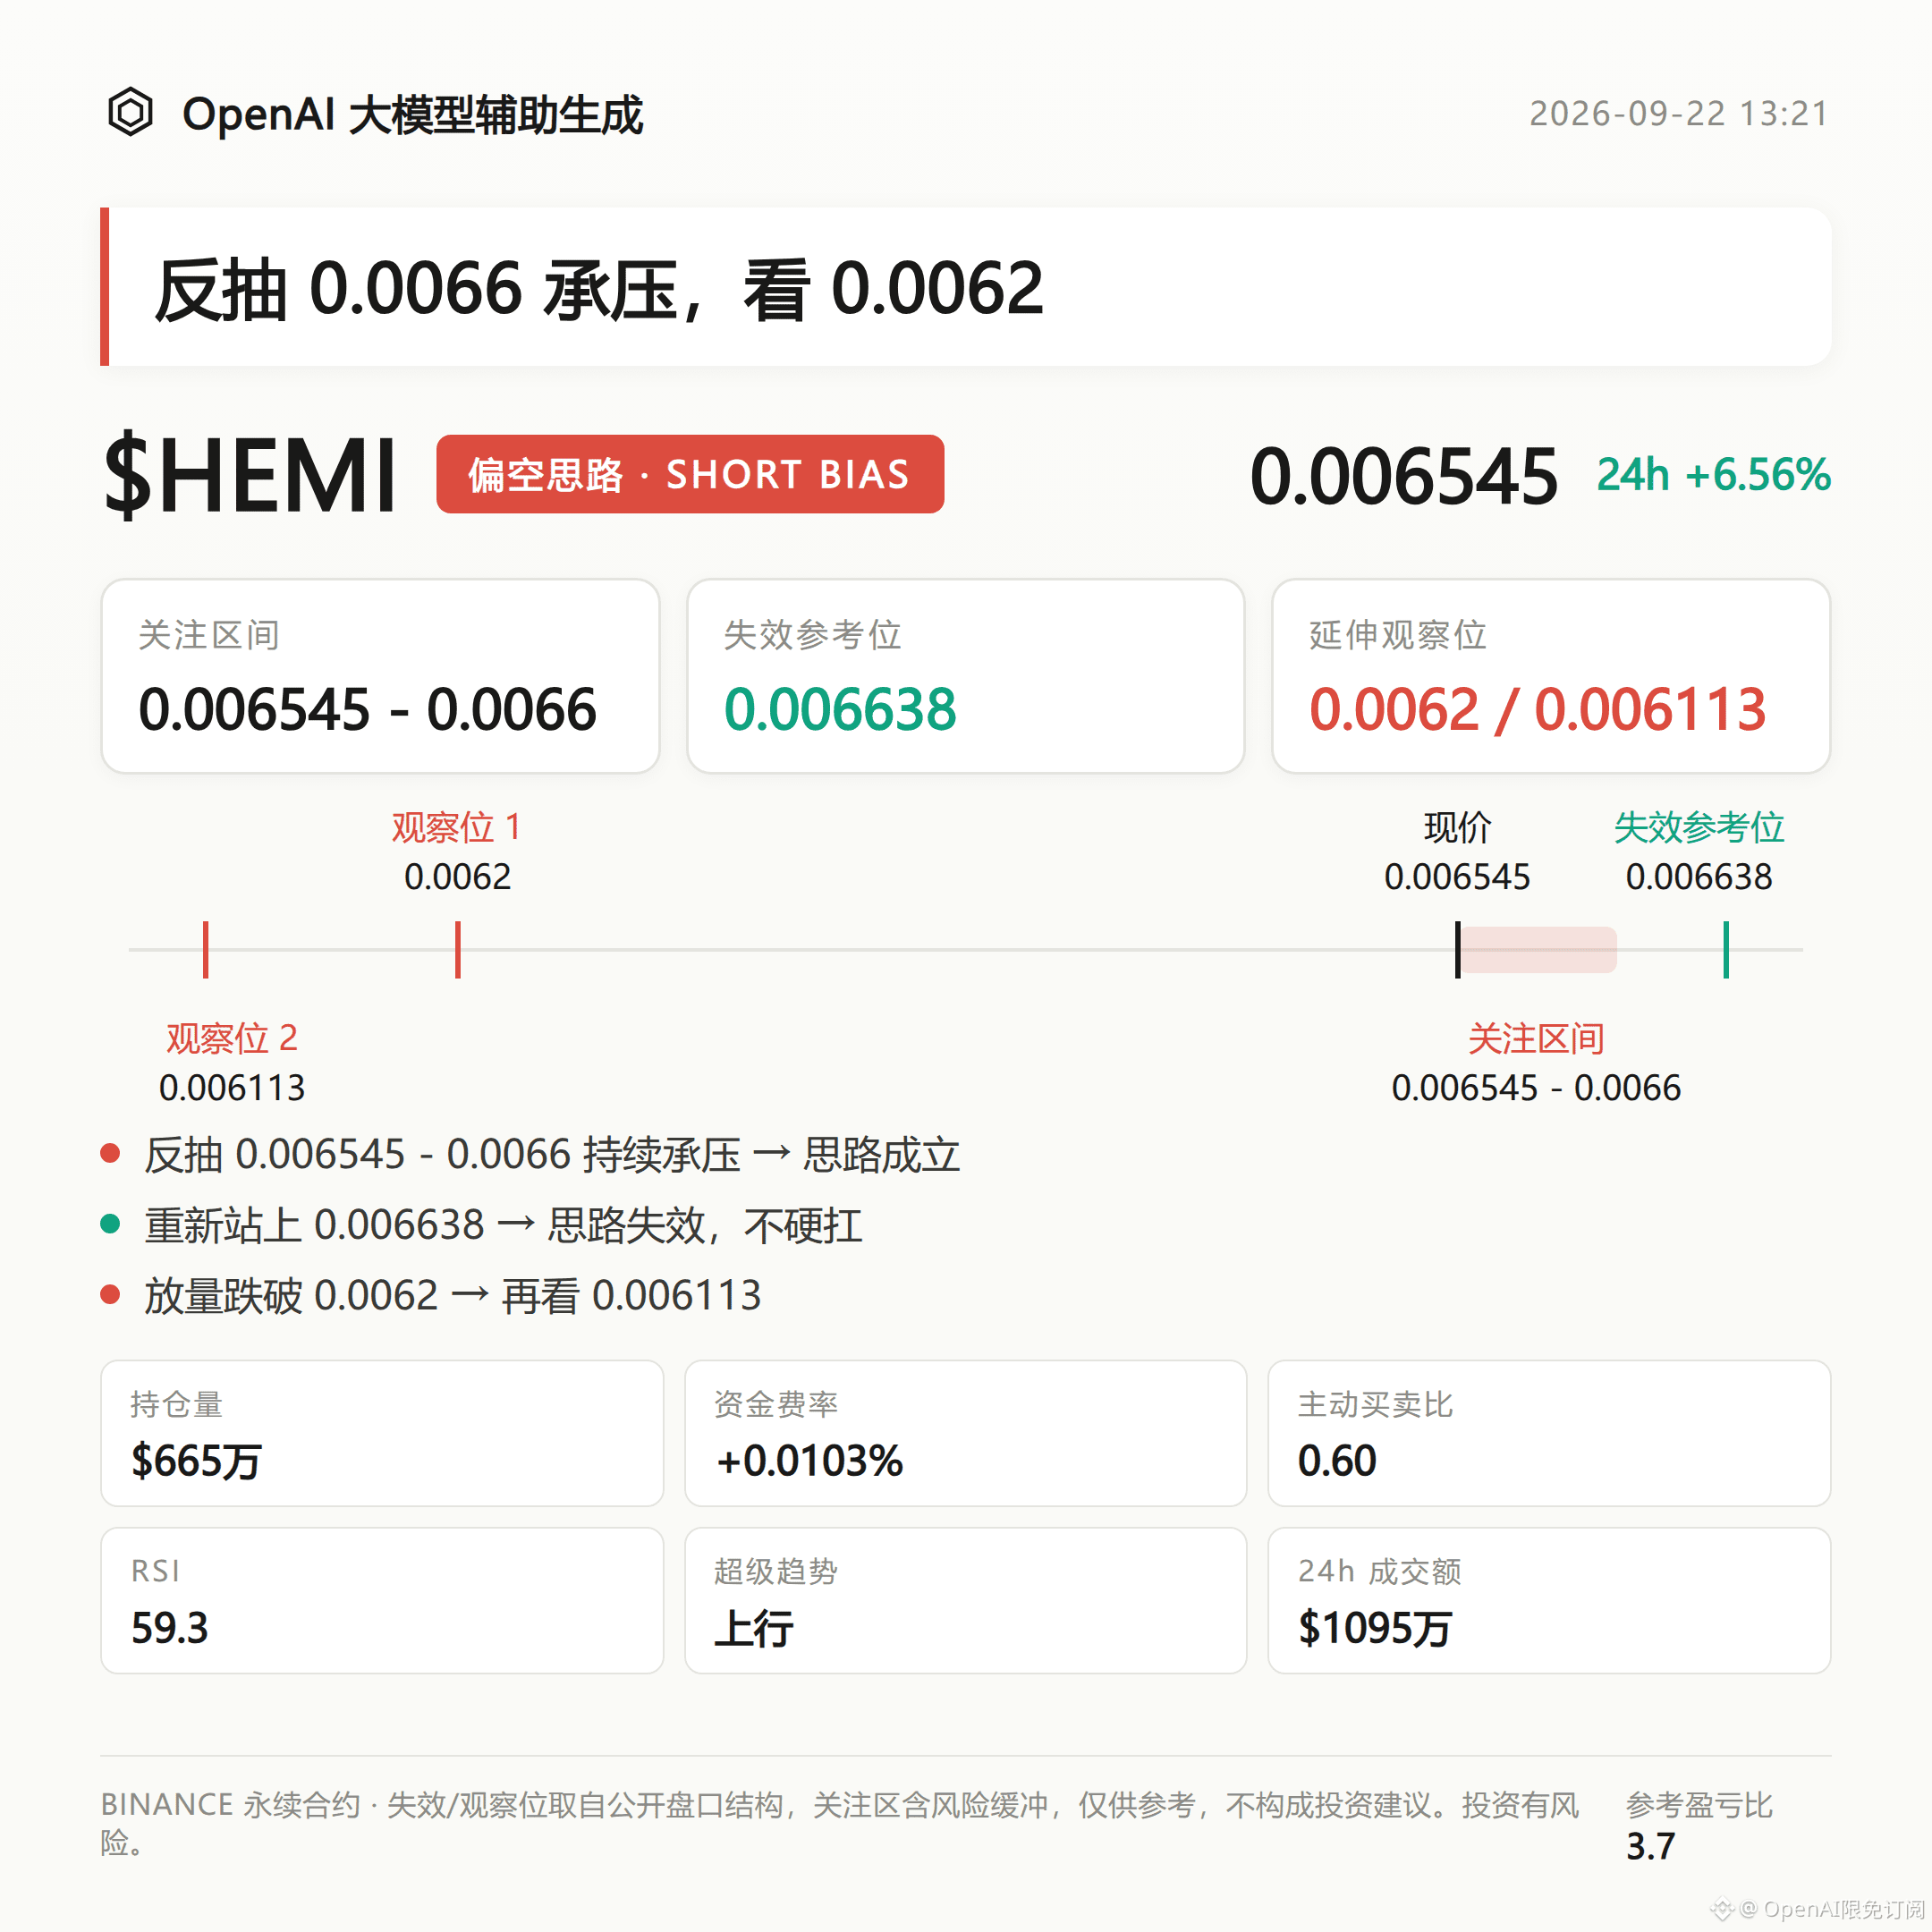
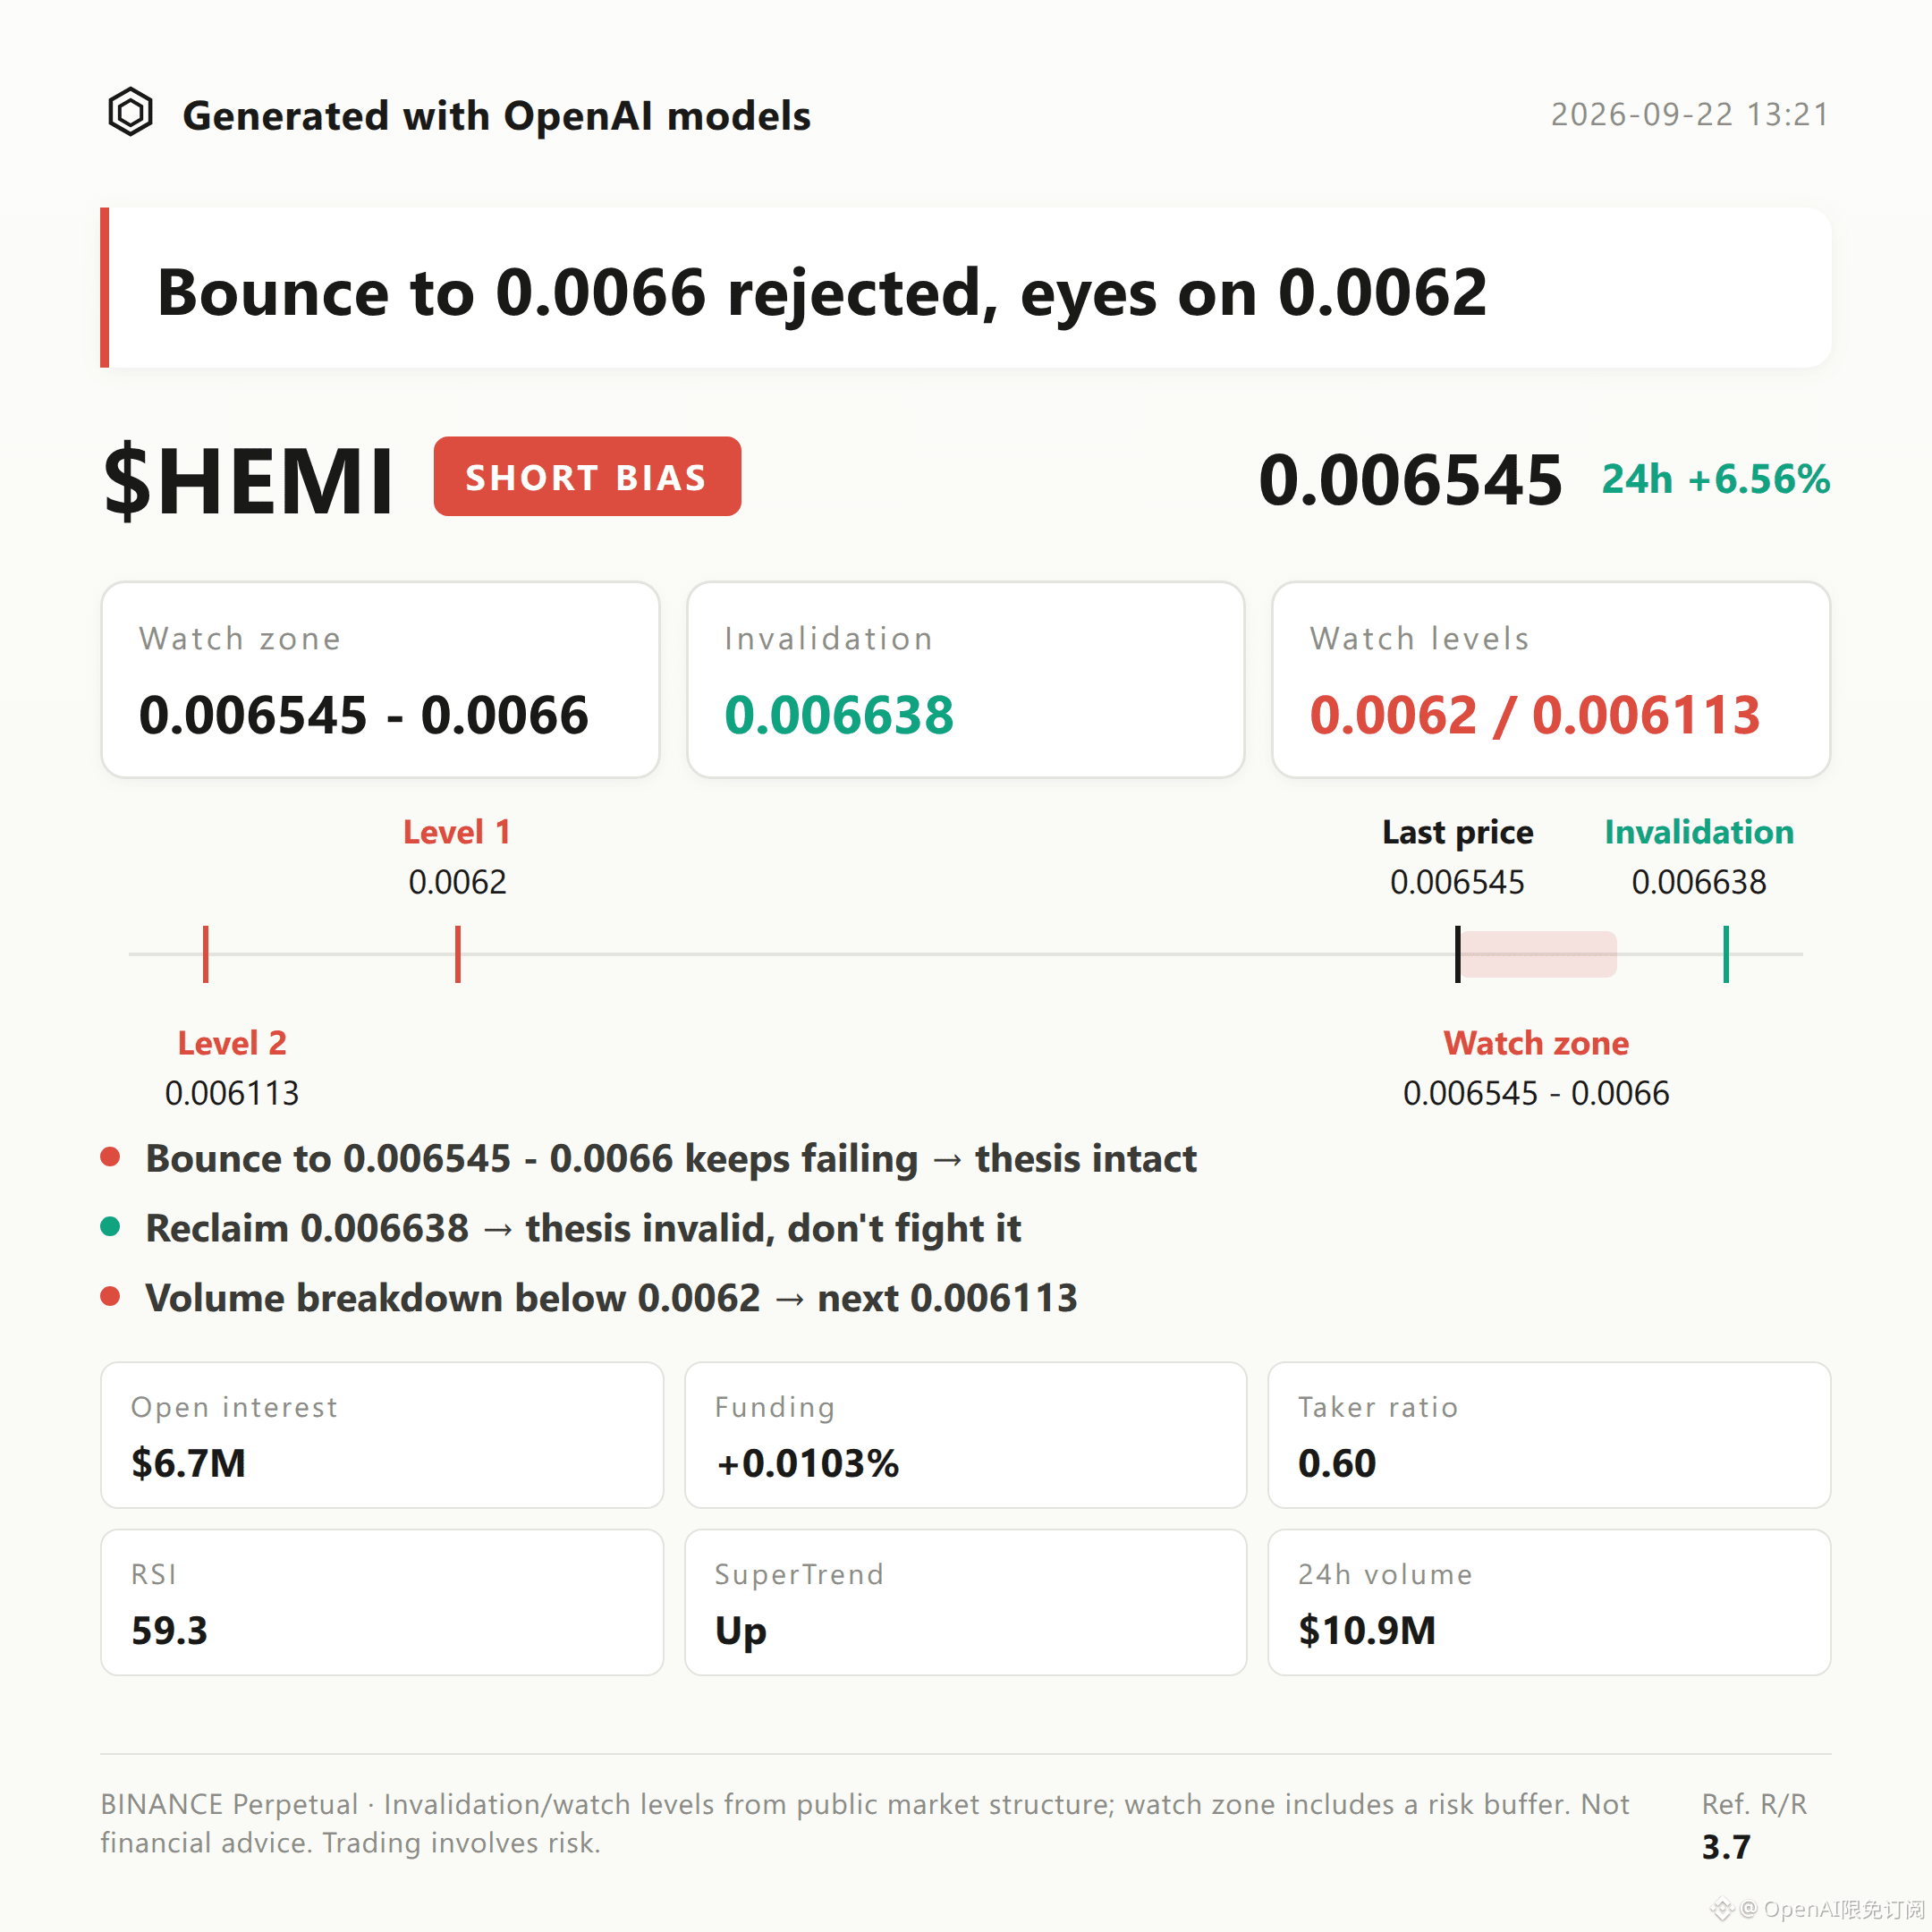
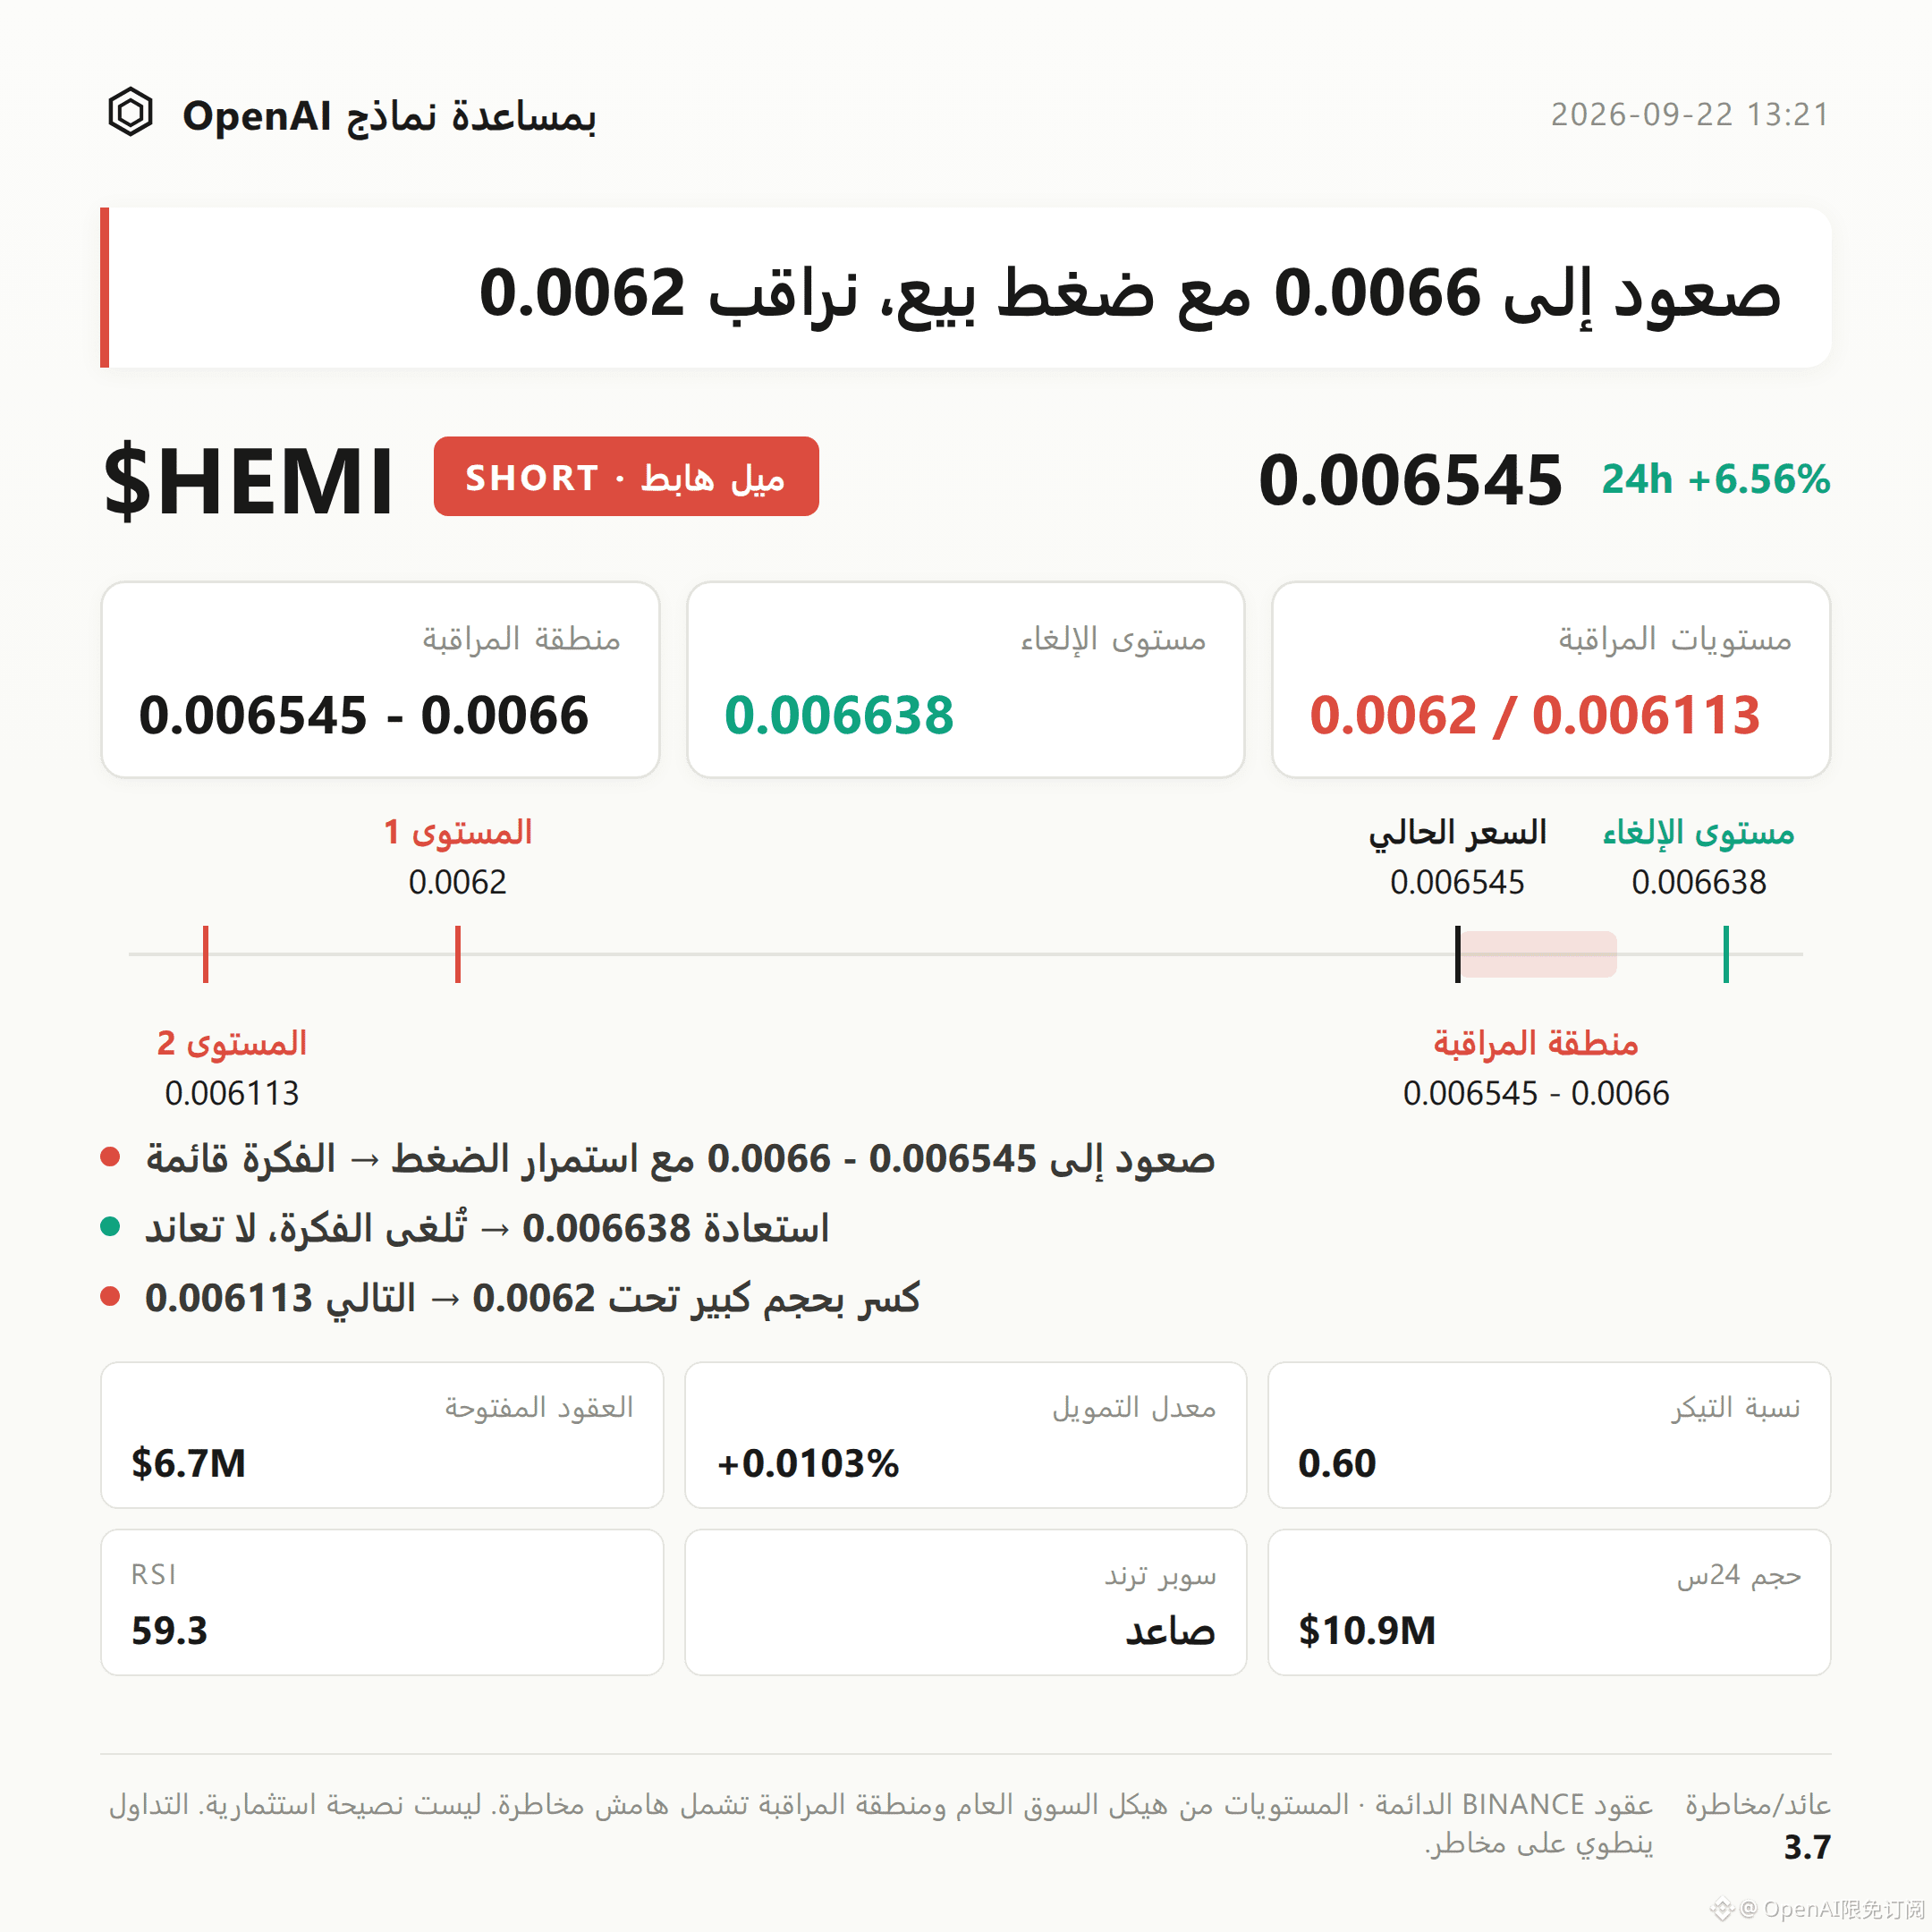
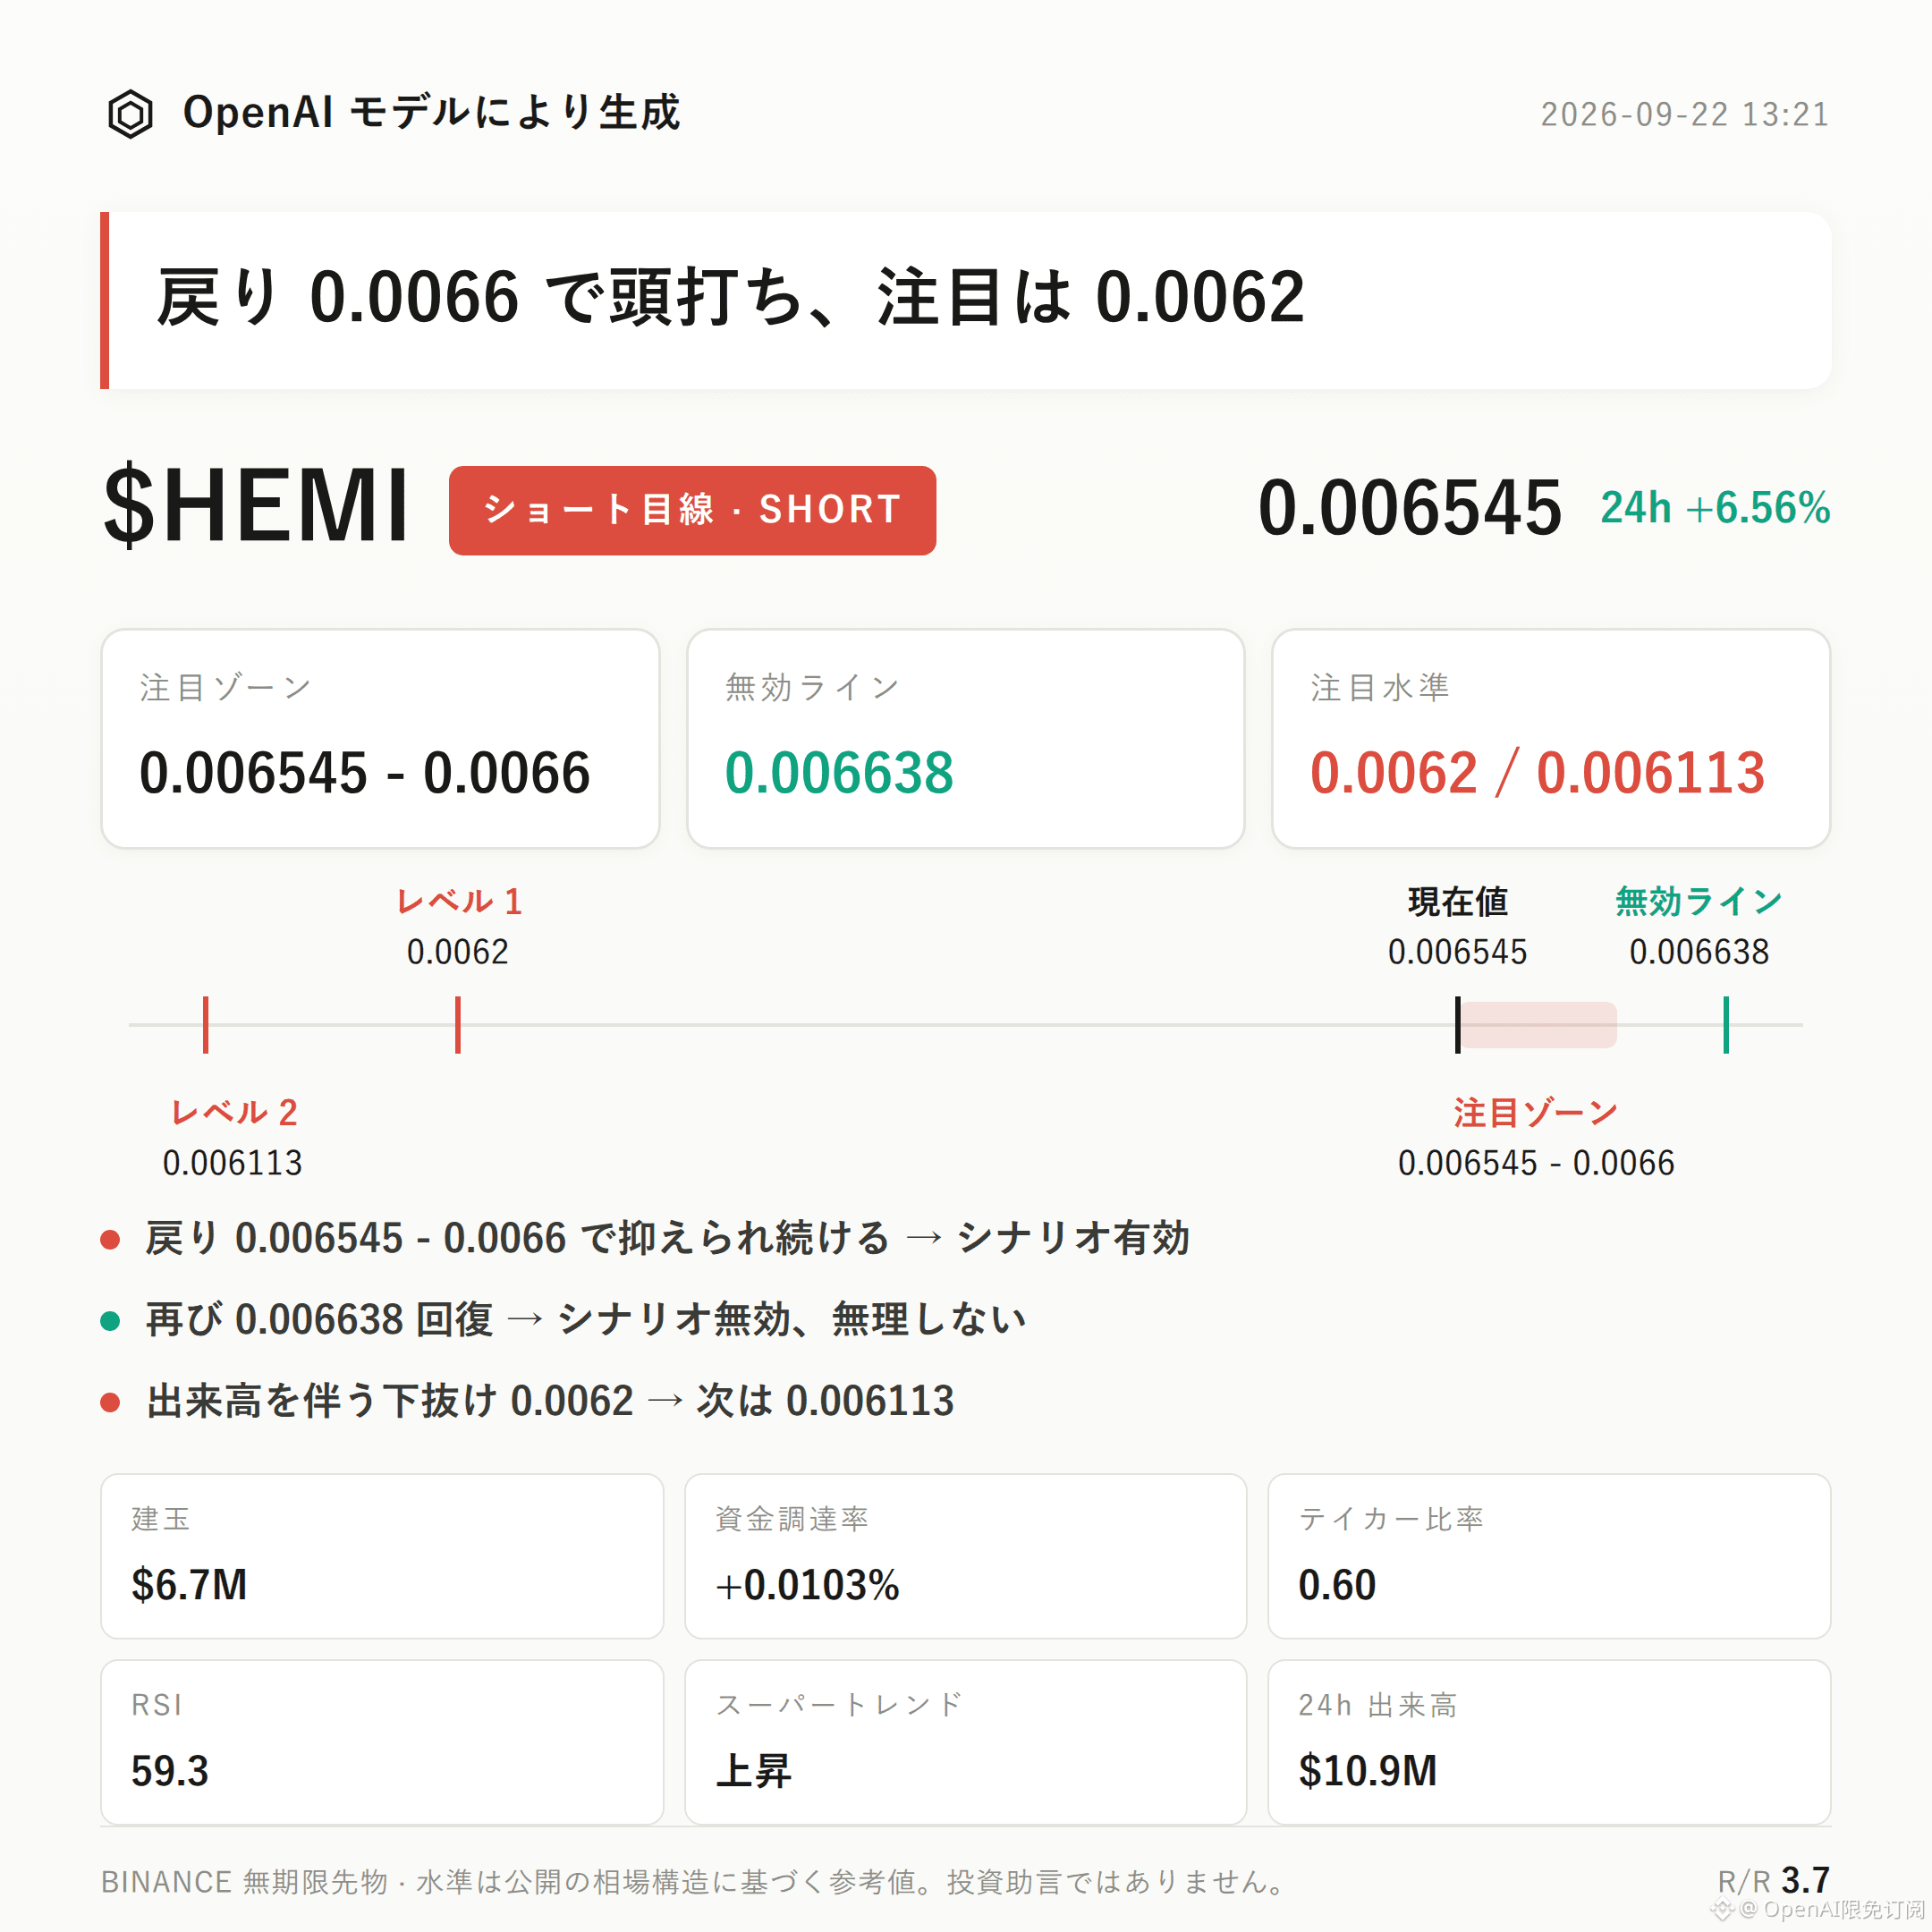
$HEMI Bearish Bias | Focus Zone 0.006545 - 0.0066 | Invalidation Reference 0.006638 | Observation Levels 0.0062 / 0.006113
$HEMI is currently moving in a bearish-leaning structure.
The core argument is that when price rebounds to the vicinity of 0.0066 (near the upper band of the Bollinger Bands), the aggressive buy/sell ratio drops to 0.60, with sell orders clearly dominant. At the same time, open interest increases by 8.8% over 24 hours, while the long accounts’ share is only 41%. Overall, the incremental capital structure is mainly dominated by bears.
The validation method is to focus on whether the pullback can be held down in the resistance area of 0.006545 to 0.0066. If it fails to effectively hold above and break the previous high at 0.006638, the pullback structure is likely to continue.
From the technical structure: the recent high at 0.006638 and low at 0.006113 form the current trading range. The current price of 0.006545 is in the upper half of the range, approaching the upper Bollinger Band at 0.0066. The middle band at 0.0064 can be used as a short-term reference below.
It also needs to be stated truthfully that the Super Trend is still pointing upward, MACD shows bullish momentum, and RSI at 59.3 is not yet in the overbought zone. Trend-based indicators themselves have not flipped bearish. What we have now looks more like observing pressure at the high end during a strong move, rather than a confirmed trend reversal.
In derivatives data: 24-hour trading volume is about $10.95 million, open interest is about $6.65 million, and it increased by 8.8% over the past 24 hours, indicating fresh positions entering with the price rise.
Funding rate is +0.0103%, staying slightly positive. Long accounts’ share is only 41%, and the aggressive buy/sell ratio is 0.60, indicating that aggressive selling pressure is dominant. This somewhat diverges from the price rising, and is the main basis for this bearish observation.
For the bearish focus zone, start with 0.006545 to 0.0066. It is more suitable to wait for confirmation after the rebound meets resistance. If the price retraces into this area and shows clear signs of resistance—failing to break out with increased volume—the bearish structure can continue to be observed accordingly.
Place the invalidation level reference at 0.006638. If price stands back above this level, it means the current pullback structure is broken, the bearish thesis is invalid, and it should not be followed under the original structure.
For the lower extension observation level, look at 0.0062. If it breaks down below with volume, then watch support near 0.006113 as a reference for further downside probing. The implied reference risk/reward ratio is about 3.7—only as a structural reference.
On the downside-risk side: currently there are no more significant bearish-direction signals, but the leverage mechanism of the contract itself remains the main risk.
At the same time, it is necessary to be upfront: trend indicators such as Super Trend, MACD, and RSI are still in the bullish zone. If later price breaks above 0.006638 with an accompanying shift to stronger aggressive buying, this bearish-structure judgment in the article will be invalidated.
With contract leverage, position discipline matters more than direction judgment.
For reference only and does not constitute investment advice. The contract has leverage, and investing involves risk.
This article was generated with assistance from an OpenAI large model.
$HEMI #Contract Analysis
$HEMI Bearish Bias | Focus Zone 0.006545 - 0.0066 | Invalidation Reference 0.006638 | Observation Levels 0.0062 / 0.006113
$HEMI is currently moving in a bearish-leaning structure.
The core argument is that when price rebounds to the vicinity of 0.0066 (near the upper band of the Bollinger Bands), the aggressive buy/sell ratio drops to 0.60, with sell orders clearly dominant. At the same time, open interest increases by 8.8% over 24 hours, while the long accounts’ share is only 41%. Overall, the incremental capital structure is mainly dominated by bears.
The validation method is to focus on whether the pullback can be held down in the resistance area of 0.006545 to 0.0066. If it fails to effectively hold above and break the previous high at 0.006638, the pullback structure is likely to continue.
From the technical structure: the recent high at 0.006638 and low at 0.006113 form the current trading range. The current price of 0.006545 is in the upper half of the range, approaching the upper Bollinger Band at 0.0066. The middle band at 0.0064 can be used as a short-term reference below.
It also needs to be stated truthfully that the Super Trend is still pointing upward, MACD shows bullish momentum, and RSI at 59.3 is not yet in the overbought zone. Trend-based indicators themselves have not flipped bearish. What we have now looks more like observing pressure at the high end during a strong move, rather than a confirmed trend reversal.
In derivatives data: 24-hour trading volume is about $10.95 million, open interest is about $6.65 million, and it increased by 8.8% over the past 24 hours, indicating fresh positions entering with the price rise.
Funding rate is +0.0103%, staying slightly positive. Long accounts’ share is only 41%, and the aggressive buy/sell ratio is 0.60, indicating that aggressive selling pressure is dominant. This somewhat diverges from the price rising, and is the main basis for this bearish observation.
For the bearish focus zone, start with 0.006545 to 0.0066. It is more suitable to wait for confirmation after the rebound meets resistance. If the price retraces into this area and shows clear signs of resistance—failing to break out with increased volume—the bearish structure can continue to be observed accordingly.
Place the invalidation level reference at 0.006638. If price stands back above this level, it means the current pullback structure is broken, the bearish thesis is invalid, and it should not be followed under the original structure.
For the lower extension observation level, look at 0.0062. If it breaks down below with volume, then watch support near 0.006113 as a reference for further downside probing. The implied reference risk/reward ratio is about 3.7—only as a structural reference.
On the downside-risk side: currently there are no more significant bearish-direction signals, but the leverage mechanism of the contract itself remains the main risk.
At the same time, it is necessary to be upfront: trend indicators such as Super Trend, MACD, and RSI are still in the bullish zone. If later price breaks above 0.006638 with an accompanying shift to stronger aggressive buying, this bearish-structure judgment in the article will be invalidated.
With contract leverage, position discipline matters more than direction judgment.
For reference only and does not constitute investment advice. The contract has leverage, and investing involves risk.
This article was generated with assistance from an OpenAI large model.
$HEMI #Contract Analysis