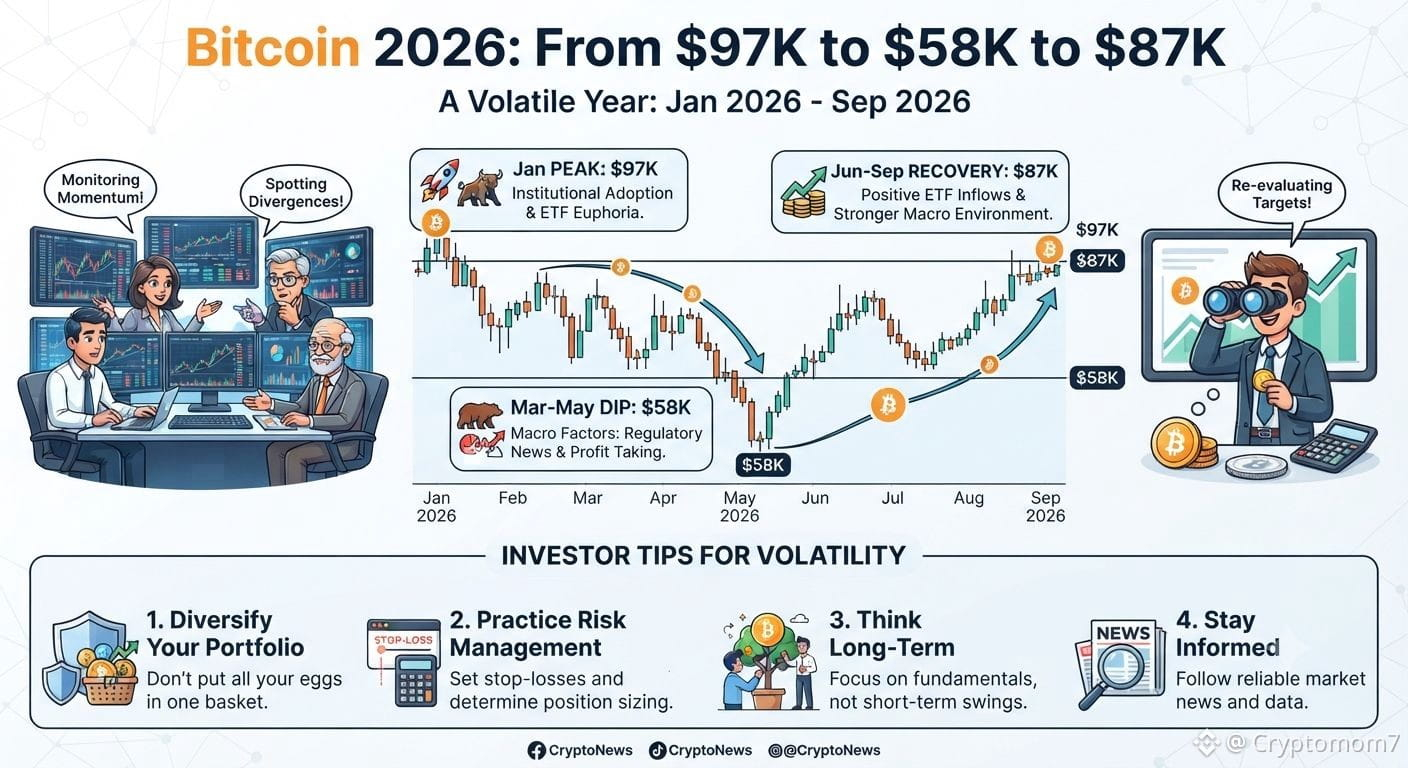
Bitcoin 2026: From $97K → $58K → $87K 📊
Bitcoin’s 2026 journey is a powerful lesson in how quickly market conditions can change.
January: BTC opened around $87.5K and reached nearly $97.9K, but momentum faded. By month-end, U.S. spot Bitcoin ETFs recorded roughly $1.6B in net outflows, while BTC fell below $80K.
February–March: Selling continued. BTC reached around $60K in February before recovering toward $76K. March brought an important positive signal: U.S. spot BTC ETFs recorded $1.32B of net inflows, ending four consecutive months of outflows.
April–May: BTC recovered toward $82.8K before retreating again. The market remained highly sensitive to liquidity, rates and investor positioning.
June: Another major upheaval. BTC fell to roughly $58K. Higher inflation expectations, tighter monetary conditions and the biggest monthly U.S. spot ETF outflow on record—about $4.5B—created heavy pressure.
July–August: The recovery began. BTC moved from the high-$50Ks into the $80K region. Lower-yield expectations, renewed ETF demand, short covering and concerns about U.S. debt helped strengthen the rebound.
September: BTC has now climbed above $87K, its highest level since January. Recent support came from ETF inflows, short covering, improving regulatory sentiment and easing oil prices/yields.
What does 2026 teach investors?
Positive: Institutional demand can return quickly after periods of heavy selling.
Negative: BTC remains highly sensitive to interest rates, inflation, ETF flows, liquidity and global risk sentiment.
The biggest lesson?
BTC did not move in a straight line.
For spot investors, this means:
🔹 Don't judge Bitcoin from one day’s candle.
🔹 Watch ETF flows and macro conditions.
🔹 Use corrections to reassess—not panic.
🔹 Avoid chasing sudden rallies.
🔹 Keep position size appropriate for your risk.
🔹 Always preserve capital for the next unexpected move.
Bitcoin’s 2026 story so far is not simply bullish or bearish.
It is a story of volatility, recovery, liquidity and changing investor demand.
#Bitcoin #BTC #Binance
Bitcoin’s 2026 journey is a powerful lesson in how quickly market conditions can change.
January: BTC opened around $87.5K and reached nearly $97.9K, but momentum faded. By month-end, U.S. spot Bitcoin ETFs recorded roughly $1.6B in net outflows, while BTC fell below $80K.
February–March: Selling continued. BTC reached around $60K in February before recovering toward $76K. March brought an important positive signal: U.S. spot BTC ETFs recorded $1.32B of net inflows, ending four consecutive months of outflows.
April–May: BTC recovered toward $82.8K before retreating again. The market remained highly sensitive to liquidity, rates and investor positioning.
June: Another major upheaval. BTC fell to roughly $58K. Higher inflation expectations, tighter monetary conditions and the biggest monthly U.S. spot ETF outflow on record—about $4.5B—created heavy pressure.
July–August: The recovery began. BTC moved from the high-$50Ks into the $80K region. Lower-yield expectations, renewed ETF demand, short covering and concerns about U.S. debt helped strengthen the rebound.
September: BTC has now climbed above $87K, its highest level since January. Recent support came from ETF inflows, short covering, improving regulatory sentiment and easing oil prices/yields.
What does 2026 teach investors?
Positive: Institutional demand can return quickly after periods of heavy selling.
Negative: BTC remains highly sensitive to interest rates, inflation, ETF flows, liquidity and global risk sentiment.
The biggest lesson?
BTC did not move in a straight line.
For spot investors, this means:
🔹 Don't judge Bitcoin from one day’s candle.
🔹 Watch ETF flows and macro conditions.
🔹 Use corrections to reassess—not panic.
🔹 Avoid chasing sudden rallies.
🔹 Keep position size appropriate for your risk.
🔹 Always preserve capital for the next unexpected move.
Bitcoin’s 2026 story so far is not simply bullish or bearish.
It is a story of volatility, recovery, liquidity and changing investor demand.
#Bitcoin #BTC #Binance