🚀 ¡BITCOIN BREAKS BARRIERS: HISTORIC IMPULSE TOWARD NEW LEVELS! ⚡
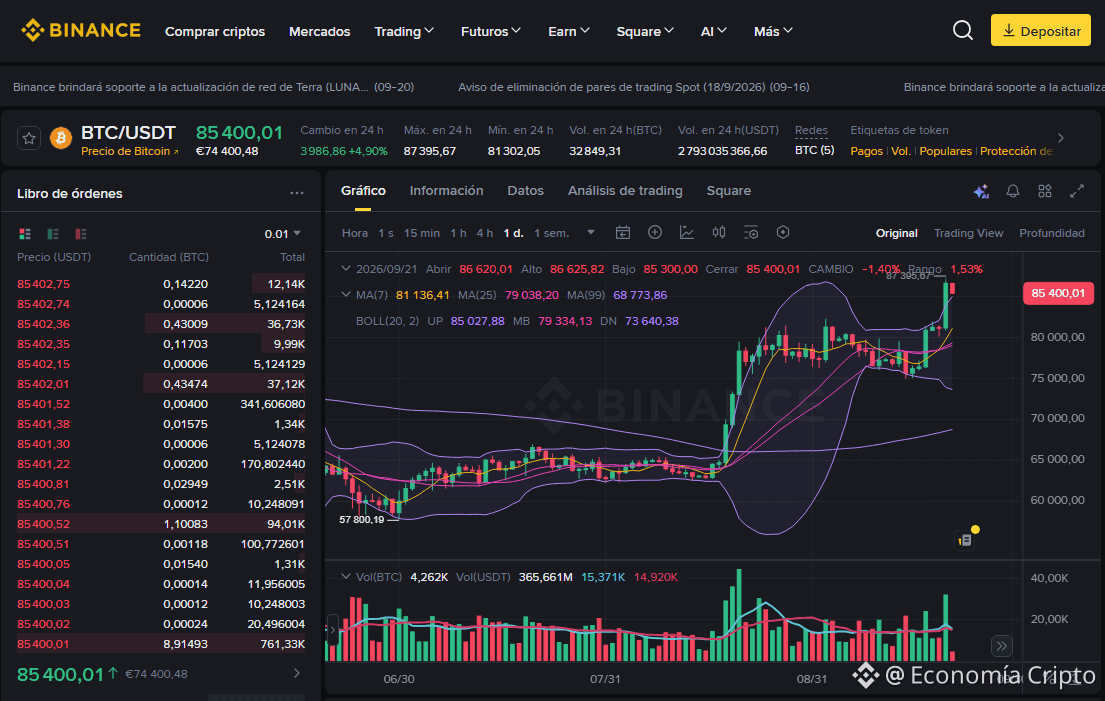
The BTC/USDT pair is trading at 85,400.01, recording a strong advance of +4.90% over the last 24 hours. The daily session shows an open at 86,620.01, a high of 87,395.67, a low of 85,300.00, and a close at 85,400.01 (-1.40% on the daily variation after testing highs), reflecting intense activity and a large volume of trading in the market.
🔍 Trend Analysis and Indicators
Trend: Dominant bullish trend in the short and medium term, characterized by a powerful dynamic impulse.
Moving Averages: The price is trading with notable room above the MA(7) (81,136.41) and the MA(25) (79,038.20), while the underlying macro trend remains solid as it stays well above the MA(99) (68,773.86).
Bollinger Bands: Price presses upward and sits above the upper band UP (85,027.88) since the middle band MB (79,334.13) (with the lower band DN (73,640.38)), indicating a significant expansion of bullish volatility.
Key Levels: Immediate support is consolidating in the 85,300 area, while the main resistance to break is located at the session high of 87,395.67.
💡 Trading Strategy: Buy or Sell?
Buy (Long)?: Trend strength and positioning above the moving averages support the continuation of the uptrend, although trading after touching the upper band requires caution via tactical pullback entries and a properly adjusted Stop Loss.
Sell (Short)?: Trading downward presents a high risk due to the current bullish trend’s strength; it would only be considered in case of a sustained loss of the key supports.
#Bitcoin #AnalisisTecnico #CryptoTrading
The Lord blesses and prospers whoever operates here, in the name of Jesus, because your word says: "Mine is the silver, and mine is the gold, says the LORD of hosts". Hageo 2:8 RV1960-T -
$BTC
The BTC/USDT pair is trading at 85,400.01, recording a strong advance of +4.90% over the last 24 hours. The daily session shows an open at 86,620.01, a high of 87,395.67, a low of 85,300.00, and a close at 85,400.01 (-1.40% on the daily variation after testing highs), reflecting intense activity and a large volume of trading in the market.
🔍 Trend Analysis and Indicators
Trend: Dominant bullish trend in the short and medium term, characterized by a powerful dynamic impulse.
Moving Averages: The price is trading with notable room above the MA(7) (81,136.41) and the MA(25) (79,038.20), while the underlying macro trend remains solid as it stays well above the MA(99) (68,773.86).
Bollinger Bands: Price presses upward and sits above the upper band UP (85,027.88) since the middle band MB (79,334.13) (with the lower band DN (73,640.38)), indicating a significant expansion of bullish volatility.
Key Levels: Immediate support is consolidating in the 85,300 area, while the main resistance to break is located at the session high of 87,395.67.
💡 Trading Strategy: Buy or Sell?
Buy (Long)?: Trend strength and positioning above the moving averages support the continuation of the uptrend, although trading after touching the upper band requires caution via tactical pullback entries and a properly adjusted Stop Loss.
Sell (Short)?: Trading downward presents a high risk due to the current bullish trend’s strength; it would only be considered in case of a sustained loss of the key supports.
#Bitcoin #AnalisisTecnico #CryptoTrading
The Lord blesses and prospers whoever operates here, in the name of Jesus, because your word says: "Mine is the silver, and mine is the gold, says the LORD of hosts". Hageo 2:8 RV1960-T -
$BTC