



SHIB remains near a long-term base as recent trading stays compressed between established support and resistance levels.
Spot flows remain mixed, with isolated inflow spikes failing to establish sustained accumulation across major exchanges.
Price must reclaim $0.00000550 before the recovery structure can develop beyond its current consolidation range.
SHIB remains near a long-term base after an extended decline, while mixed spot flows and resistance shape the current recovery structure.
SHIB Holds Near a Long-Term Base
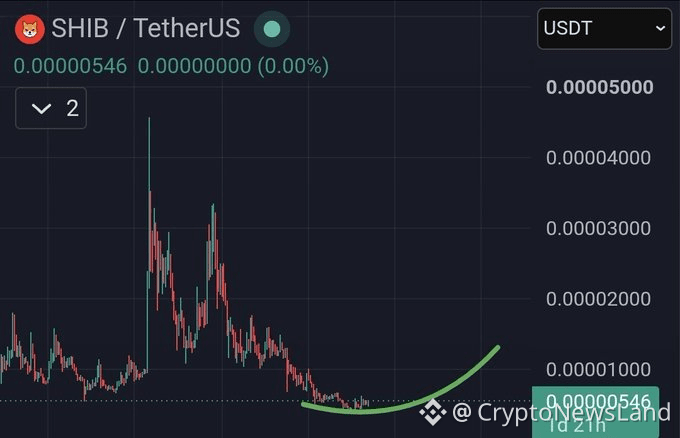
SHIB Knight's post says SHIB has not started its expected move and remains early. The view follows a chart showing price near a prolonged lower-range consolidation. However, the displayed structure has not confirmed a breakout above resistance.
 Source: X
The longer time frame indicates a clear downward trend towards $0.00000546. Prior to a lengthy corrective period, Price spiked to nearly $0.000045. Several attempts later they failed around the $0.000020 and $0.000030 areas.
The price started to fall off slowly as it neared into the $0.000005- $0.000007 range. Recent candles have become compressed around those lower levels. This suggests a shift from aggressive selling toward a more stable trading structure.
The latest market chart shows a price near $0.000005416. The token gained 0.4% over the displayed 24-hour period. Trading remained confined between approximately $0.00000535 and $0.00000550.
Spot Flows Remain Mixed Across Exchanges
The $0.00000550 level remains the nearest visible resistance. Several attempts toward that area have failed to produce sustained acceptance. Meanwhile, $0.00000535–$0.00000540 provides the immediate downside reference.
 Source: Coinglass
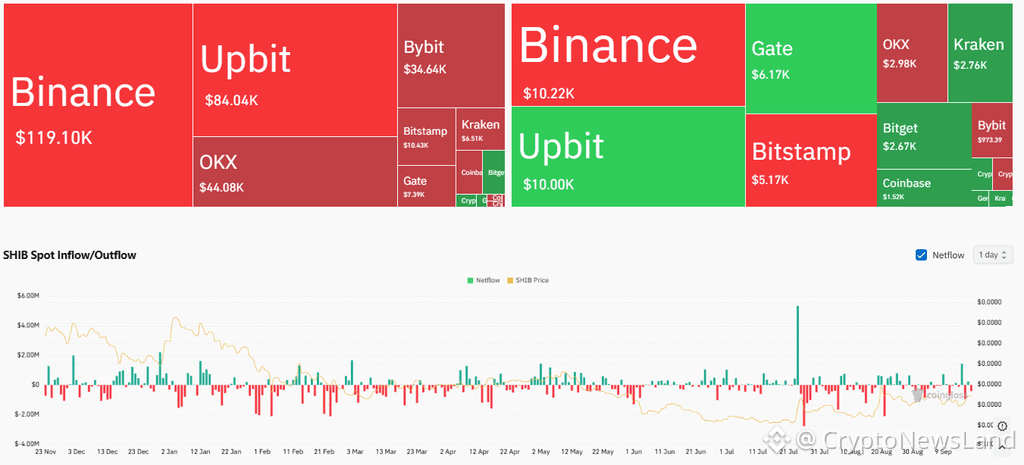
The spot-flow chart shows frequent changes between positive and negative activity. Green and red bars appeared throughout the period from November through September. Neither direction maintained a consistent pattern across the entire timeframe.
Several positive spikes appeared during December and January. However, the price line continued weakening after those periods. This shows that isolated inflows did not produce a sustained upward price structure.
The largest visible inflow arrived around late July. That green spike exceeded $5 million and stood above most surrounding readings. That rally had little effect on the overall price trend following it.
Resistance Defines the Next Technical Phase
Exchange activity also remains divided across major venues. Binance recorded about $119.10K, while Upbit showed roughly $84.04K. OKX and Bybit followed with approximately $44.08K and $34.64K.
The short-term structure continues showing repeated recovery attempts near $0.00000550. A sustained break above that level would change the immediate range structure. Until then, price remains within a clearly defined consolidation zone.
The longer-term chart shows a potential path of rising to $0.000010 and $0.000013. Actual price action confirms, but does not prove, the projected path. Thus, those levels are only reference points, and not set targets.
There are also higher time frame resistances at $0.000020 and $0.000030. Previous rallies encountered selling pressure around both areas. Any broader recovery would therefore face several resistance zones along the way.