$BTC Crypto Circle Academician: 9.22 Bitcoin (BTC) chart breaks to new highs in a row—what is the core difference between trend continuation and top signals? Latest market analysis and trading suggestions
Bitcoin’s current price is 86,000. The market keeps making new highs, but risks are accumulating at the same time. When the market is rising one-way, everyone feels it will keep going up—but reversals on the chart often happen in the blink of an eye. Technical analysis can only serve as a probabilistic reference, not a 100% accurate signal. Whether you’re bullish or bearish, you must think about your stop-loss in advance—especially for fellow coin friends heading north with me, please steady your positions.
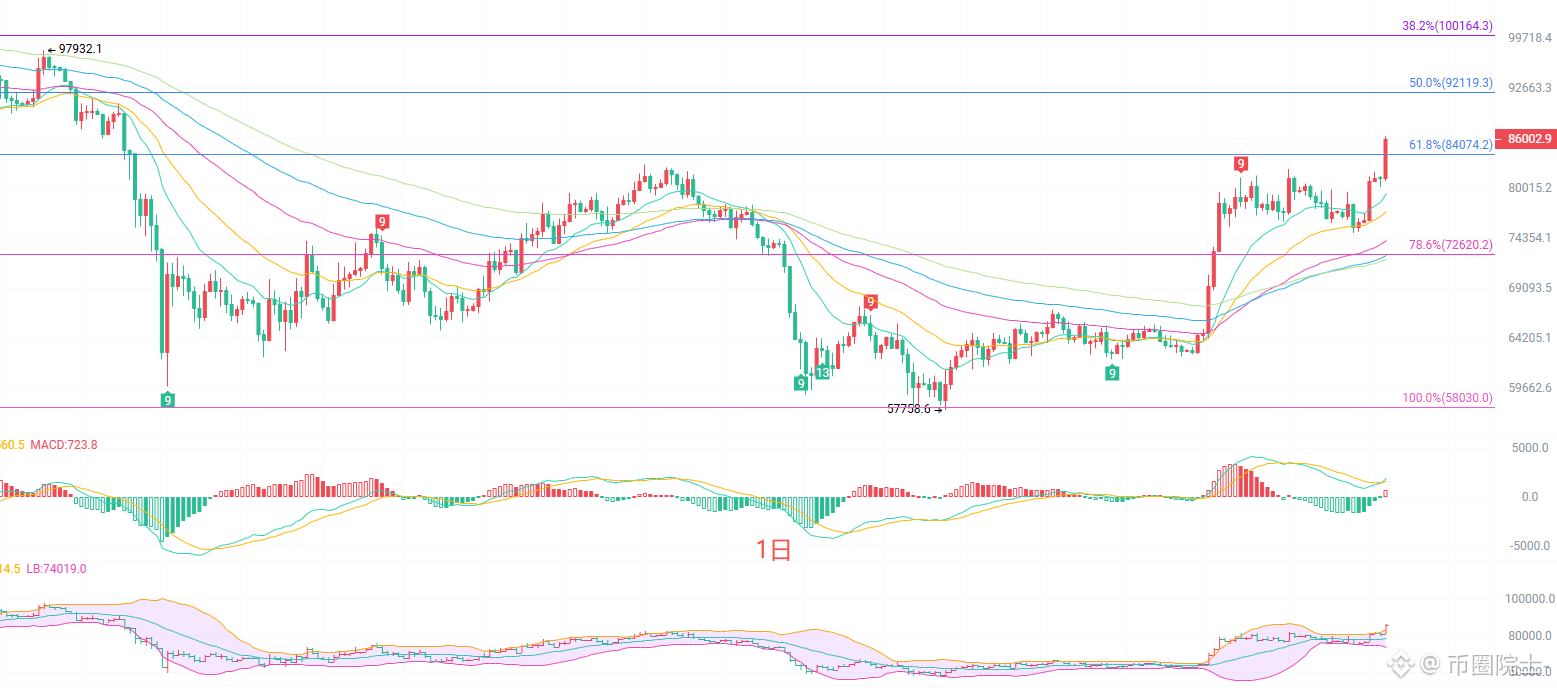
The daily K-line is steadily moving upward along the EMA bull lines. The moving-average system shows a bullish alignment. The 15, 30, and 60 period EMAs are layering up and providing strong support. The MACD indicator’s DIF is running above DEA, and the red histogram remains in an expanding-volume state. The Bollinger Bands’ upper rail keeps opening upward; the channel is expanding, indicating that the daily-level large bullish trend has not ended. However, the current price has already moved above the Bollinger upper rail, which puts it in an overbought zone. After a sustained surge, a technical pullback/repair can occur at any time. Don’t chase longs endlessly; focus on whether the moving-average support is effectively held during the pullback.
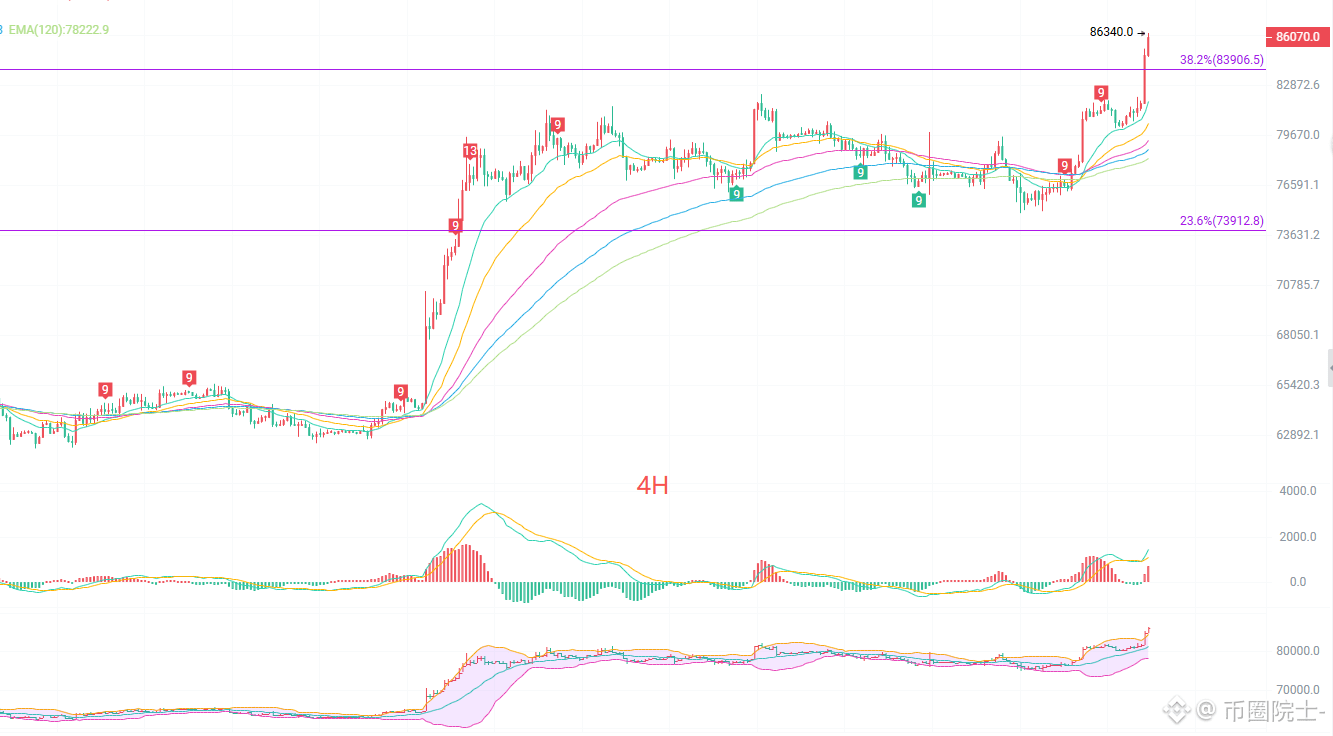
On the 4-hour K-line, price continues to rise along the EMA15 and EMA30 lines. The moving averages remain in a bullish order, and pullbacks have not effectively broken below the short-term moving averages. MACD stays in red-histogram territory, and bullish momentum is still present, but compared with the previous peak, the red histogram shows some weakening. The bullish force has become slightly dull. The Bollinger Bands open upward; price is hugging the upper rail, and the range of fluctuation keeps expanding. The 4-hour timeframe has been closing positive candles consecutively, and short-term overbought conditions are obvious. In the near term, a correction and buildup of energy may happen at any time. Don’t chase the highs for short-term trades; wait and observe after the pullback hits key support.
Short-term reference
For the downside, if you head north into 83,000 to 82,000, set a stop-loss of 500 points. Targets: watch for 81,800 break, then look for 82,200.
If the previous high at 86,200 can’t hold and price fails to stay above it, you can head south. Set a stop-loss of 500 points. For short-term execution, move fast and exit quickly.
Specific actions should mainly follow real-time order-book data. For more information, you can consult the author. This article may be delayed; the suggestions are for reference only—risk is your own responsibility.
#BTC走势分析
Bitcoin’s current price is 86,000. The market keeps making new highs, but risks are accumulating at the same time. When the market is rising one-way, everyone feels it will keep going up—but reversals on the chart often happen in the blink of an eye. Technical analysis can only serve as a probabilistic reference, not a 100% accurate signal. Whether you’re bullish or bearish, you must think about your stop-loss in advance—especially for fellow coin friends heading north with me, please steady your positions.
The daily K-line is steadily moving upward along the EMA bull lines. The moving-average system shows a bullish alignment. The 15, 30, and 60 period EMAs are layering up and providing strong support. The MACD indicator’s DIF is running above DEA, and the red histogram remains in an expanding-volume state. The Bollinger Bands’ upper rail keeps opening upward; the channel is expanding, indicating that the daily-level large bullish trend has not ended. However, the current price has already moved above the Bollinger upper rail, which puts it in an overbought zone. After a sustained surge, a technical pullback/repair can occur at any time. Don’t chase longs endlessly; focus on whether the moving-average support is effectively held during the pullback.
On the 4-hour K-line, price continues to rise along the EMA15 and EMA30 lines. The moving averages remain in a bullish order, and pullbacks have not effectively broken below the short-term moving averages. MACD stays in red-histogram territory, and bullish momentum is still present, but compared with the previous peak, the red histogram shows some weakening. The bullish force has become slightly dull. The Bollinger Bands open upward; price is hugging the upper rail, and the range of fluctuation keeps expanding. The 4-hour timeframe has been closing positive candles consecutively, and short-term overbought conditions are obvious. In the near term, a correction and buildup of energy may happen at any time. Don’t chase the highs for short-term trades; wait and observe after the pullback hits key support.
Short-term reference
For the downside, if you head north into 83,000 to 82,000, set a stop-loss of 500 points. Targets: watch for 81,800 break, then look for 82,200.
If the previous high at 86,200 can’t hold and price fails to stay above it, you can head south. Set a stop-loss of 500 points. For short-term execution, move fast and exit quickly.
Specific actions should mainly follow real-time order-book data. For more information, you can consult the author. This article may be delayed; the suggestions are for reference only—risk is your own responsibility.
#BTC走势分析