📊 MONITORING — BUYER SCENARIO | LPT/USDT 30m
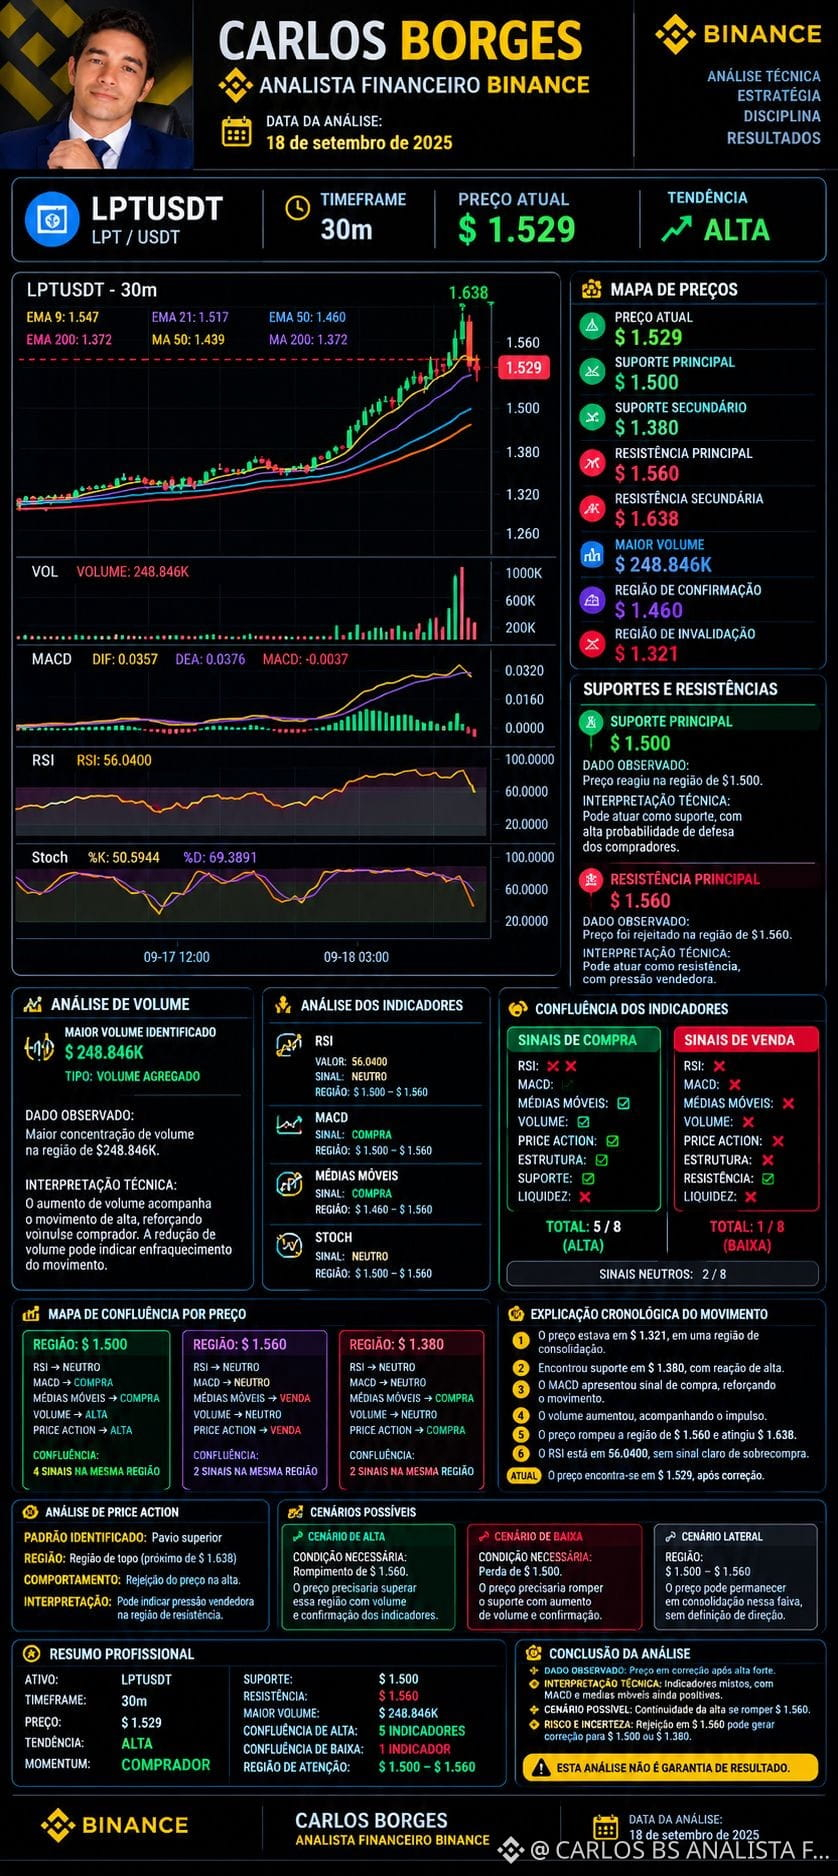
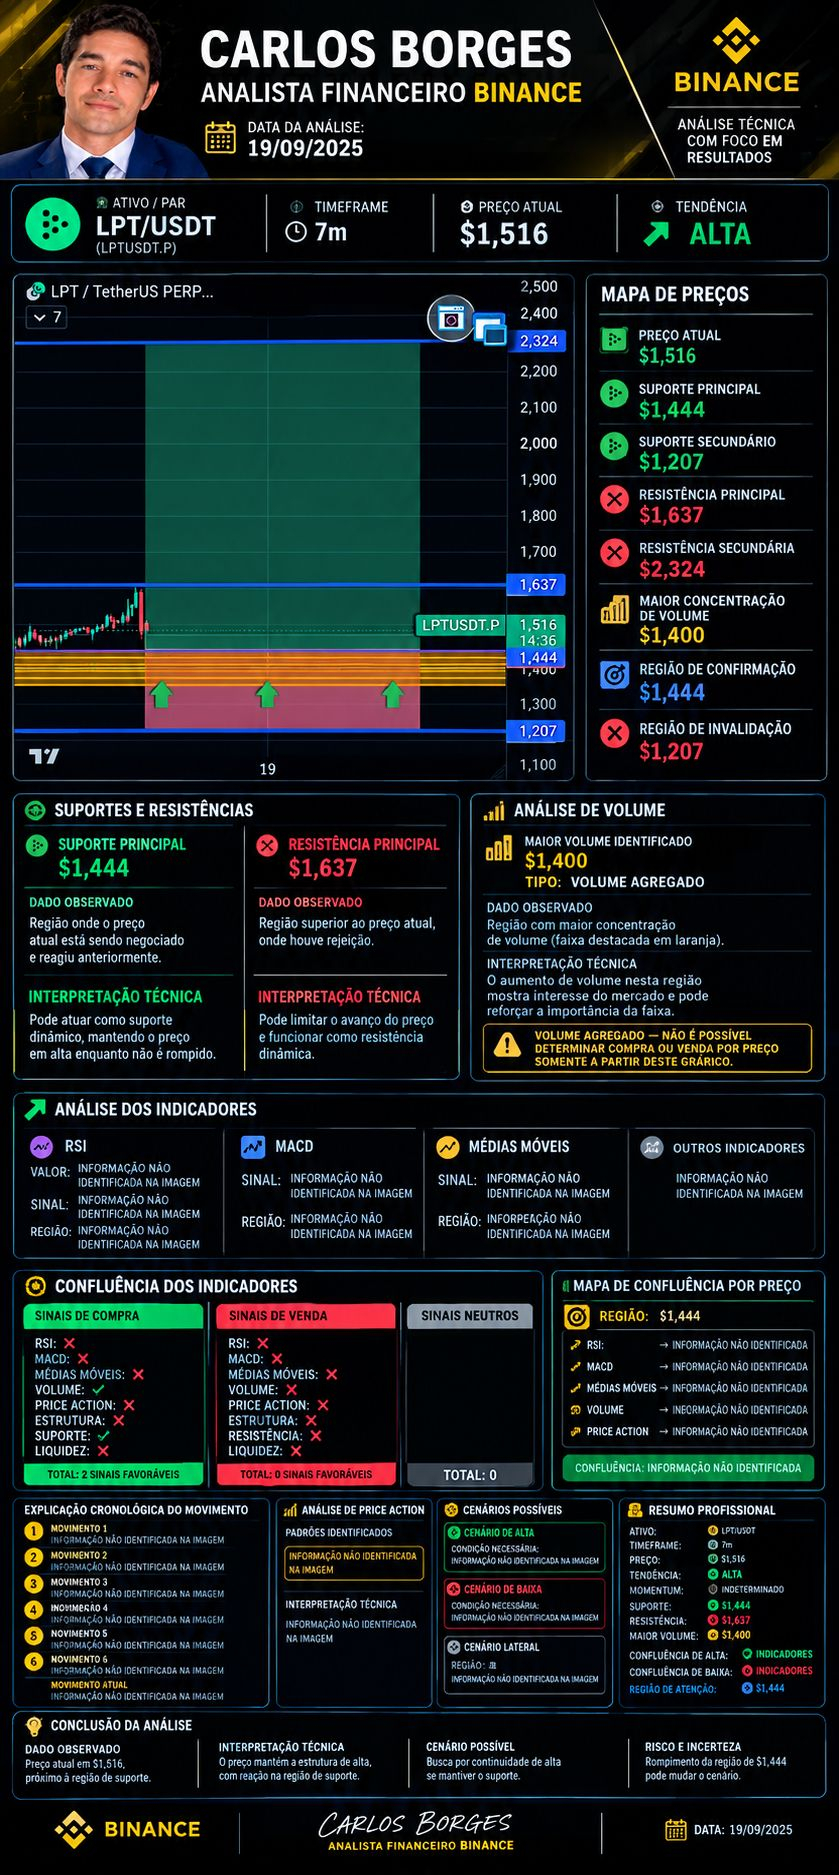
LPT/USDT shows a bullish structure on the 30-minute chart, with the current price identified as US$ 1,529. Monitoring remains focused on buyer continuation, but with attention to the correction observed after the high of US$ 1,638.
📌 OBSERVED DATA
💰 Current price: US$ 1,529
🟢 Immediate support: US$ 1,500
🔴 Resistance: US$ 1,560
🔝 Visible high: US$ 1,638
📊 Volume: 248,846K
RSI: 56,0400
MACD: -0,0037
EMA 9: 1,547
EMA 21: 1,517
EMA 50: 1,460
EMA 200: 1,372
📊 TECHNICAL INTERPRETATION
The previous move showed strong price expansion accompanied by a significant increase in volume. After reaching US$ 1,638, there was rejection and a pullback toward the US$ 1,529 region.
For the bullish scenario to gain confirmation, monitoring should primarily watch whether price can hold above US$ 1,500 and recover US$ 1,560 with consistent behavior.
The RSI at 56,04 remains above the central range, while the MACD shown in the image indicates a recent loss of momentum. Therefore, there is partial confluence, not absolute confirmation of continuation.
🎯 MONITORING LEVELS
🟢 US$ 1,500 → holding this region favors observing buyer defense.
🔴 US$ 1,560 → important region to watch for a possible recovery of bullish strength.
🔝 US$ 1,638 → most recent visible high; if price approaches this level, monitoring the price reaction and volume becomes necessary.
LPT/USDT shows a bullish structure on the 30-minute chart, with the current price identified as US$ 1,529. Monitoring remains focused on buyer continuation, but with attention to the correction observed after the high of US$ 1,638.
📌 OBSERVED DATA
💰 Current price: US$ 1,529
🟢 Immediate support: US$ 1,500
🔴 Resistance: US$ 1,560
🔝 Visible high: US$ 1,638
📊 Volume: 248,846K
RSI: 56,0400
MACD: -0,0037
EMA 9: 1,547
EMA 21: 1,517
EMA 50: 1,460
EMA 200: 1,372
📊 TECHNICAL INTERPRETATION
The previous move showed strong price expansion accompanied by a significant increase in volume. After reaching US$ 1,638, there was rejection and a pullback toward the US$ 1,529 region.
For the bullish scenario to gain confirmation, monitoring should primarily watch whether price can hold above US$ 1,500 and recover US$ 1,560 with consistent behavior.
The RSI at 56,04 remains above the central range, while the MACD shown in the image indicates a recent loss of momentum. Therefore, there is partial confluence, not absolute confirmation of continuation.
🎯 MONITORING LEVELS
🟢 US$ 1,500 → holding this region favors observing buyer defense.
🔴 US$ 1,560 → important region to watch for a possible recovery of bullish strength.
🔝 US$ 1,638 → most recent visible high; if price approaches this level, monitoring the price reaction and volume becomes necessary.