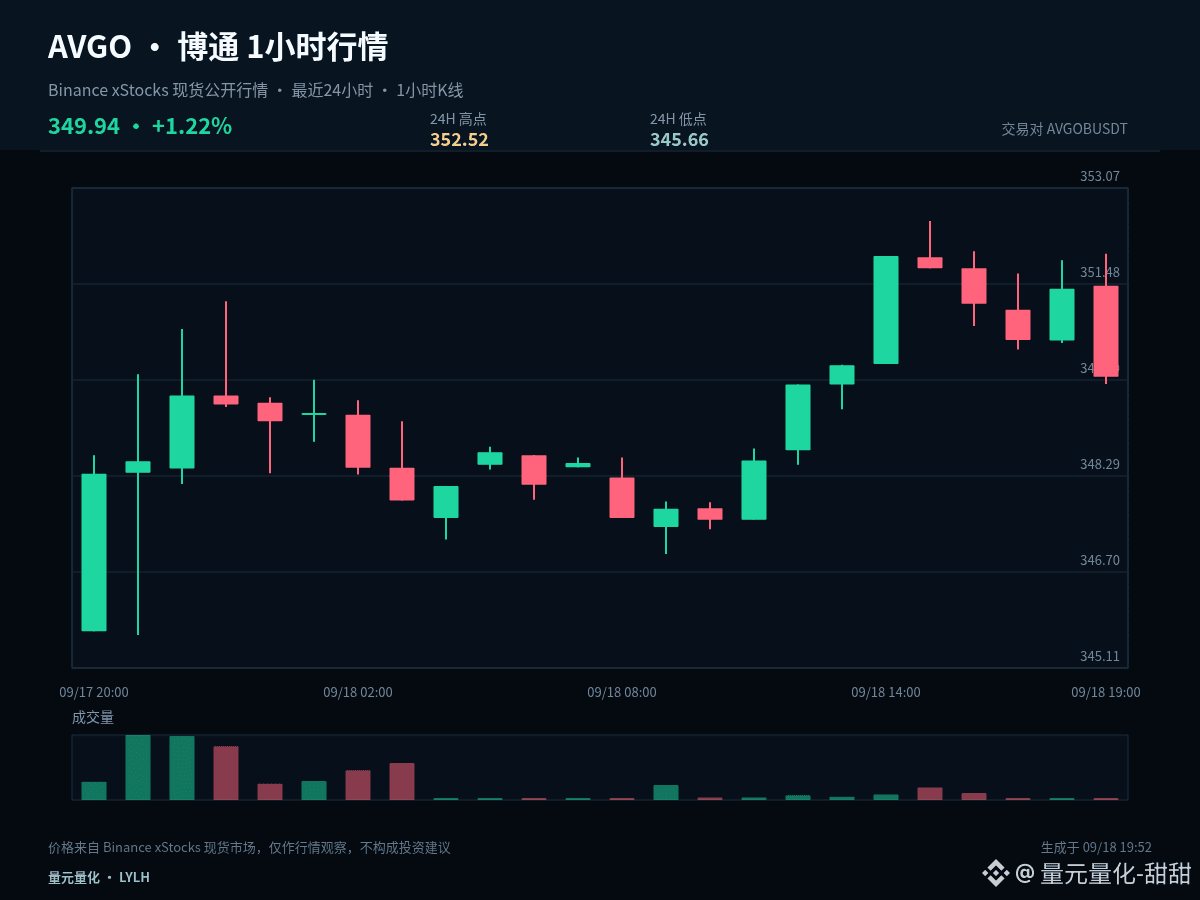
$AVGOB #AVGO This time, we break down the move from a position perspective. The same chart highlights different key points depending on whether you already hold a position or are currently flat. Current price: 349.94; 1 hour: -0.42%, 24 hours: +1.44%.
At present, the 1-hour (-0.42%) and 24-hour (+1.44%) cycles have not formed a sufficiently clear alignment in the same direction. In a range-bound market, the tolerance for chase-and-fail is low. It’s more suitable to confirm the direction with the upper boundary, confirm the hold/support with the lower boundary; the midline is only a line that separates strength and weakness.
For those who already have positions: watch whether 345.66 breaks and gets lost. If it does, reduce risk exposure first. For those who are flat: wait for the low to stop making lower lows, and confirm that price has reclaimed 349.09. Don’t catch the falling structure too early.
There are three ways the next path could be handled. If price effectively holds and stands above 352.52, wait for the pullback to not break before reassessing for continuation. If price breaks down below 345.66, prioritize controlling risk and wait for new support. If price continues to trade around 349.09 in a range, treat it as range rotation and don’t repeatedly chase direction in the middle zone.
Those already in positions can manage decisions in stages based on key levels, avoiding making all judgments at once. Flat traders should wait for breakout confirmation or pullback stabilization. For US stocks, also watch for volatility caused by trading session transitions. Your plan should be based on price conditions—don’t let emotion replace execution.
For short-term positions, the focus is not to predict every single candlestick. It’s to ensure there is a basis for entries, reducing exposure, and exits. Do less until confirmed; when a key level fails, redo the plan. First control per-trade risk, then discuss the upside/downside room ahead.
#InjectiveLaunchesINJOnSolana
At present, the 1-hour (-0.42%) and 24-hour (+1.44%) cycles have not formed a sufficiently clear alignment in the same direction. In a range-bound market, the tolerance for chase-and-fail is low. It’s more suitable to confirm the direction with the upper boundary, confirm the hold/support with the lower boundary; the midline is only a line that separates strength and weakness.
For those who already have positions: watch whether 345.66 breaks and gets lost. If it does, reduce risk exposure first. For those who are flat: wait for the low to stop making lower lows, and confirm that price has reclaimed 349.09. Don’t catch the falling structure too early.
There are three ways the next path could be handled. If price effectively holds and stands above 352.52, wait for the pullback to not break before reassessing for continuation. If price breaks down below 345.66, prioritize controlling risk and wait for new support. If price continues to trade around 349.09 in a range, treat it as range rotation and don’t repeatedly chase direction in the middle zone.
Those already in positions can manage decisions in stages based on key levels, avoiding making all judgments at once. Flat traders should wait for breakout confirmation or pullback stabilization. For US stocks, also watch for volatility caused by trading session transitions. Your plan should be based on price conditions—don’t let emotion replace execution.
For short-term positions, the focus is not to predict every single candlestick. It’s to ensure there is a basis for entries, reducing exposure, and exits. Do less until confirmed; when a key level fails, redo the plan. First control per-trade risk, then discuss the upside/downside room ahead.
#InjectiveLaunchesINJOnSolana