$ONE #one
🔥 +130% rise in $ONE .. Are you jumping in now or waiting? A real lesson from the heart of the market!
I know this feeling well; when you see a huge green candle rising on your screen and a +130% percentage sparkling in front of you, the biggest driver behind all losses whispers in your ear: FOMO (Fear of Missing Out).
As a trader who spent years among charts and market fluctuations, I’ll tell you advice worth its weight in gold: "The candle that burns your eyes with its beautiful green may burn your portfolio if you enter it emotionally!"
📊 Quick technical analysis for $ONE (1-hour timeframe):
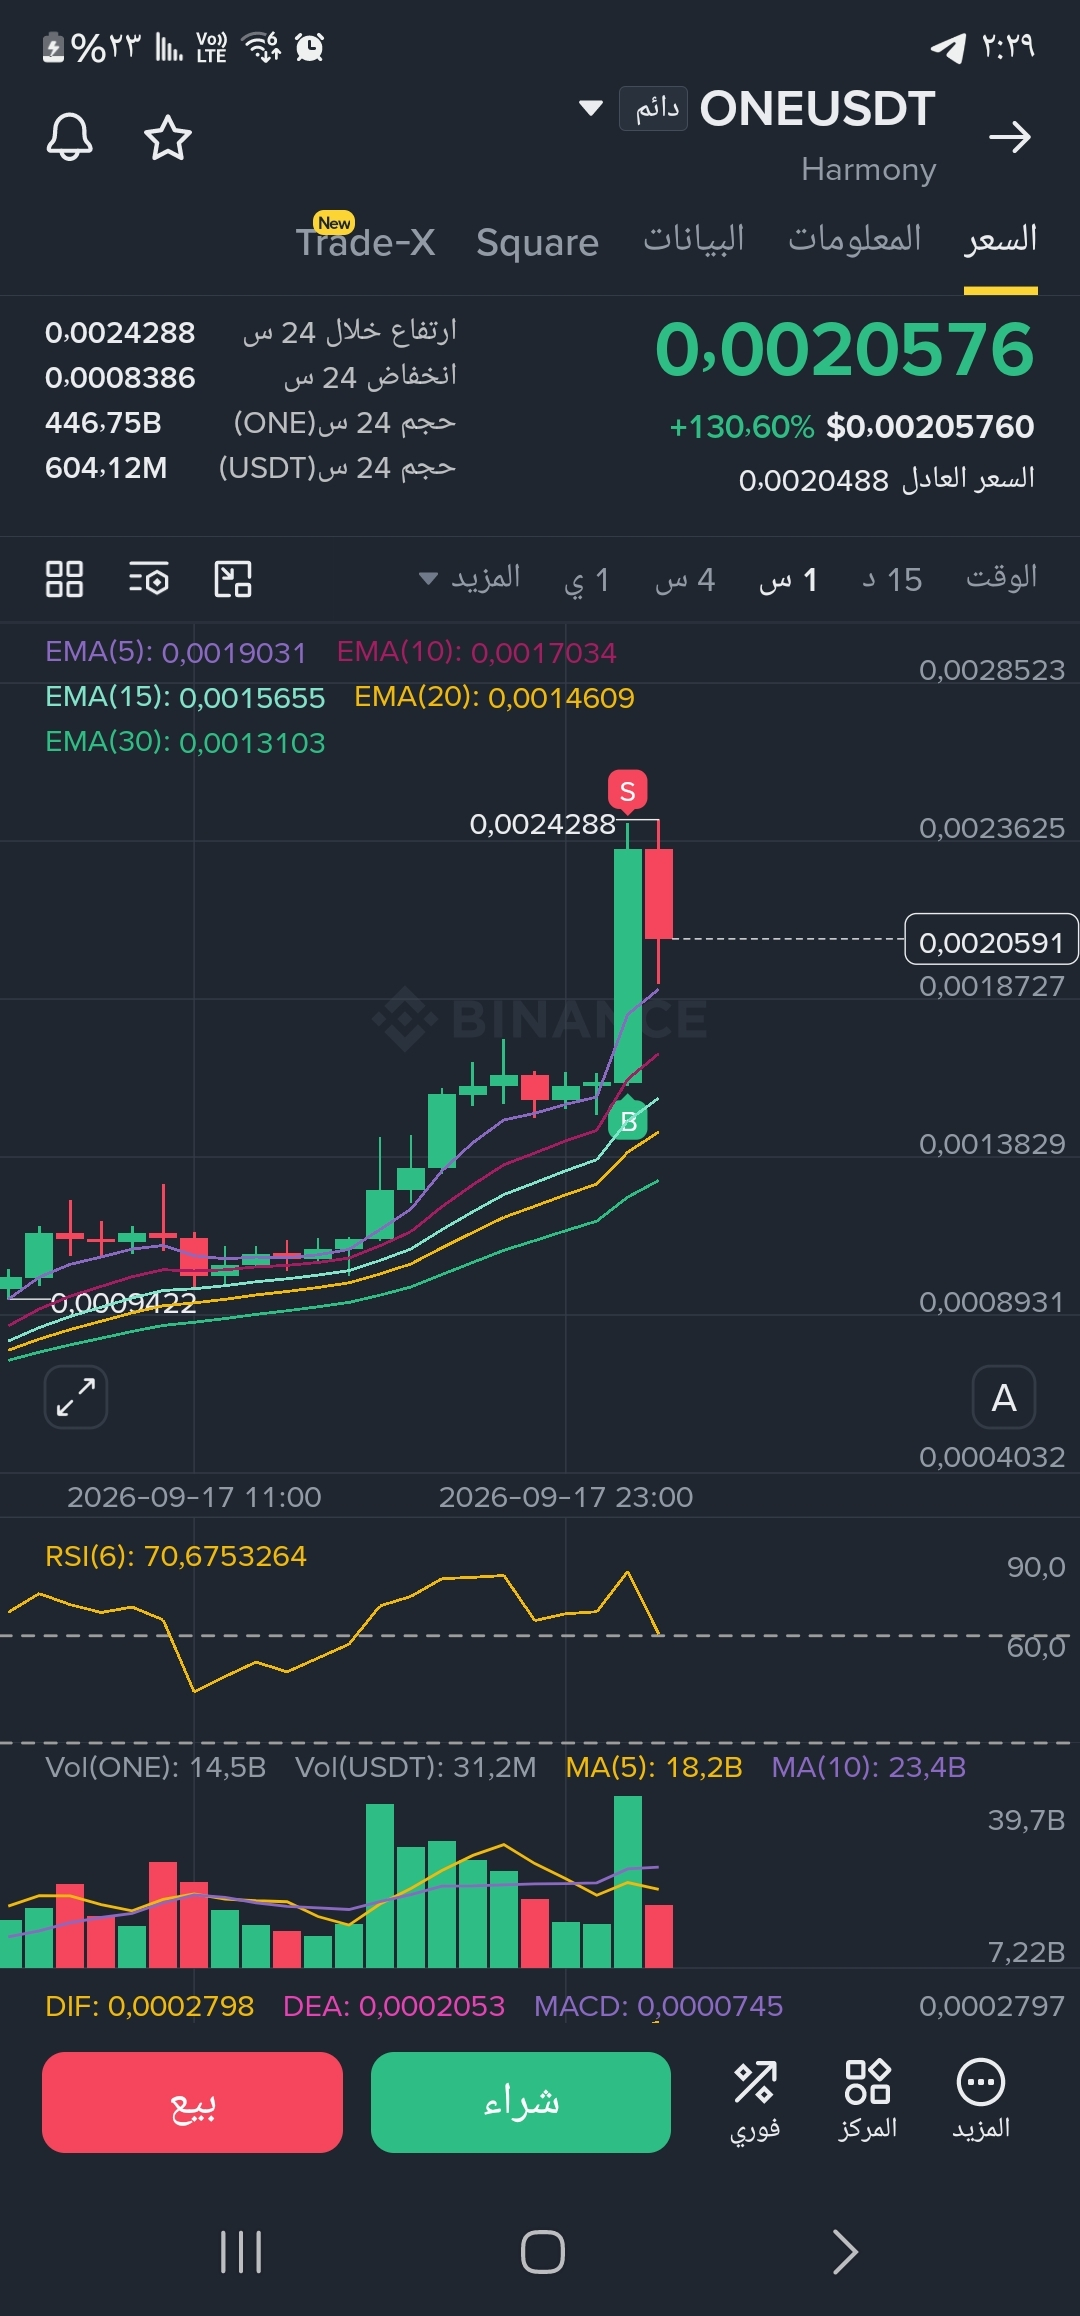
* Price action: Explosive upward move lifted the coin from the bottom to a peak at 0.002428, followed by a corrective candle and profit-taking that pushes the price down now toward the 0.00205 zones.
* Relative Strength Index (RSI): It entered extremely high overbought territory (above 80) and is now beginning to bend downward to cool the indicator—this is normal and healthy for any sustainable uptrend.
* Moving Averages (EMA): The price is far from its moving averages, with the EMA(5) average at 0.00190 and the EMA(10) average at 0.00170—these are the first key dynamic support areas you should watch for the price’s behavior.
🎯 Critical levels to watch:
* Main resistance: 0.00242 (breaking it requires massive liquidity and staying above it).
* Support and retest zones: 0.00190, then 0.00170.
🔥 +130% rise in $ONE .. Are you jumping in now or waiting? A real lesson from the heart of the market!
I know this feeling well; when you see a huge green candle rising on your screen and a +130% percentage sparkling in front of you, the biggest driver behind all losses whispers in your ear: FOMO (Fear of Missing Out).
As a trader who spent years among charts and market fluctuations, I’ll tell you advice worth its weight in gold: "The candle that burns your eyes with its beautiful green may burn your portfolio if you enter it emotionally!"
📊 Quick technical analysis for $ONE (1-hour timeframe):
* Price action: Explosive upward move lifted the coin from the bottom to a peak at 0.002428, followed by a corrective candle and profit-taking that pushes the price down now toward the 0.00205 zones.
* Relative Strength Index (RSI): It entered extremely high overbought territory (above 80) and is now beginning to bend downward to cool the indicator—this is normal and healthy for any sustainable uptrend.
* Moving Averages (EMA): The price is far from its moving averages, with the EMA(5) average at 0.00190 and the EMA(10) average at 0.00170—these are the first key dynamic support areas you should watch for the price’s behavior.
🎯 Critical levels to watch:
* Main resistance: 0.00242 (breaking it requires massive liquidity and staying above it).
* Support and retest zones: 0.00190, then 0.00170.