$ETH ETH in the coin circle: 9/17 pullback is not the end—can key support determine the direction of the next move? Latest market analysis reference
At the current price of 2425 for Ethereum, judging from the current chart, after a push higher by the bulls, concentrated profit-taking has surged and led to a rapid pullback. The market’s long/short battle has become extremely intense. The larger-term trend has not completely reversed, but short-term bearish strength has already taken the upper hand. Never blindly go heavy based on instinct. Every trade must have risk control. Don’t “doom-talk” like the market—rather, find your position at support in the lower range and go north to do what needs to be done in this move: small stop-loss, large room.
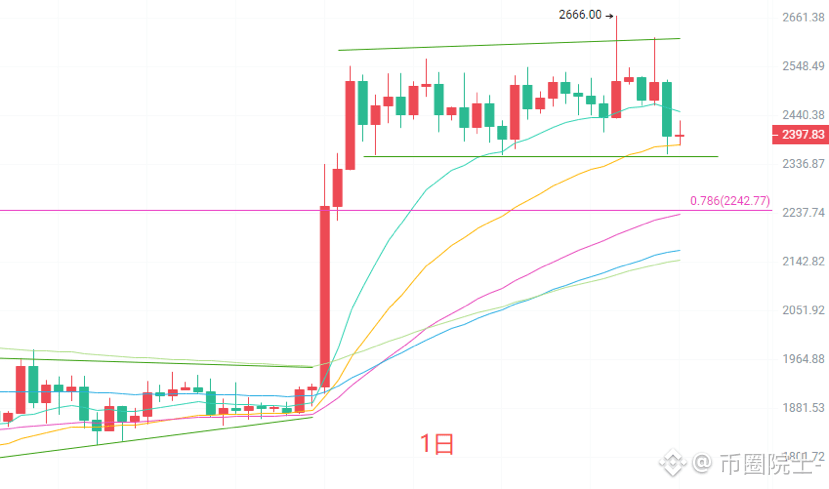
The daily K-line surged and then fell back; it closed as a bearish pullback candle. Price broke below the short-term EMA15. The MACD red histogram continues to shrink, indicating weakening bullish momentum. The Bollinger Bands show price starting to move toward the lower band. The Fibonacci 0.786 level at 2242 is the key support below. Overall, the big-picture trend still maintains a bullish structure, but in the short term it has entered a correction phase. Resistance overhead is at 2447. If price cannot reclaim and stand above it, the pullback is likely to continue. If 2242 support holds, there is still a chance for another rebound.
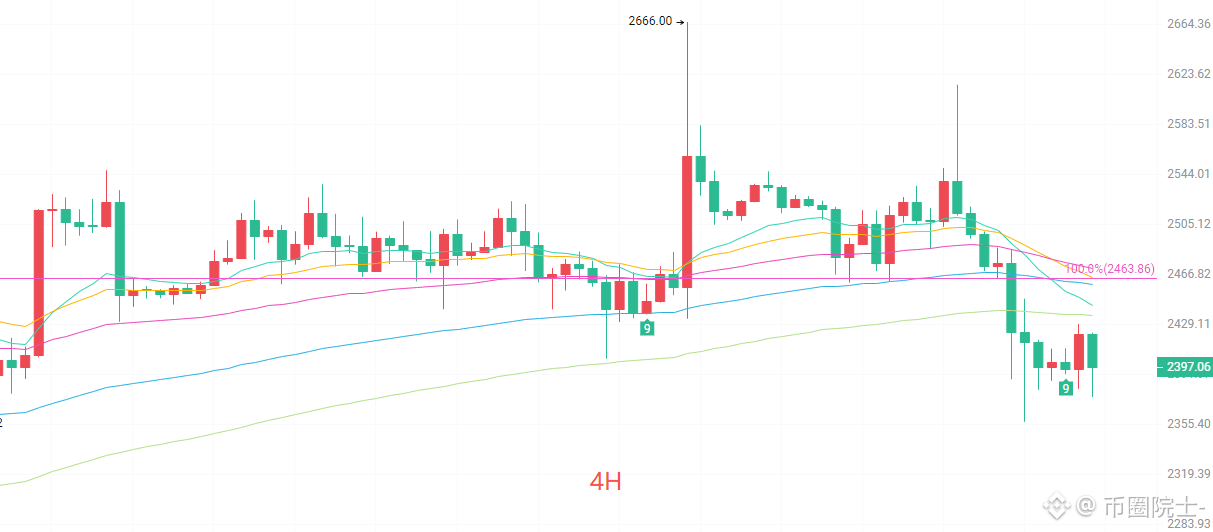
On the four-hour chart, the price has been declining continuously from the 2666 high and has already broken below the EMA15 and EMA30 short-term moving averages. The moving averages have shifted from support to resistance. MACD is turning down after heading off from above the zero line, while the green histogram continues to expand—bearish power is being released. The Bollinger Bands open downward, and price is trading near the lower band. The Fibonacci 78.6% level at 2258 is an important near-term defense zone. In the short term, this is a weak correction; any rebound is likely to be a corrective (repair) rebound. The strong resistance at 2463 is where rebounds may easily meet renewed rejection and fall again.
Short-term references:
If the market breaks north above 2360 to 2320, stop-loss 40 points; targets are 2400 to 2430.
If the market fails to break 2440 to 2480 and instead moves south, stop-loss 40 points; targets are 2400 to 2370.
Specific execution should be based on real-time order book data. For more information, you can consult the article author; note that article publication is delayed. This is for reference only—risk is your own.
#ETH走势分析
At the current price of 2425 for Ethereum, judging from the current chart, after a push higher by the bulls, concentrated profit-taking has surged and led to a rapid pullback. The market’s long/short battle has become extremely intense. The larger-term trend has not completely reversed, but short-term bearish strength has already taken the upper hand. Never blindly go heavy based on instinct. Every trade must have risk control. Don’t “doom-talk” like the market—rather, find your position at support in the lower range and go north to do what needs to be done in this move: small stop-loss, large room.
The daily K-line surged and then fell back; it closed as a bearish pullback candle. Price broke below the short-term EMA15. The MACD red histogram continues to shrink, indicating weakening bullish momentum. The Bollinger Bands show price starting to move toward the lower band. The Fibonacci 0.786 level at 2242 is the key support below. Overall, the big-picture trend still maintains a bullish structure, but in the short term it has entered a correction phase. Resistance overhead is at 2447. If price cannot reclaim and stand above it, the pullback is likely to continue. If 2242 support holds, there is still a chance for another rebound.
On the four-hour chart, the price has been declining continuously from the 2666 high and has already broken below the EMA15 and EMA30 short-term moving averages. The moving averages have shifted from support to resistance. MACD is turning down after heading off from above the zero line, while the green histogram continues to expand—bearish power is being released. The Bollinger Bands open downward, and price is trading near the lower band. The Fibonacci 78.6% level at 2258 is an important near-term defense zone. In the short term, this is a weak correction; any rebound is likely to be a corrective (repair) rebound. The strong resistance at 2463 is where rebounds may easily meet renewed rejection and fall again.
Short-term references:
If the market breaks north above 2360 to 2320, stop-loss 40 points; targets are 2400 to 2430.
If the market fails to break 2440 to 2480 and instead moves south, stop-loss 40 points; targets are 2400 to 2370.
Specific execution should be based on real-time order book data. For more information, you can consult the article author; note that article publication is delayed. This is for reference only—risk is your own.
#ETH走势分析