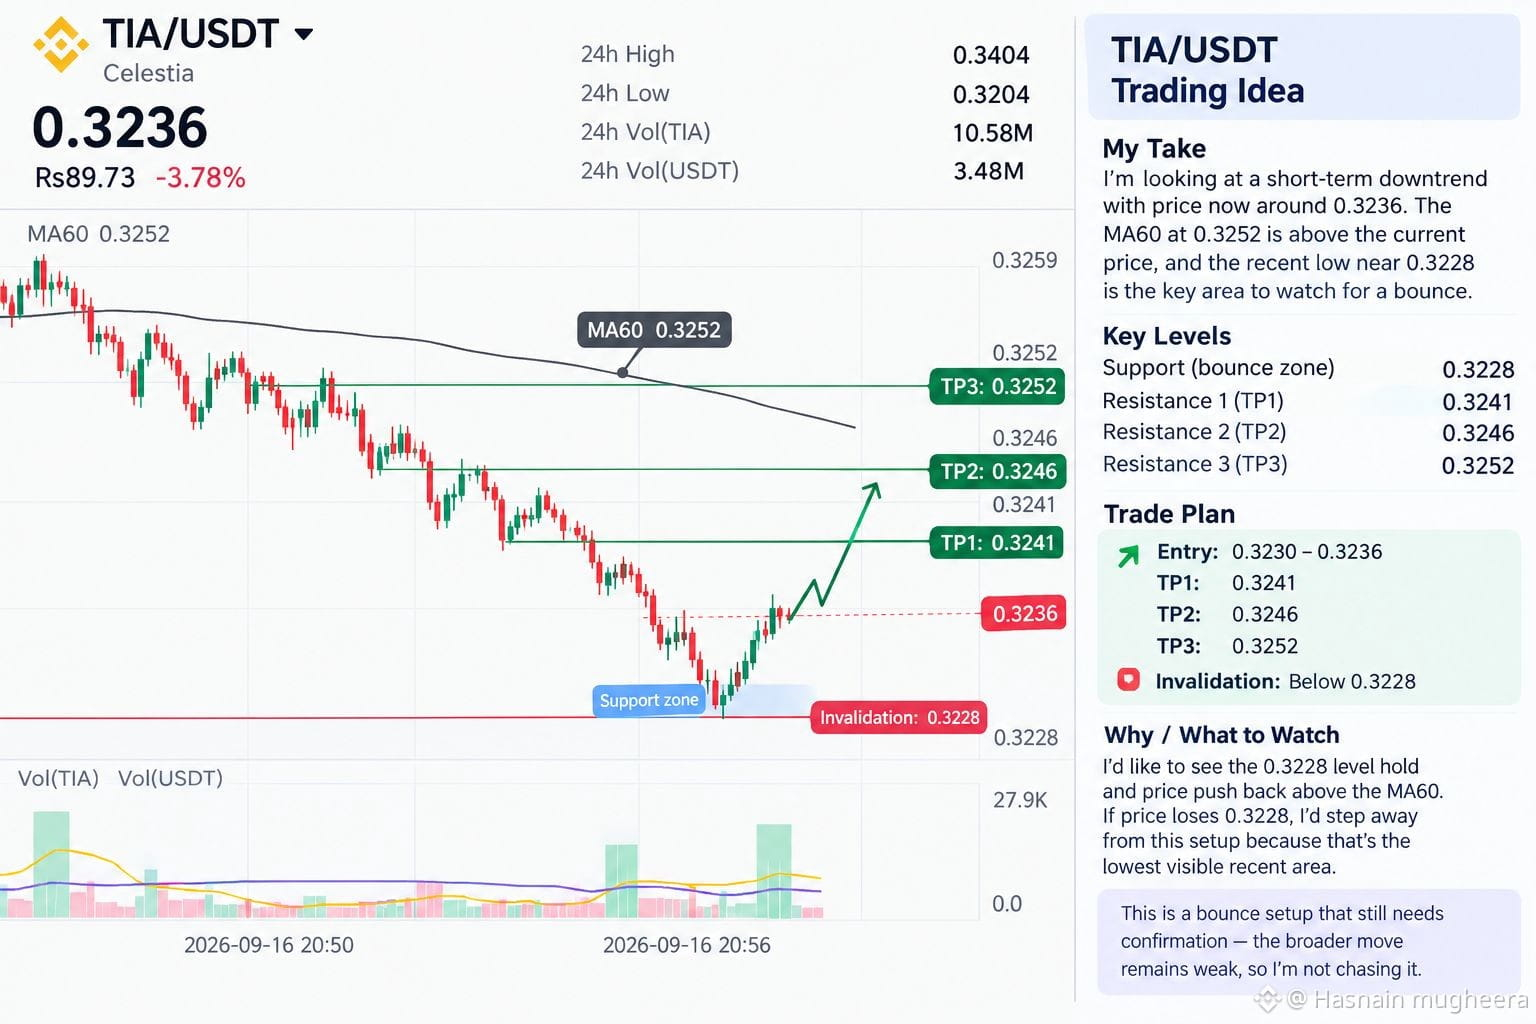
I’m looking at $TIA /USDT around 0.3236, and the short-term structure on this chart is clearly moving lower. Price has been making lower steps, while the visible MA60 at 0.3252 is sitting above current price.
The interesting part for me is the small bounce from the visible 0.3228 area. I’d want that level to hold before considering any upside continuation. The nearby 0.3241 and 0.3246 levels are the first areas I’d watch, with 0.3252 also important because it matches the visible MA60.
📍 Entry: 0.3230–0.3236
🎯 TP1: 0.3241
🎯 TP2: 0.3246
🎯 TP3: 0.3252
🛑 Invalidation: Below 0.3228
If price loses 0.3228, I’d step away from this setup because that’s the lowest clearly visible recent area on the chart. I’d also be cautious if price keeps failing underneath the MA60 rather than reclaiming it.
For me, this is a bounce setup that still needs confirmation—the broader visible move remains weak, so I’d rather see support hold than chase the first upward reaction.
The interesting part for me is the small bounce from the visible 0.3228 area. I’d want that level to hold before considering any upside continuation. The nearby 0.3241 and 0.3246 levels are the first areas I’d watch, with 0.3252 also important because it matches the visible MA60.
📍 Entry: 0.3230–0.3236
🎯 TP1: 0.3241
🎯 TP2: 0.3246
🎯 TP3: 0.3252
🛑 Invalidation: Below 0.3228
If price loses 0.3228, I’d step away from this setup because that’s the lowest clearly visible recent area on the chart. I’d also be cautious if price keeps failing underneath the MA60 rather than reclaiming it.
For me, this is a bounce setup that still needs confirmation—the broader visible move remains weak, so I’d rather see support hold than chase the first upward reaction.