
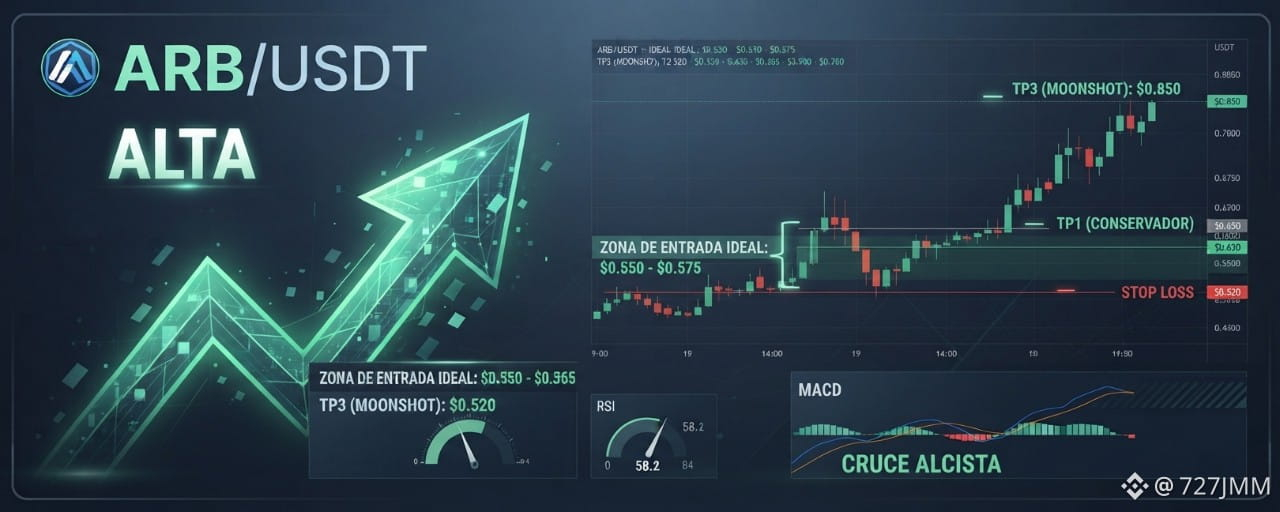


(ARB/USDT). The market shows a strong accumulation pattern with high institutional liquidity on-chain.
Trading Levels
Ideal Entry Zone: $0.550 - $0.575
Impulse Zone: $0.580 - $0.610
Tp1 (Conservative): $0.650 (Initial target to secure profits)
Tp2 (Intermediate): $0.720 (Target based on the following key resistance)
Tp3 (Moonshot): $0.850 (Extended target if the trend persists)
Stop Loss: $0.520 (Strict capital protection)
Technical Indicator Analysis
RSI (Relative Strength Index): It is at 58.2. It measures the speed and magnitude of recent changes; being above the midline (50) and far from the overbought zone (>70) indicates buyer dominance with enough room for growth before a possible correction or pullback in the short term.
Moving Averages: The moving average system with EMA (9, 21, 200) and MA (50, 100) determines the main upward trend. The fast lines show bullish alignment, while the 200 EMA acts as a structural dynamic support.
MACD (Moving Average Convergence/Divergence): Connects the EMA of 12 and 26 periods. It currently shows a clear bullish crossover, where the main line is above the signal line and the histogram turns positive with expanding bars, reflecting strong active buying momentum.