
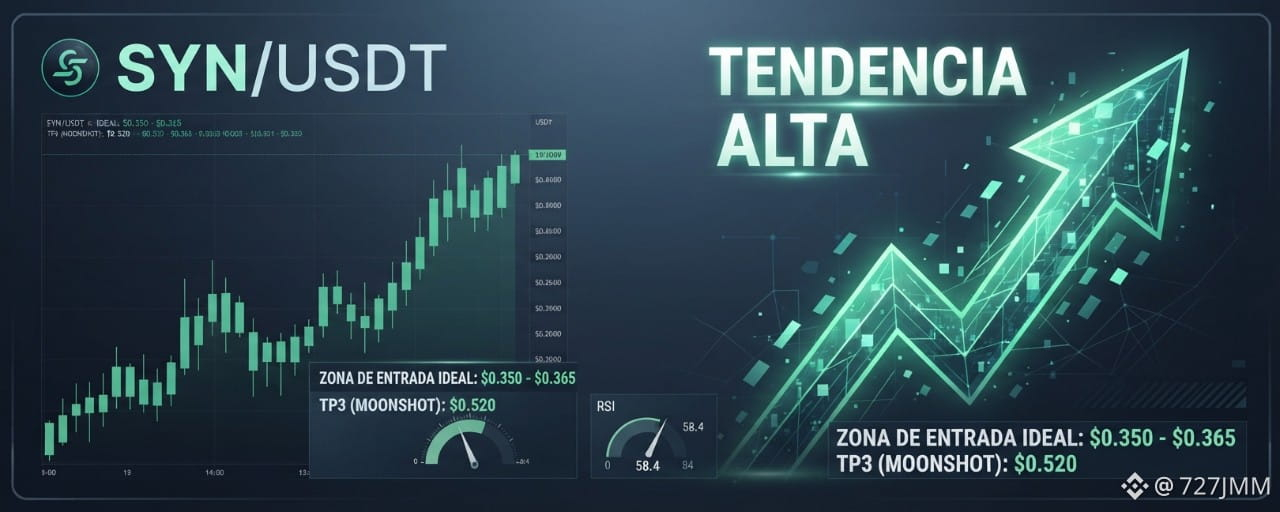


SYN/USDT. The market shows an institutional accumulation structure with rising volume. Greater Winner
Strategic Trading Levels
Ideal entry zone: $0.350 - $0.365
Momentum zone: $0.370 - $0.385
TP1 (Conservative): $0.410 (Ensure initial profits)
TP2 (Intermediate): $0.455 (Key channel resistance)
TP3 (Moonshot): $0.520 (Extended bullish projection)
Stop Loss: $0.328 (Strict risk management)
Technical Indicators Analysis
RSI (Relative Strength Index): Located at 58.4, it remains in a neutral-bullish reading with ample room before reaching overbought levels (>70), indicating that the price has fuel to continue the upward move without imminent exhaustion signals.
EMAs and MAs (Exponential and Moving Averages): The 9- and 21-period EMAs maintain a bullish alignment above the 50- and 100-period MAs, confirming the main trend in the short and medium term. The 200 EMA acts as a solid lower dynamic support.
MACD (Moving Average Convergence/Divergence): It shows a clear bullish crossover where the main line moves above the signal line. The histogram displays green bars with steady expansion, indicating strengthening buying momentum in the current market.