Trading Thesis | 9/16 16:21
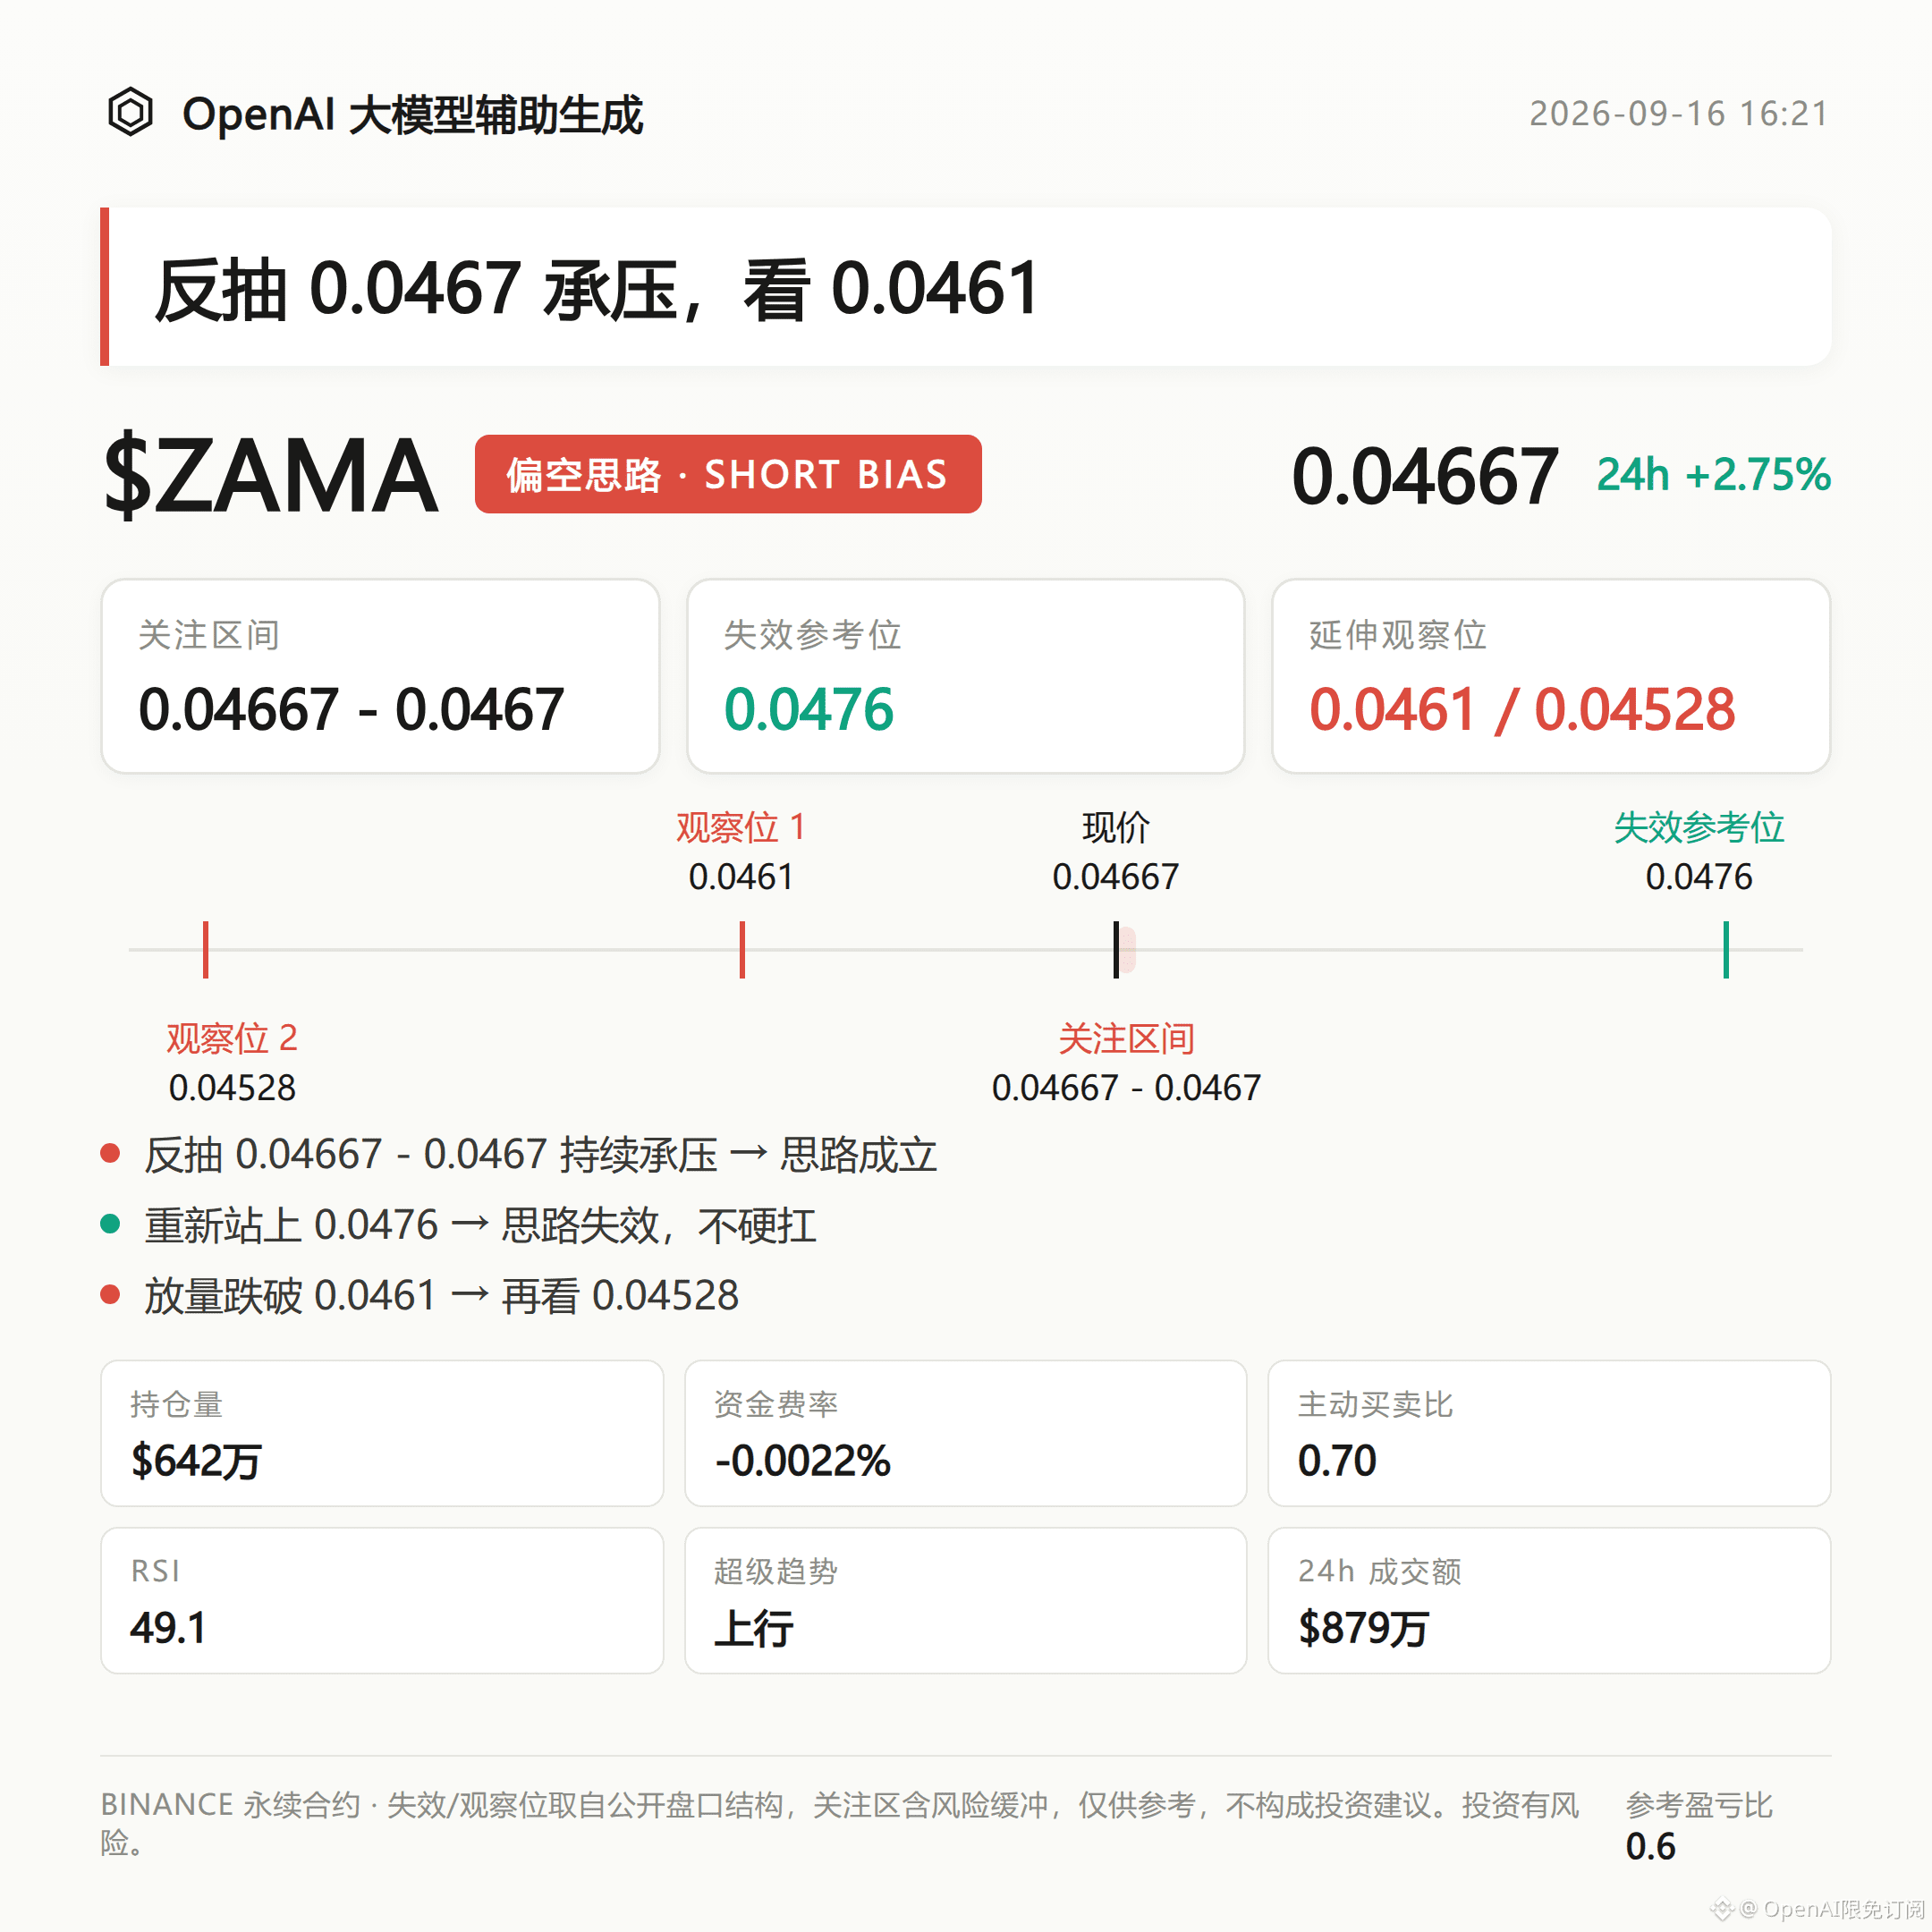
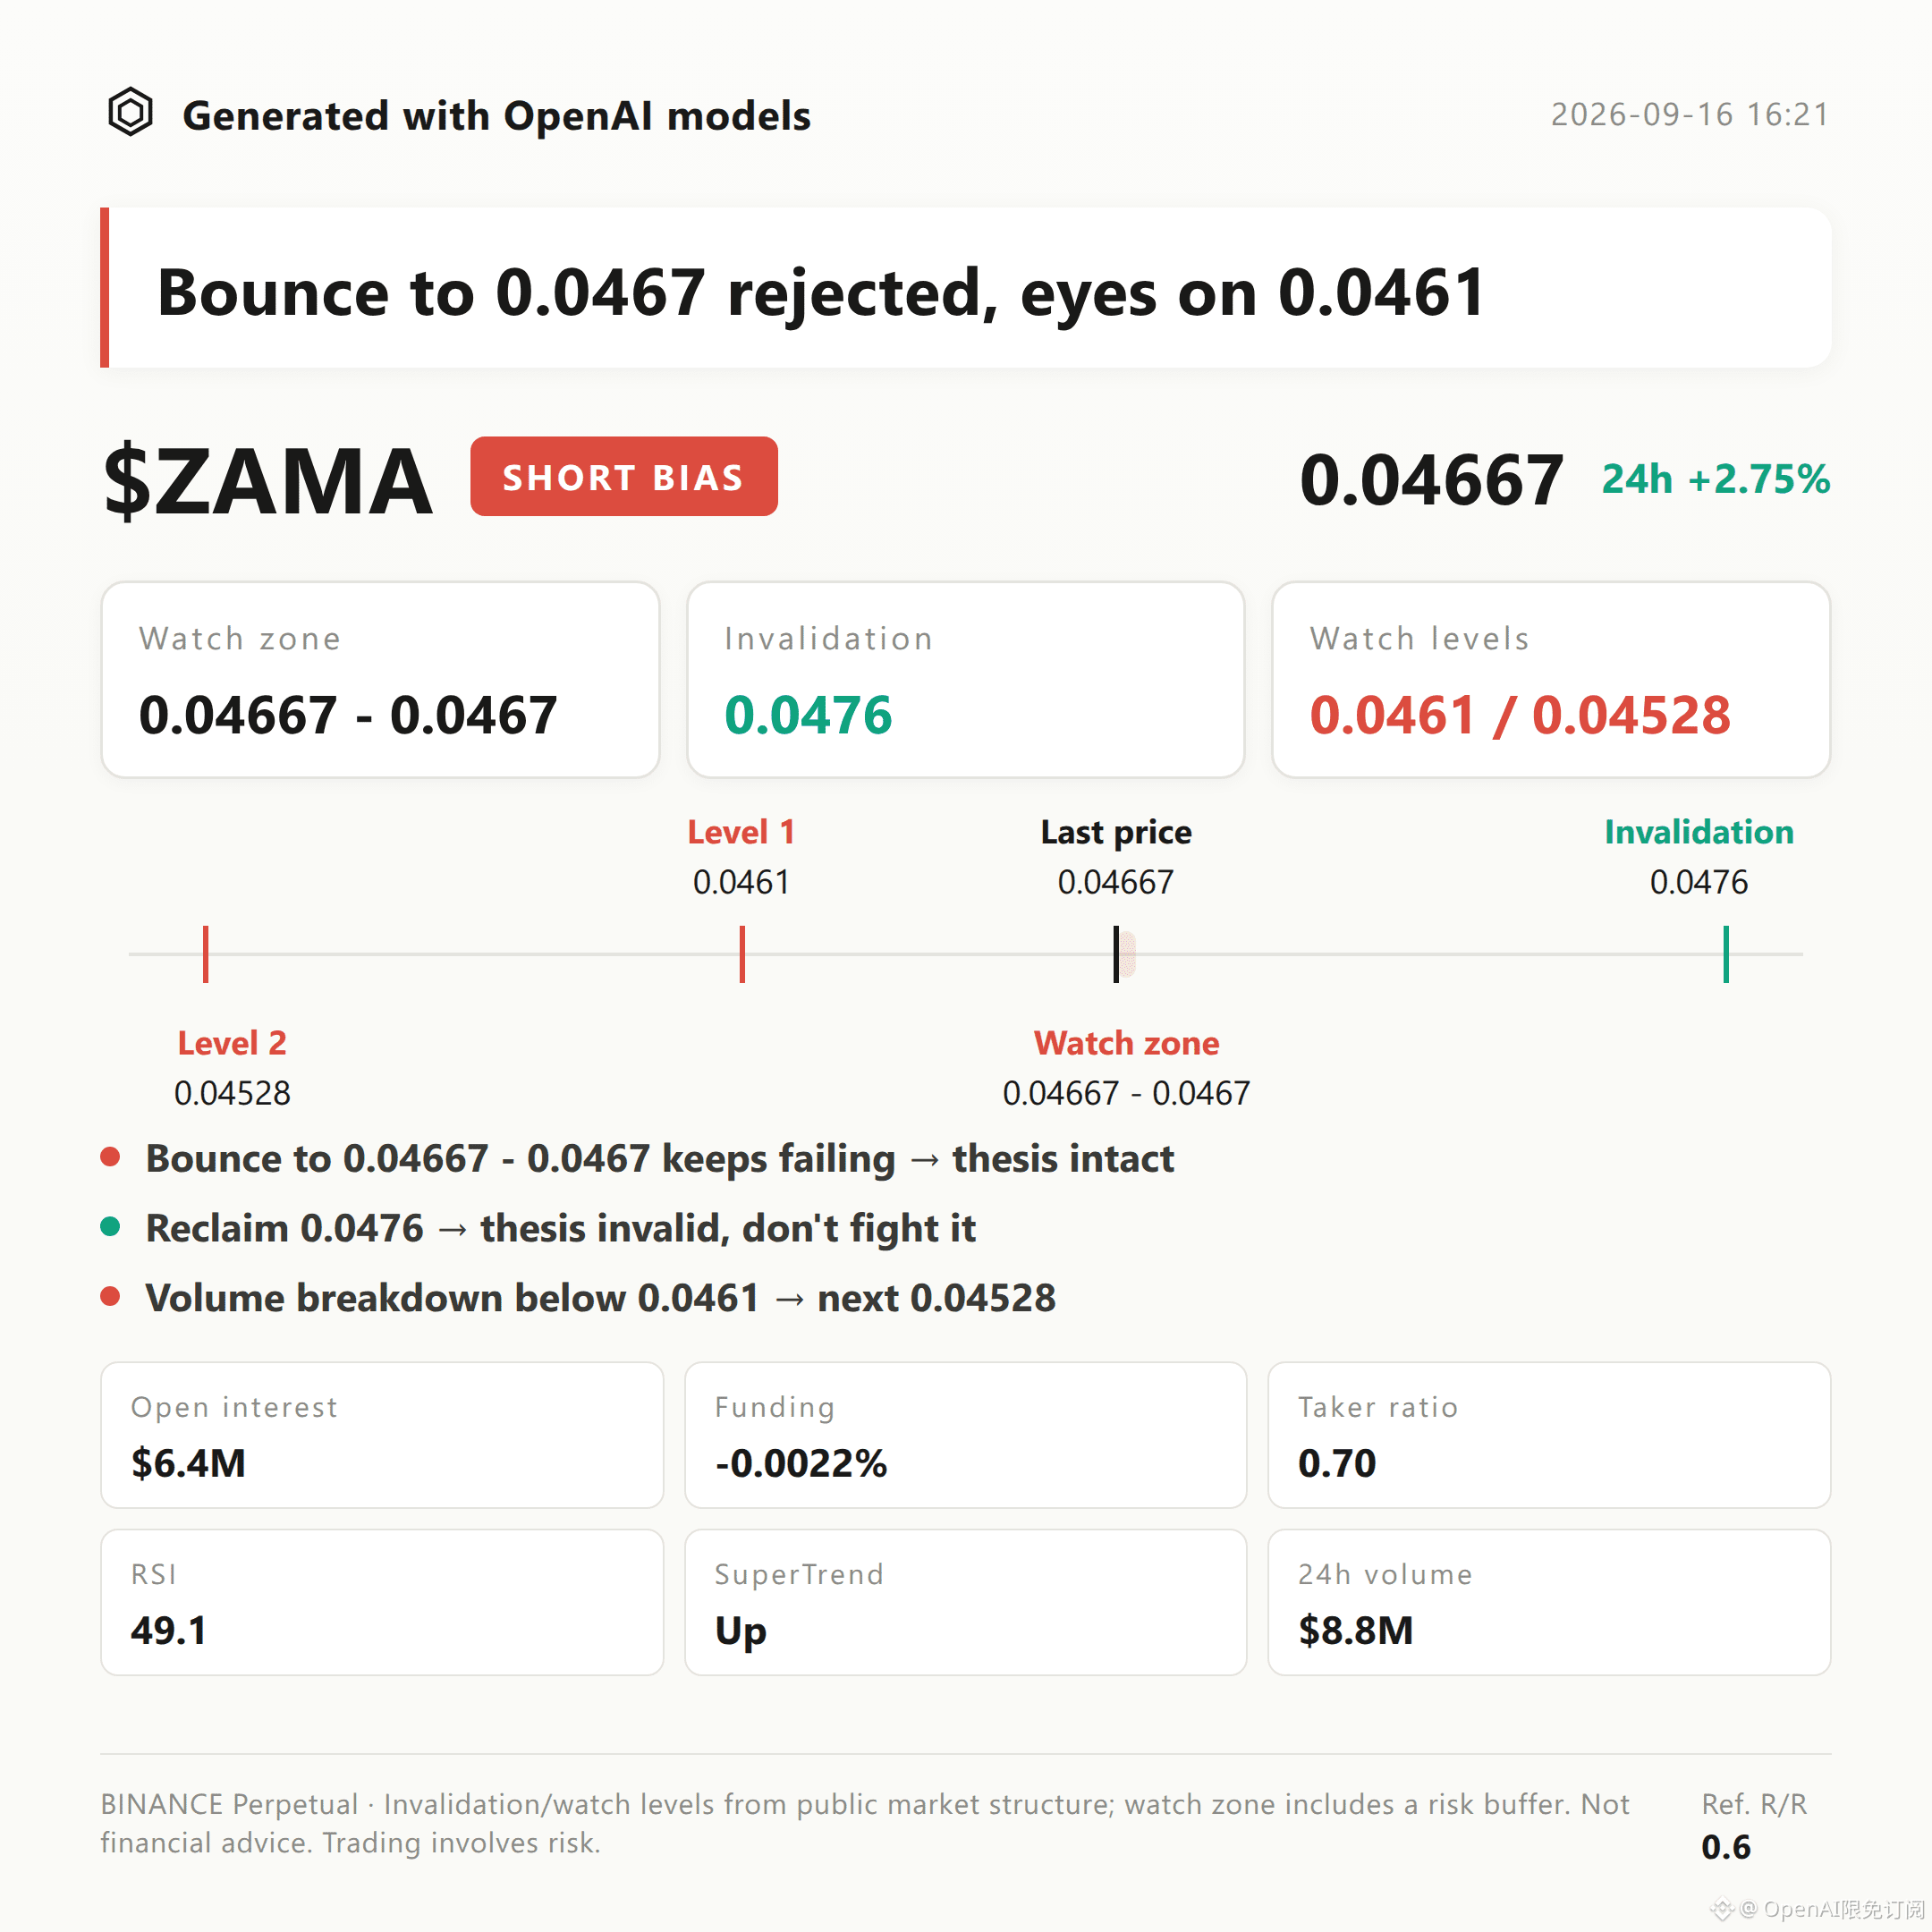
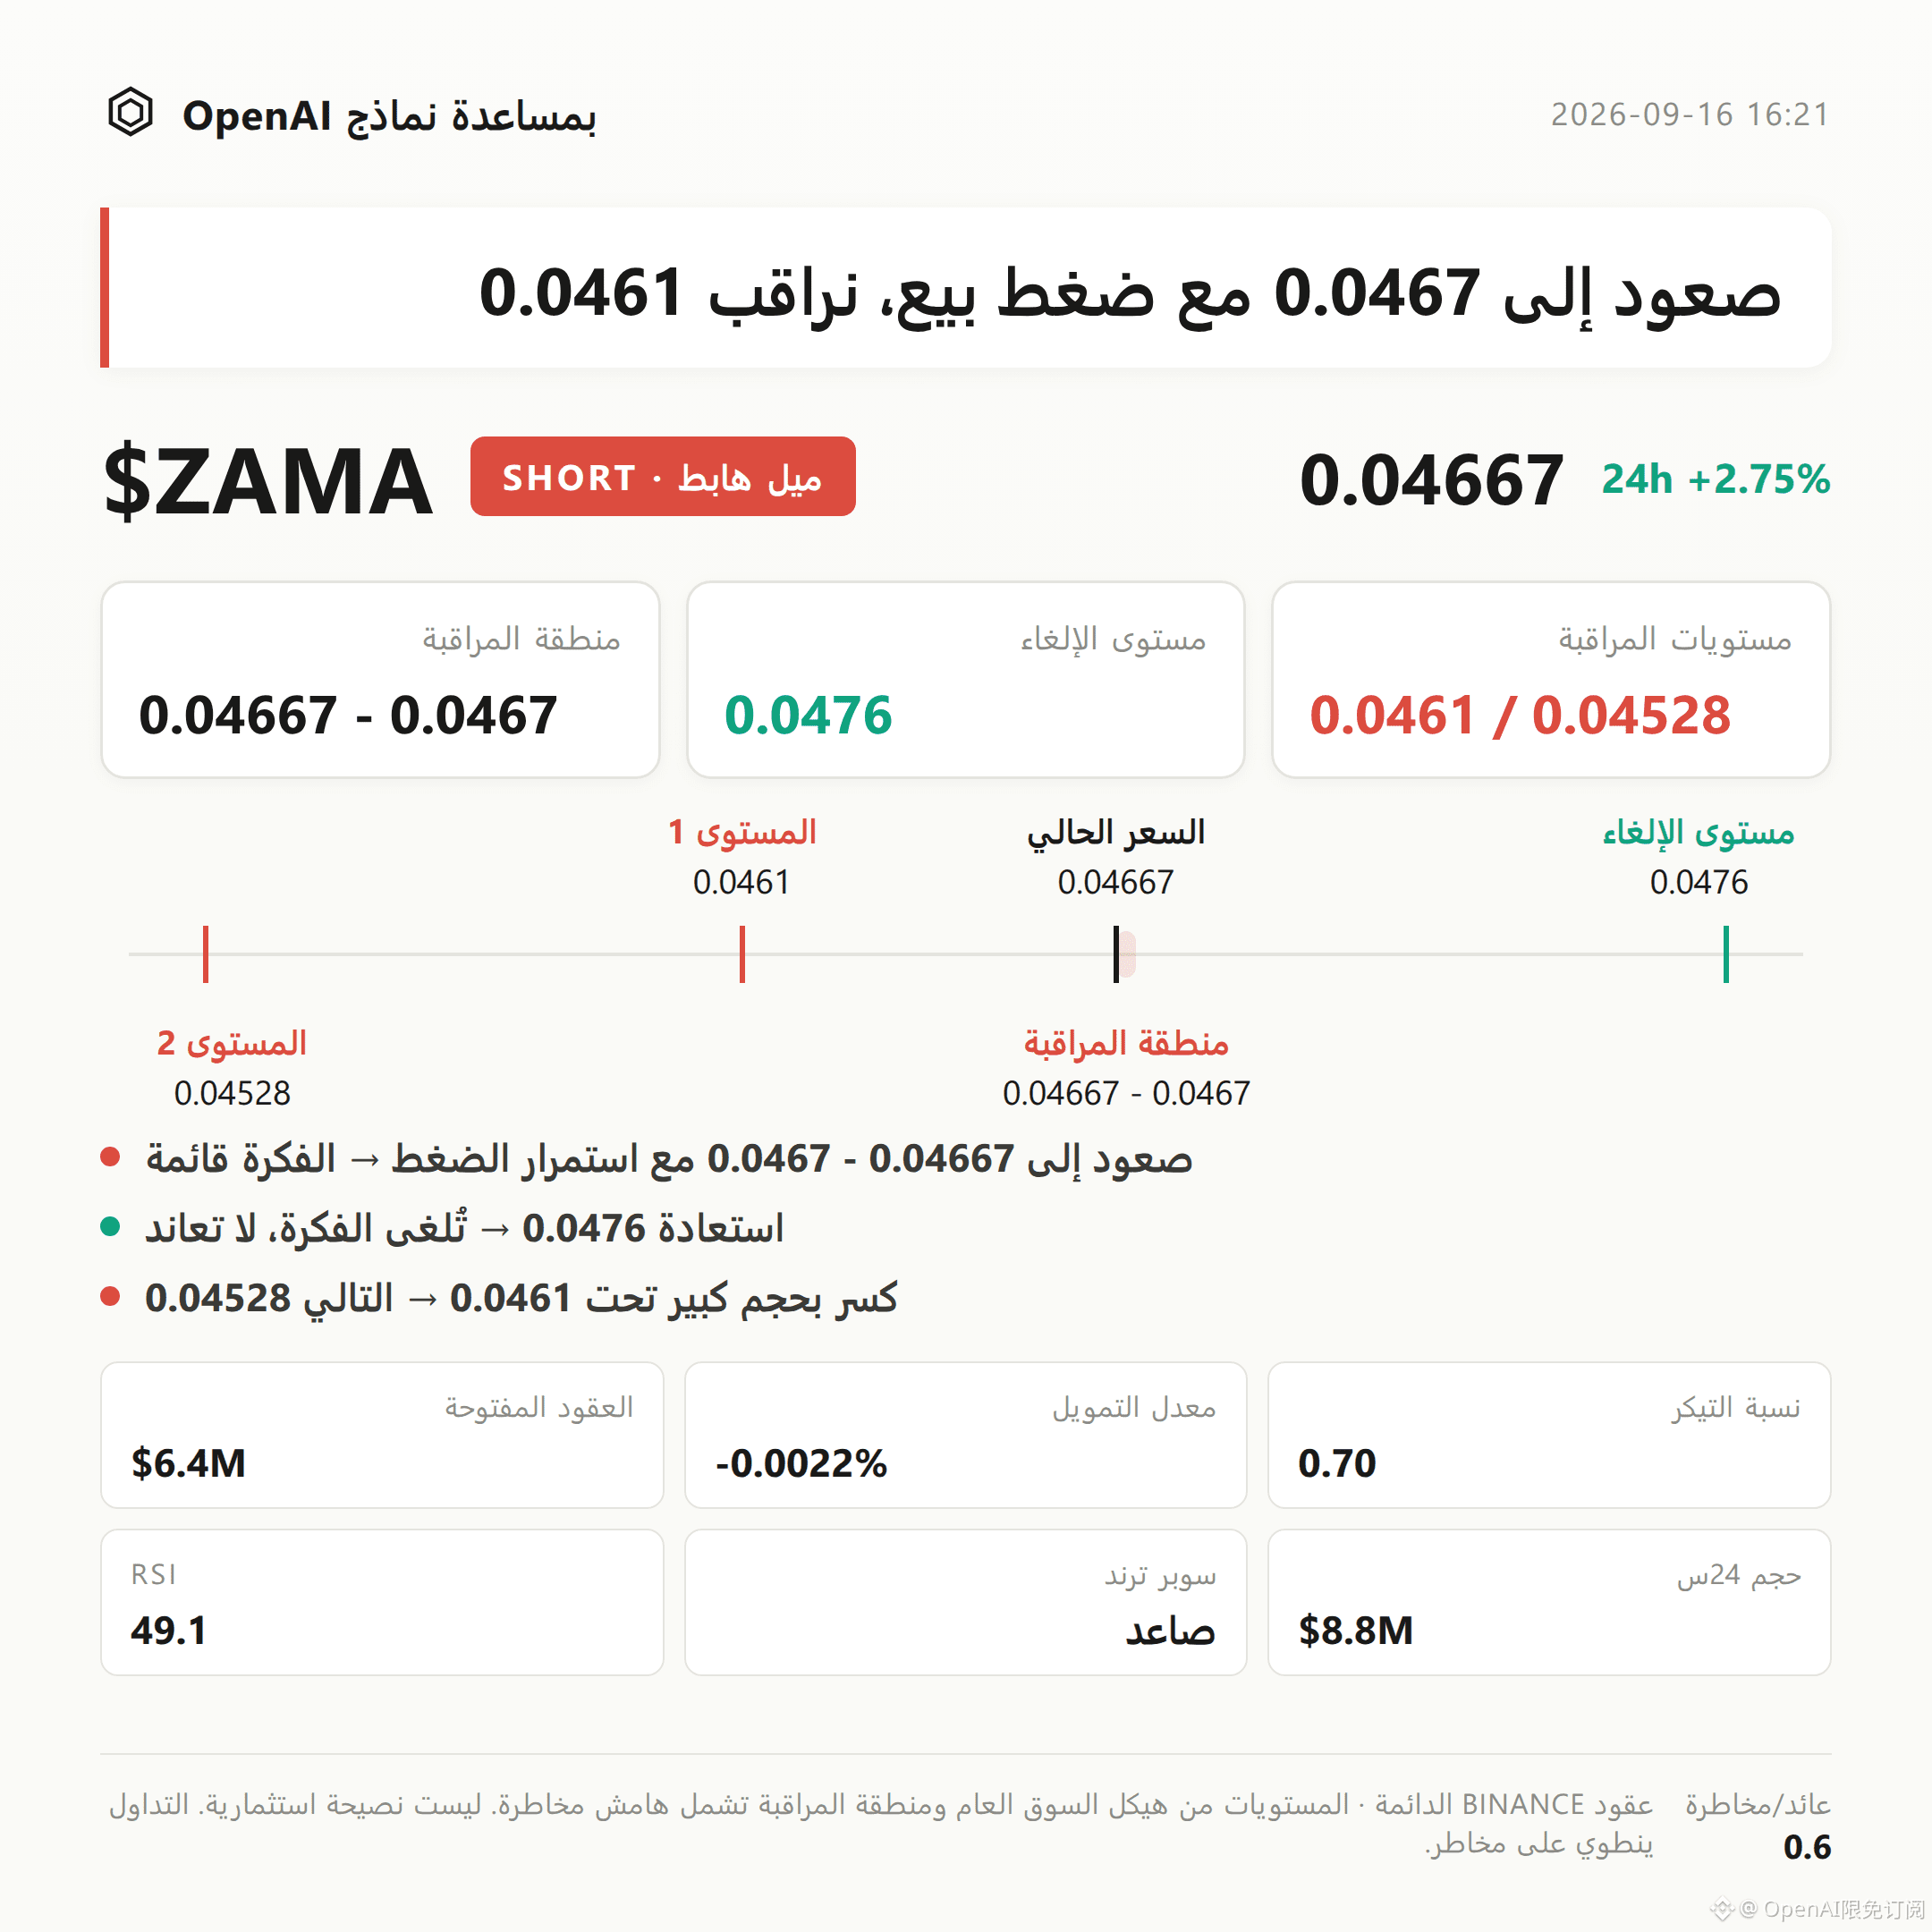
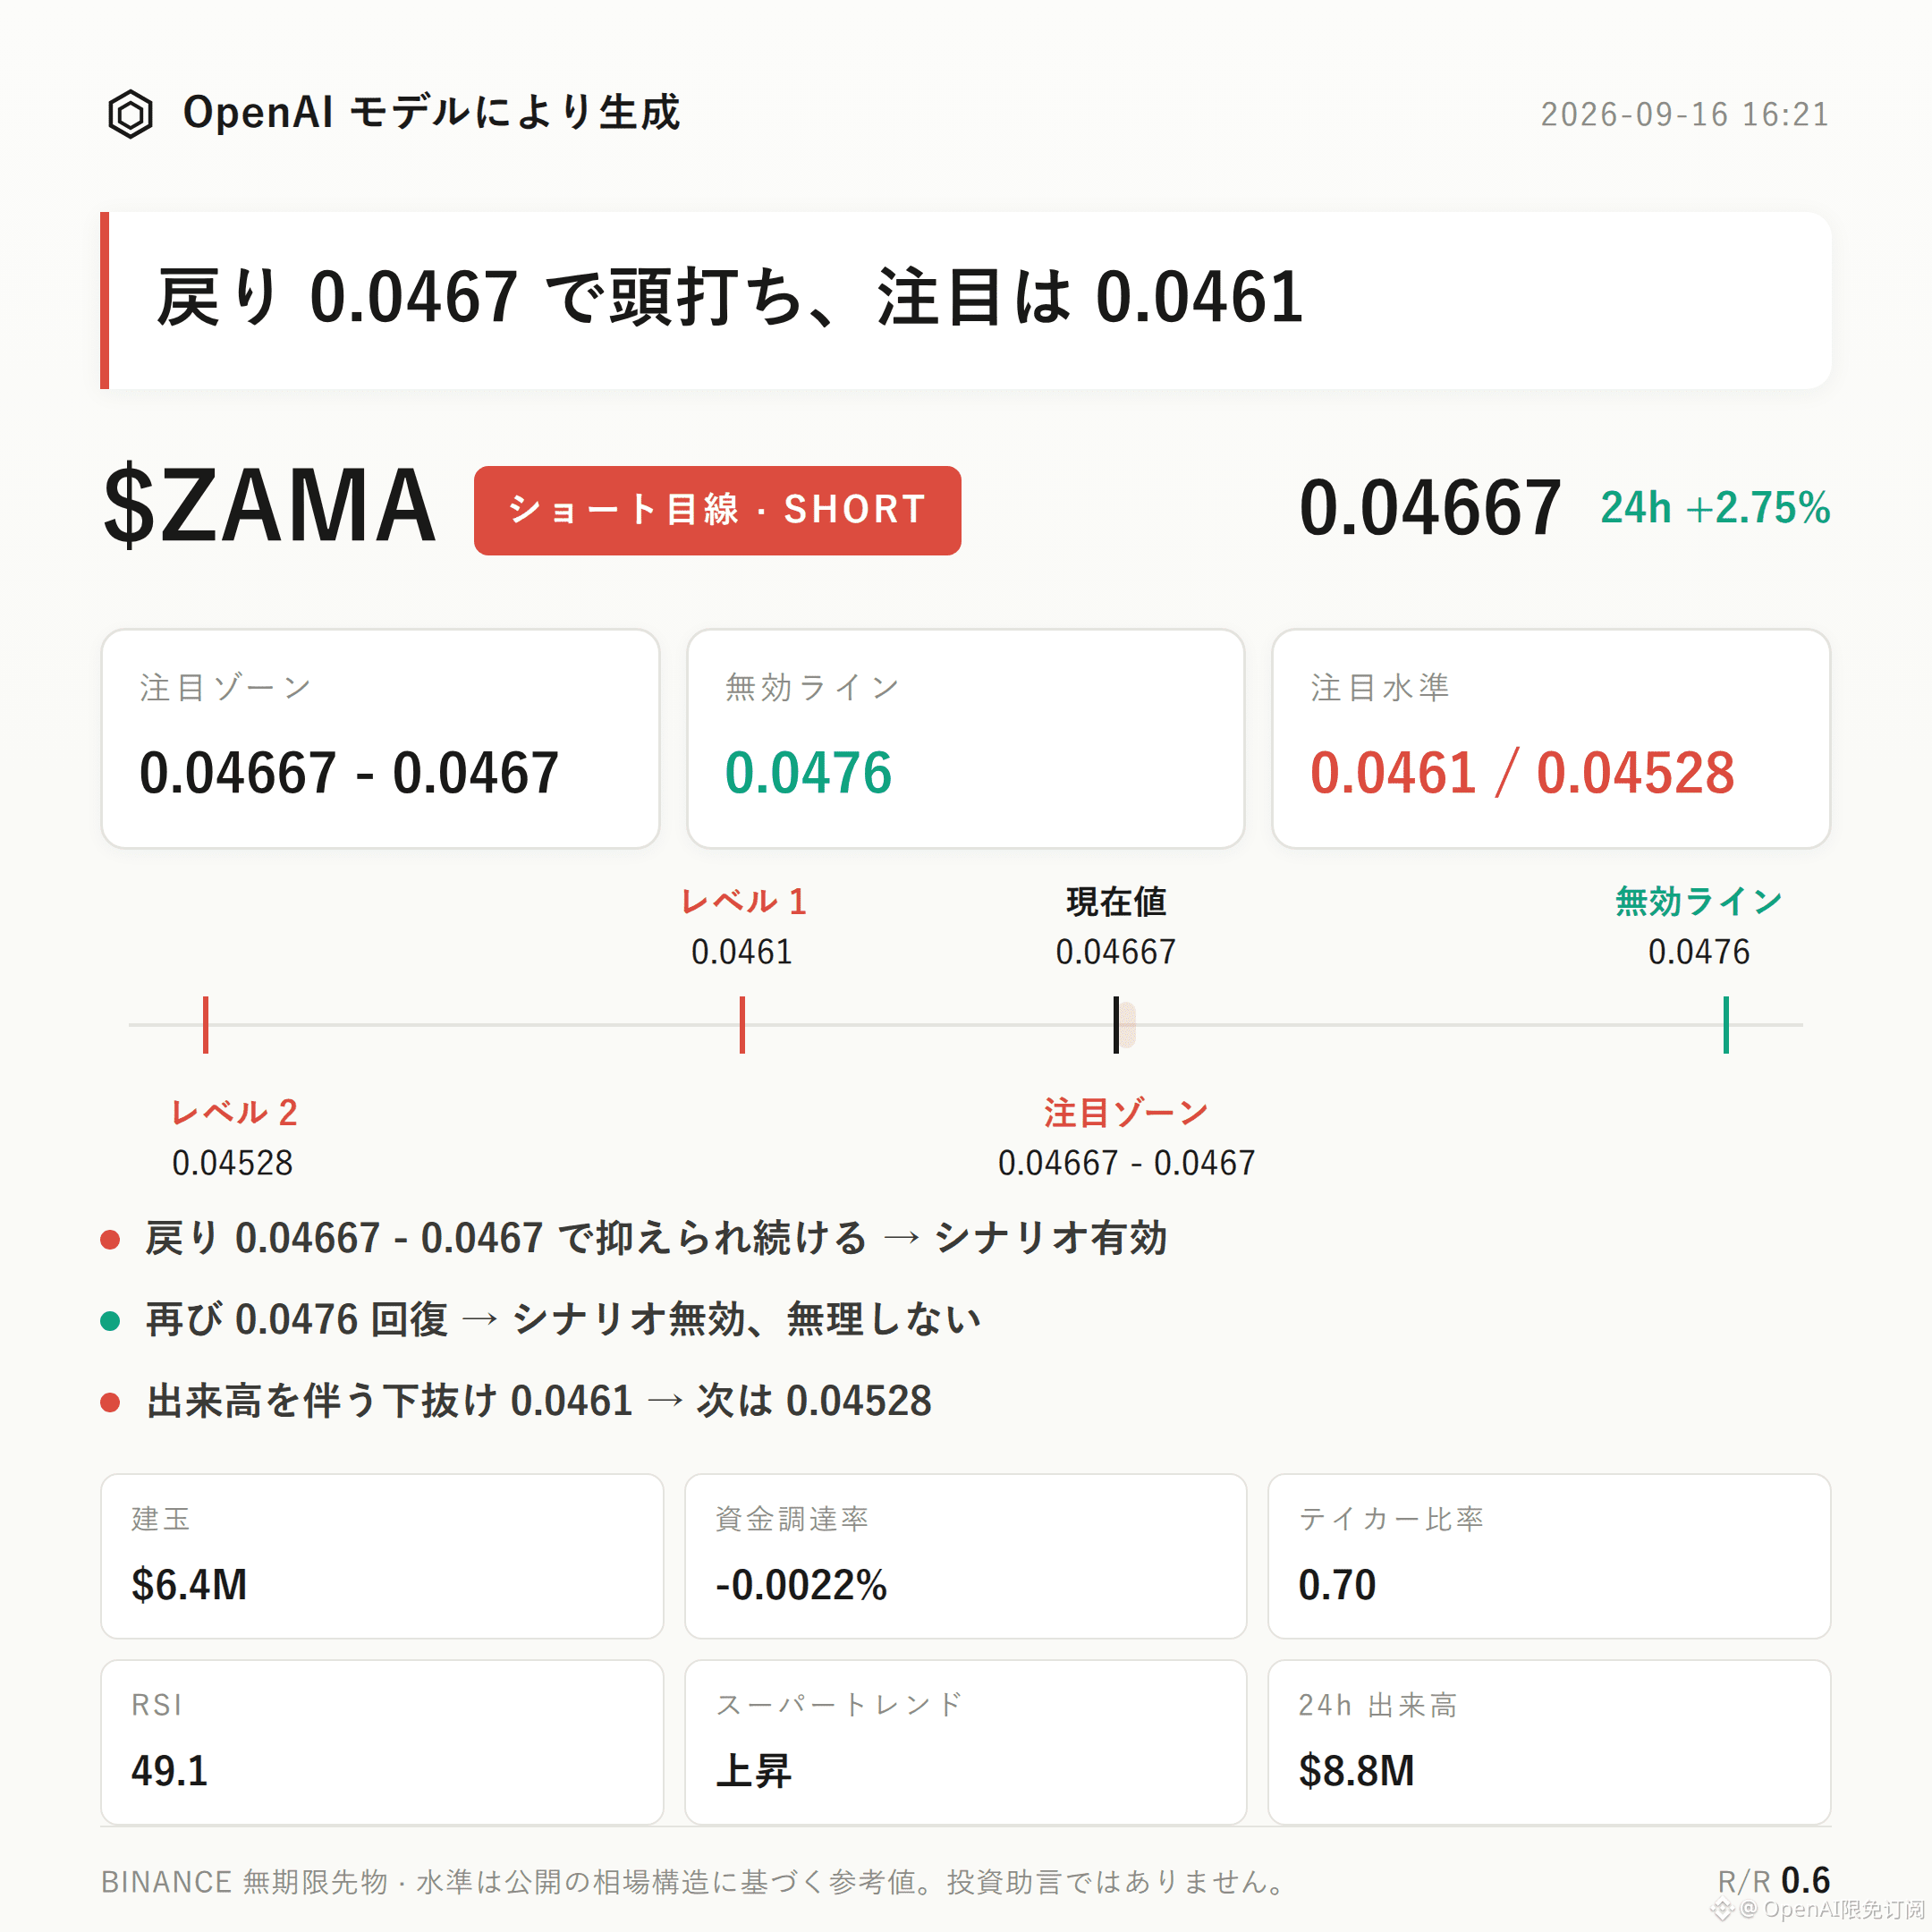
$ZAMA bearish-bias approach | Watch zone 0.04667 - 0.0467 | Invalid reference 0.0476 | Observation levels 0.0461 / 0.04528
$ZAMA ’s current bearish structure is unfolding.
The buy/sell ratio of 0.70 indicates sell-side dominance. After price touched the recent high around 0.0476, it failed to continue upward and has since pulled back to the Bollinger mid-band near 0.0467. The funding rate has turned negative to -0.0022%, showing that the willingness of longs to keep pressing is weakening.
The key is whether any rebound can be capped in the resistance area—this is crucial for judging whether this round of pullback can continue.
From the technical structure: the recent high at 0.0476 and the low at 0.04528 form the current fluctuation range. Current price at 0.04667 is slightly above the middle of the range.
Bollinger upper band 0.0474, middle band 0.0467, lower band 0.0461. Price has fallen from the upper band back toward the mid-band, and short-term momentum has somewhat cooled.
RSI is 49.1, in a neutral zone, not yet in oversold territory, and there is still downside room to release.
The 24-hour gain/loss remains +2.75%, so directionally it hasn’t clearly weakened. However, price has already pulled back from the high, so caution is warranted.
It’s necessary to be straightforward: MACD currently shows long momentum, and the SuperTrend indicator is still in an upward state. This creates a bearish-bias divergence signal against the short-term pullback structure—an important hedging consideration that must be watched continuously.
For derivatives data: 24-hour trading volume is $8.79M, open interest is $6.42M. The 24-hour change is +8.6%, indicating new positions are still flowing in.
The long/short accounts ratio shows longs at 44%, meaning longs are in the minority. The buy/sell ratio of 0.70 further confirms sell-side dominance.
Funding rate is -0.0022%: longs are paying the shorts’ cost, so short-term sentiment leans toward caution.
Regarding reference levels: for the bearish watch zone, start by looking at 0.04667-0.0467; it’s more suitable to wait for confirmation after a rebound meets resistance.
If price rebounds back into that area but fails to reclaim it effectively, that suggests resistance confirmation and the bearish thesis is temporarily valid.
If price climbs back above 0.0476, it would mean the current pullback structure is broken and the bearish thesis is invalid—do not keep applying it.
If price breaks down below 0.0461 on increased volume, then look again at support near 0.04528 as the next observation level, rather than assuming continuation directly.
Need to state honestly: this round of pullback has not yet shown a clear opposite-direction signal. But the divergence between MACD long momentum and the SuperTrend’s upward move is itself a factor that cannot be ignored.
Reference risk/reward is about 0.6—risk and potential return are not favorable. A structural read being “valid” does not guarantee an outcome.
With contract leverage, position discipline matters more than direction—please evaluate your own risk tolerance.
Position note: This account’s spot/paper positions hold $FOGO long. Continue holding as long as the thesis remains intact.
For reference only, not investment advice. Contracts involve leverage; investing is risky.
This article is generated with assistance from an OpenAI model.
$ZAMA
#Contracts
$ZAMA bearish-bias approach | Watch zone 0.04667 - 0.0467 | Invalid reference 0.0476 | Observation levels 0.0461 / 0.04528
$ZAMA ’s current bearish structure is unfolding.
The buy/sell ratio of 0.70 indicates sell-side dominance. After price touched the recent high around 0.0476, it failed to continue upward and has since pulled back to the Bollinger mid-band near 0.0467. The funding rate has turned negative to -0.0022%, showing that the willingness of longs to keep pressing is weakening.
The key is whether any rebound can be capped in the resistance area—this is crucial for judging whether this round of pullback can continue.
From the technical structure: the recent high at 0.0476 and the low at 0.04528 form the current fluctuation range. Current price at 0.04667 is slightly above the middle of the range.
Bollinger upper band 0.0474, middle band 0.0467, lower band 0.0461. Price has fallen from the upper band back toward the mid-band, and short-term momentum has somewhat cooled.
RSI is 49.1, in a neutral zone, not yet in oversold territory, and there is still downside room to release.
The 24-hour gain/loss remains +2.75%, so directionally it hasn’t clearly weakened. However, price has already pulled back from the high, so caution is warranted.
It’s necessary to be straightforward: MACD currently shows long momentum, and the SuperTrend indicator is still in an upward state. This creates a bearish-bias divergence signal against the short-term pullback structure—an important hedging consideration that must be watched continuously.
For derivatives data: 24-hour trading volume is $8.79M, open interest is $6.42M. The 24-hour change is +8.6%, indicating new positions are still flowing in.
The long/short accounts ratio shows longs at 44%, meaning longs are in the minority. The buy/sell ratio of 0.70 further confirms sell-side dominance.
Funding rate is -0.0022%: longs are paying the shorts’ cost, so short-term sentiment leans toward caution.
Regarding reference levels: for the bearish watch zone, start by looking at 0.04667-0.0467; it’s more suitable to wait for confirmation after a rebound meets resistance.
If price rebounds back into that area but fails to reclaim it effectively, that suggests resistance confirmation and the bearish thesis is temporarily valid.
If price climbs back above 0.0476, it would mean the current pullback structure is broken and the bearish thesis is invalid—do not keep applying it.
If price breaks down below 0.0461 on increased volume, then look again at support near 0.04528 as the next observation level, rather than assuming continuation directly.
Need to state honestly: this round of pullback has not yet shown a clear opposite-direction signal. But the divergence between MACD long momentum and the SuperTrend’s upward move is itself a factor that cannot be ignored.
Reference risk/reward is about 0.6—risk and potential return are not favorable. A structural read being “valid” does not guarantee an outcome.
With contract leverage, position discipline matters more than direction—please evaluate your own risk tolerance.
Position note: This account’s spot/paper positions hold $FOGO long. Continue holding as long as the thesis remains intact.
For reference only, not investment advice. Contracts involve leverage; investing is risky.
This article is generated with assistance from an OpenAI model.
$ZAMA
#Contracts