
全球零撸达人
3.1k Posts

全球零撸达人
Report
Block User
🐲0撸达人网站:Burncion.xyz web3赚钱分享, 围绕币安平台进行深耕,擅长撸毛,喜欢就关注!

USD1 Holder
High-Frequency Trader
11.6 Months
485 Following
10.9K+ Followers
4.0K+ Liked
Posts
All
Quotes
Videos
Live
PINNED
·
--
The Fed hasn’t even spoken yet, so why are you first loading up your position? Don’t stake your principal on rumors or news— the market won’t reward impulsiveness.#美联储加息是否已成定局 $SOXL
{future}(SOXLUSDT)
The Fed hasn’t even spoken yet, so why are you first loading up your position? Don’t stake your principal on rumors or news— the market won’t reward impulsiveness.#美联储加息是否已成定局 $SOXL

114
4
9
398
PINNED
·
--
🧧🧧Arc on-chain rewards are about to arrive......
Binance Wallet first wave of benefits
Stay tuned—Arc on-chain rewards are about to arrive......
Binance Wallet first wave of benefits
Stay tuned $ETH
{future}(ETHUSDT)
🧧🧧Arc on-chain rewards are about to arrive......
Binance Wallet first wave of benefits
Stay tuned—Arc on-chain rewards are about to arrive......
Binance Wallet first wave of benefits
Stay tuned $ETH
Binance Wallet first wave of benefits
Stay tuned—Arc on-chain rewards are about to arrive......
Binance Wallet first wave of benefits
Stay tuned $ETH

106
9
520
·
--
Anthropic|Opportunities in AI programming, as businesses are willing to pay
Opportunities in AI programming—businesses are willing to pay. The upgrade of the Claude model, combined with IPO expectations, is driving attention to paid growth and issuance valuation as we look for opportunities where performance can be realized.
Listing status: Not yet listed; no publicly available stock code (as of September 17, 2026).
#Anthropic #Claude #Fable5 #AI编程 #IPO observation
Anthropic|Opportunities in AI programming, as businesses are willing to pay
Opportunities in AI programming—businesses are willing to pay. The upgrade of the Claude model, combined with IPO expectations, is driving attention to paid growth and issuance valuation as we look for opportunities where performance can be realized.
Listing status: Not yet listed; no publicly available stock code (as of September 17, 2026).
#Anthropic #Claude #Fable5 #AI编程 #IPO observation
Opportunities in AI programming—businesses are willing to pay. The upgrade of the Claude model, combined with IPO expectations, is driving attention to paid growth and issuance valuation as we look for opportunities where performance can be realized.
Listing status: Not yet listed; no publicly available stock code (as of September 17, 2026).
#Anthropic #Claude #Fable5 #AI编程 #IPO observation

1
512
·
--
OpenAI|An Opportunity at the AI Entry Point, Turning Paid Use into Real Returns
An Opportunity at the AI Entry Point, Turning Paid Use into Real Returns. ChatGPT, Codex, and enterprise agents open up growth potential—watch for commercialization progress and wait for the IPO pricing.
IPO status: Not yet listed; no publicly available stock ticker (as of 2026-09-17).
#OpenAI #ChatGPT #Codex #AI商业化 #IPO观察
OpenAI|An Opportunity at the AI Entry Point, Turning Paid Use into Real Returns
An Opportunity at the AI Entry Point, Turning Paid Use into Real Returns. ChatGPT, Codex, and enterprise agents open up growth potential—watch for commercialization progress and wait for the IPO pricing.
IPO status: Not yet listed; no publicly available stock ticker (as of 2026-09-17).
#OpenAI #ChatGPT #Codex #AI商业化 #IPO观察
An Opportunity at the AI Entry Point, Turning Paid Use into Real Returns. ChatGPT, Codex, and enterprise agents open up growth potential—watch for commercialization progress and wait for the IPO pricing.
IPO status: Not yet listed; no publicly available stock ticker (as of 2026-09-17).
#OpenAI #ChatGPT #Codex #AI商业化 #IPO观察

1
297
·
--
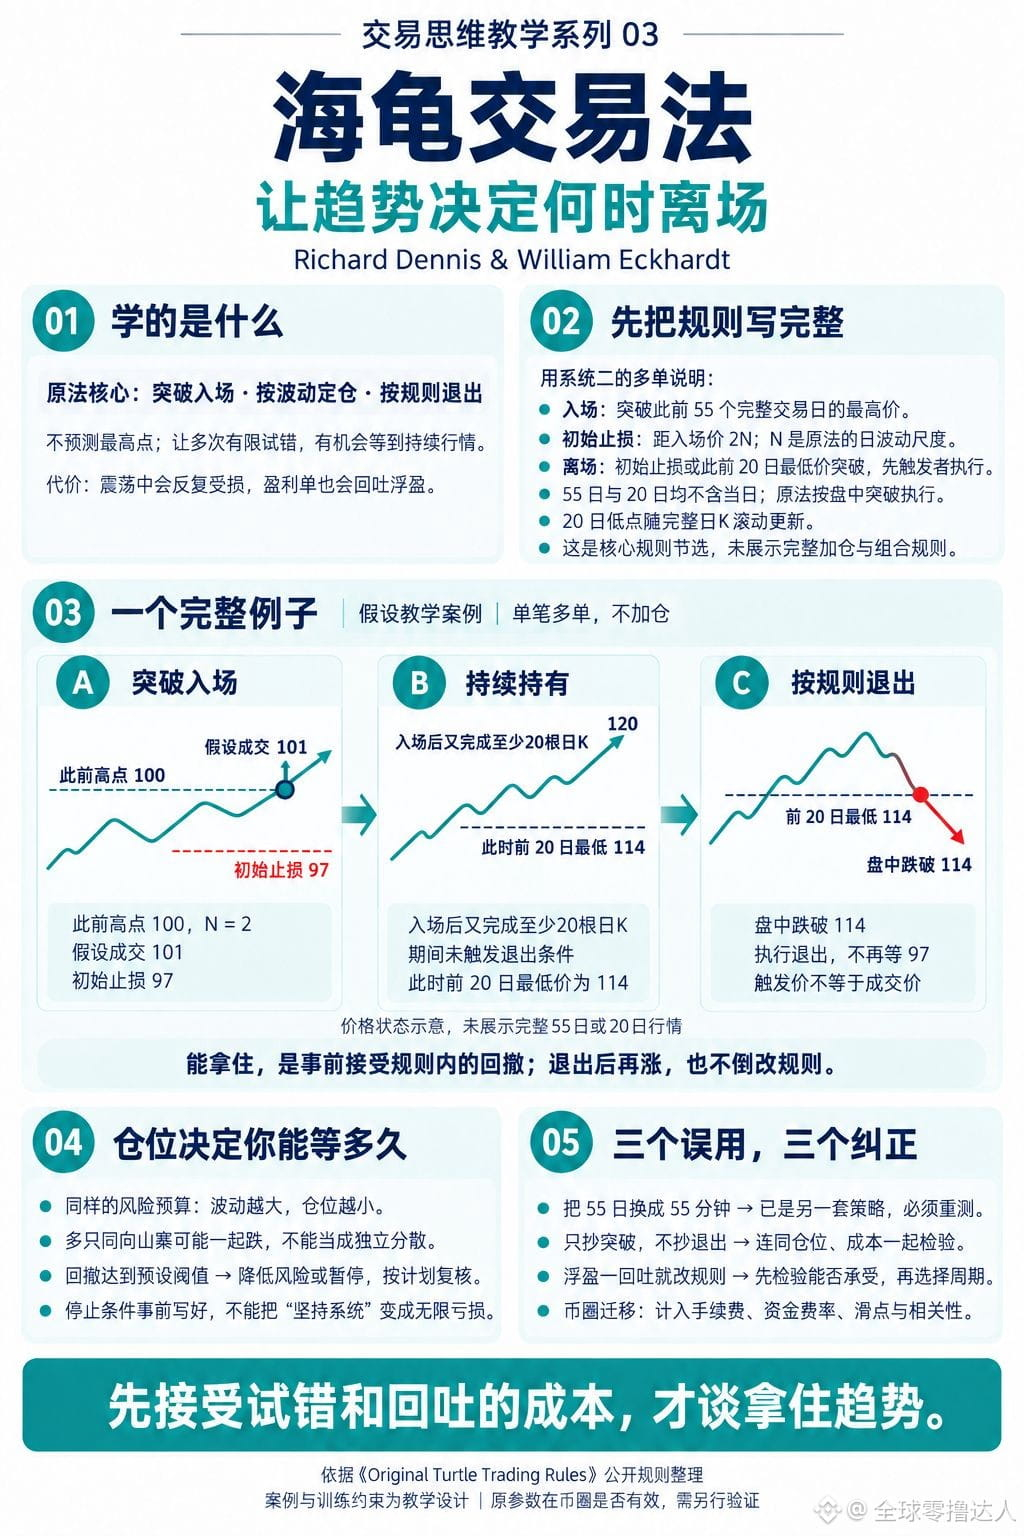
03 Turtle Trading Rules|Let Trends Decide When to Exit
RICHARD DENNIS & WILLIAM ECKHARDT
Core Idea
Enter on a breakout, size positions by volatility, and exit according to the rules. Allow for multiple limited attempts at error to participate in sustained market trends; the price is repeatedly getting damaged during choppy periods and giving back some floating profits on winning trades.
Part of the Original System Two: Long-Position Core Rules
- Entry: Break through the highest price of the previous 55 complete trading days during the session.
- Initial stop-loss: 2N below the entry price; N is the daily volatility scale as defined in the original rules.
- Trend exit: During the session, fall below the lowest price of the previous 20 complete trading days.
- Initial stop-loss and trend exit: whichever triggers first is executed.
The 55-day and 20-day counts do not include the current day. The 20-day low updates as each complete day’s K-line rolls forward. This is only a core excerpt; it does not show the full rules for adding positions, combinations, and risk.
Hypothetical Example: How to Hold, How to End
The previous 55-day highest price is 100, and N=2. After the breakout, suppose the trade occurs at 101, so the initial stop-loss is 97.
After entry, at least 20 daily K-bars are completed, and no exit is triggered during that time. Suppose the price later rises to 120; at that moment, the lowest price of the previous 20 complete trading days is 114.
If, during the session, the price breaks below 114, then exit is executed immediately; no need to wait for 97. 114 is a trigger reference price; it does not guarantee the actual execution price.
Not selling at 120 does not automatically mean failure: this holding approach already accepts giving back some floating profits in advance.
The Most Common Pitfalls
Copy only the breakout, not the exit; change 55 days to 55 minutes and think it’s the same method; buy several aligned altcoins and think you’ve achieved diversification; turn “sticking to the rules” into unlimited trial-and-error.
Corrective Actions
The greater the volatility, the smaller the number of units for the same risk budget; also check the total risk of the related positions. Set drawdown-recheck conditions in advance—once the threshold is reached, reduce risk according to the plan or pause. If parameters, fees, or the market change, re-test.
Only after accepting the cost of trial-and-error and profit givebacks can you talk about holding onto trends.
Source: Original Turtle Trading Rules official public entry (https://tradingblox.com/originalturtles/originalturtlerules.htm) and a mirror of the original rules PDF (https://www.kagels-trading.de/wp-content/uploads/2016/09/turtle-trading-rules.pdf). The numerical example and training constraints are instructional designs; whether the original parameters work in crypto requires separate verification.
How to Learn Together
- Miller: practice picking strong stocks and waiting for entry.
- Linda: practice false breakouts within ranges and short-term exits.
- Turtle: practice trend following and rule-based holding.
Practice the three methods separately and record separately. The same trade cannot change its exit rationale temporarily just because it starts going against you.
The following is a public-method instructional distillation. Numerical examples, filtering conditions, and practice time windows are instructional designs; they do not represent the trader’s complete system or unified parameters. R is the initial planned risk for this trade; actual losses may exceed the plan due to slippage and fees.
03 Turtle Trading Rules|Let Trends Decide When to Exit
RICHARD DENNIS & WILLIAM ECKHARDT
Core Idea
Enter on a breakout, size positions by volatility, and exit according to the rules. Allow for multiple limited attempts at error to participate in sustained market trends; the price is repeatedly getting damaged during choppy periods and giving back some floating profits on winning trades.
Part of the Original System Two: Long-Position Core Rules
- Entry: Break through the highest price of the previous 55 complete trading days during the session.
- Initial stop-loss: 2N below the entry price; N is the daily volatility scale as defined in the original rules.
- Trend exit: During the session, fall below the lowest price of the previous 20 complete trading days.
- Initial stop-loss and trend exit: whichever triggers first is executed.
The 55-day and 20-day counts do not include the current day. The 20-day low updates as each complete day’s K-line rolls forward. This is only a core excerpt; it does not show the full rules for adding positions, combinations, and risk.
Hypothetical Example: How to Hold, How to End
The previous 55-day highest price is 100, and N=2. After the breakout, suppose the trade occurs at 101, so the initial stop-loss is 97.
After entry, at least 20 daily K-bars are completed, and no exit is triggered during that time. Suppose the price later rises to 120; at that moment, the lowest price of the previous 20 complete trading days is 114.
If, during the session, the price breaks below 114, then exit is executed immediately; no need to wait for 97. 114 is a trigger reference price; it does not guarantee the actual execution price.
Not selling at 120 does not automatically mean failure: this holding approach already accepts giving back some floating profits in advance.
The Most Common Pitfalls
Copy only the breakout, not the exit; change 55 days to 55 minutes and think it’s the same method; buy several aligned altcoins and think you’ve achieved diversification; turn “sticking to the rules” into unlimited trial-and-error.
Corrective Actions
The greater the volatility, the smaller the number of units for the same risk budget; also check the total risk of the related positions. Set drawdown-recheck conditions in advance—once the threshold is reached, reduce risk according to the plan or pause. If parameters, fees, or the market change, re-test.
Only after accepting the cost of trial-and-error and profit givebacks can you talk about holding onto trends.
Source: Original Turtle Trading Rules official public entry (https://tradingblox.com/originalturtles/originalturtlerules.htm) and a mirror of the original rules PDF (https://www.kagels-trading.de/wp-content/uploads/2016/09/turtle-trading-rules.pdf). The numerical example and training constraints are instructional designs; whether the original parameters work in crypto requires separate verification.
How to Learn Together
- Miller: practice picking strong stocks and waiting for entry.
- Linda: practice false breakouts within ranges and short-term exits.
- Turtle: practice trend following and rule-based holding.
Practice the three methods separately and record separately. The same trade cannot change its exit rationale temporarily just because it starts going against you.
The following is a public-method instructional distillation. Numerical examples, filtering conditions, and practice time windows are instructional designs; they do not represent the trader’s complete system or unified parameters. R is the initial planned risk for this trade; actual losses may exceed the plan due to slippage and fees.
RICHARD DENNIS & WILLIAM ECKHARDT
Core Idea
Enter on a breakout, size positions by volatility, and exit according to the rules. Allow for multiple limited attempts at error to participate in sustained market trends; the price is repeatedly getting damaged during choppy periods and giving back some floating profits on winning trades.
Part of the Original System Two: Long-Position Core Rules
- Entry: Break through the highest price of the previous 55 complete trading days during the session.
- Initial stop-loss: 2N below the entry price; N is the daily volatility scale as defined in the original rules.
- Trend exit: During the session, fall below the lowest price of the previous 20 complete trading days.
- Initial stop-loss and trend exit: whichever triggers first is executed.
The 55-day and 20-day counts do not include the current day. The 20-day low updates as each complete day’s K-line rolls forward. This is only a core excerpt; it does not show the full rules for adding positions, combinations, and risk.
Hypothetical Example: How to Hold, How to End
The previous 55-day highest price is 100, and N=2. After the breakout, suppose the trade occurs at 101, so the initial stop-loss is 97.
After entry, at least 20 daily K-bars are completed, and no exit is triggered during that time. Suppose the price later rises to 120; at that moment, the lowest price of the previous 20 complete trading days is 114.
If, during the session, the price breaks below 114, then exit is executed immediately; no need to wait for 97. 114 is a trigger reference price; it does not guarantee the actual execution price.
Not selling at 120 does not automatically mean failure: this holding approach already accepts giving back some floating profits in advance.
The Most Common Pitfalls
Copy only the breakout, not the exit; change 55 days to 55 minutes and think it’s the same method; buy several aligned altcoins and think you’ve achieved diversification; turn “sticking to the rules” into unlimited trial-and-error.
Corrective Actions
The greater the volatility, the smaller the number of units for the same risk budget; also check the total risk of the related positions. Set drawdown-recheck conditions in advance—once the threshold is reached, reduce risk according to the plan or pause. If parameters, fees, or the market change, re-test.
Only after accepting the cost of trial-and-error and profit givebacks can you talk about holding onto trends.
Source: Original Turtle Trading Rules official public entry (https://tradingblox.com/originalturtles/originalturtlerules.htm) and a mirror of the original rules PDF (https://www.kagels-trading.de/wp-content/uploads/2016/09/turtle-trading-rules.pdf). The numerical example and training constraints are instructional designs; whether the original parameters work in crypto requires separate verification.
How to Learn Together
- Miller: practice picking strong stocks and waiting for entry.
- Linda: practice false breakouts within ranges and short-term exits.
- Turtle: practice trend following and rule-based holding.
Practice the three methods separately and record separately. The same trade cannot change its exit rationale temporarily just because it starts going against you.
The following is a public-method instructional distillation. Numerical examples, filtering conditions, and practice time windows are instructional designs; they do not represent the trader’s complete system or unified parameters. R is the initial planned risk for this trade; actual losses may exceed the plan due to slippage and fees.
1
240
·
--
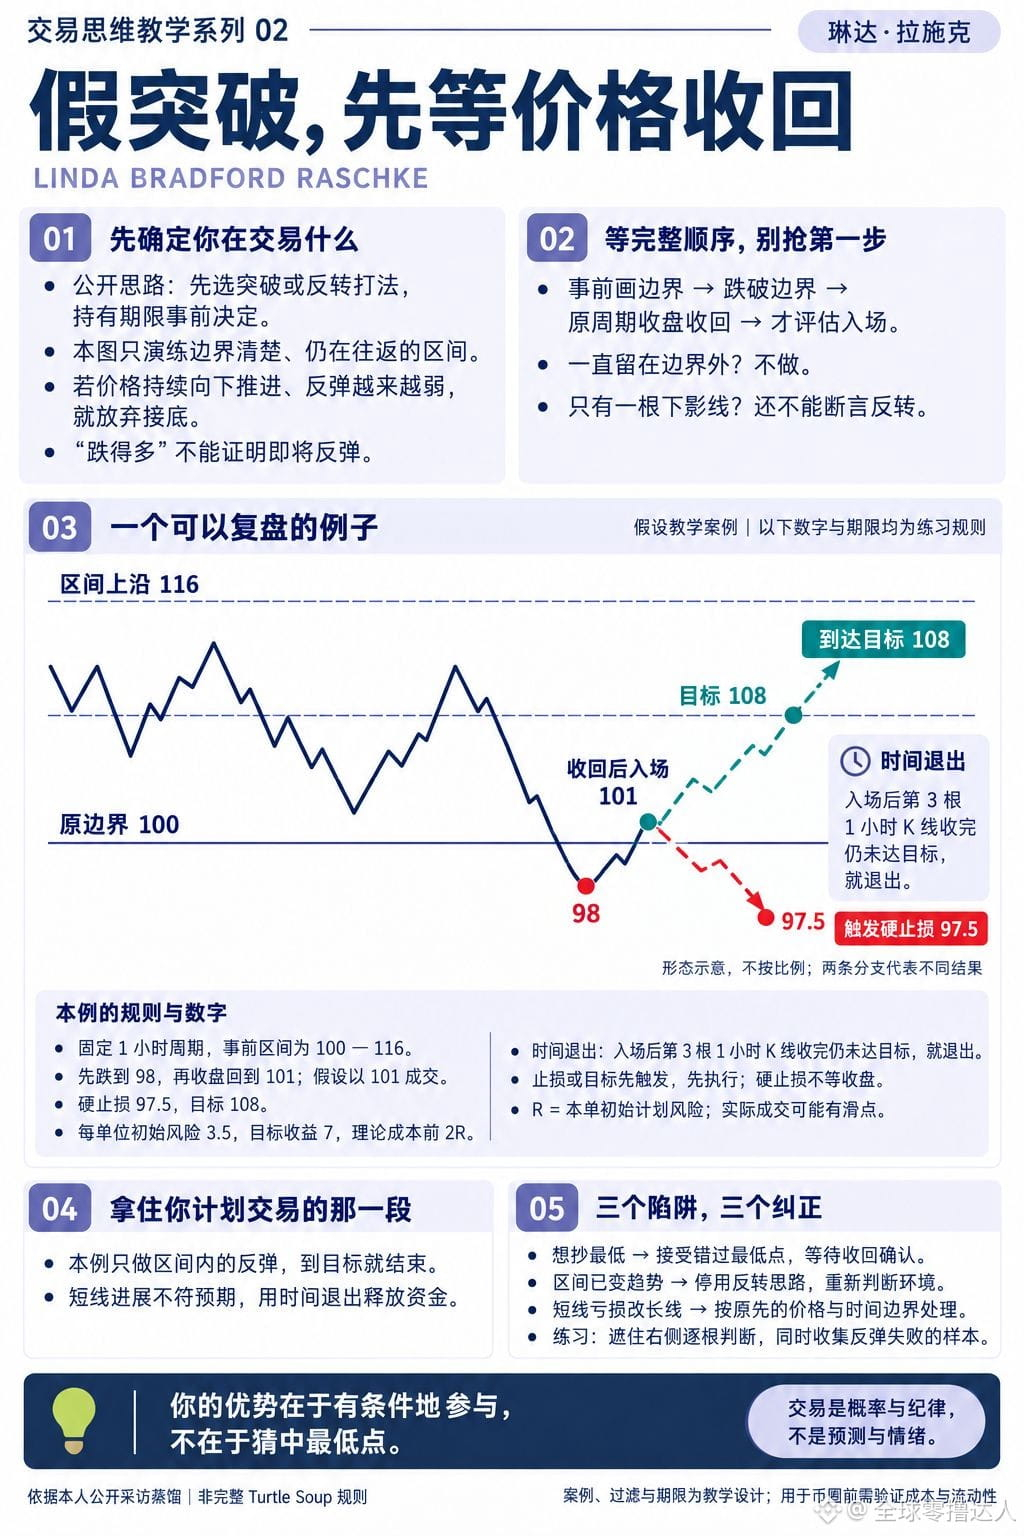
02 Linda Bradford Raschke|Fake Breakout, Wait for Price to Retrace First
LINDA BRADFORD RASCHKE
Core Thinking
First determine whether you’re trading a breakout or a reversal. Before entering, decide on the rationale and the holding period. In this chart exercise, the boundaries are clear and the price is still oscillating within the range.
How to Identify Opportunities
Draw the boundary in advance → price breaks below → the prior cycle closes back in → only then evaluate whether to enter.
Stay outside the boundary at all times; don’t act. If there are only lower wicks, you can’t assert a reversal directly. If price continues pushing lower and the rebounds keep getting weaker, abandon the idea of catching the bottom.
Hypothetical Case: Write Three Exits Together
Set a fixed 1-hour timeframe, with an initial range of 100—116. Price first drops to 98, then closes back to 101; assume entry fills at 101.
- Stop-loss: If it touches 97.5, execute immediately.
- Target exit: At 108, exit according to plan.
- Time-based exit: After entry, if the 3rd subsequent 1-hour candlestick closes and the target hasn’t been reached, exit.
- If the stop-loss or the target triggers first, execute first; a hard stop-loss does not wait for the close.
Initial risk per unit is 3.5, target reward is 7, theoretical cost is the first 2R. Actual fills may include slippage. If price never closes back above 100, you are not eligible to enter at any point.
The Easiest Trap to Fall Into
Trying to buy the lowest; reversing immediately after a stop; the range has already turned into a trend, yet you keep guessing bottoms; your short-term progress isn’t what you expected, so you keep extending the position indefinitely.
Corrective Actions
Accept missing the lowest point in exchange for a confirmed retrace. After stopping out, wait for the full conditions again. In this example, you only hold the rebound within the range—when you hit the target or the time limit, you’re done.
Your advantage is participating conditionally—not guessing the exact lowest point.
Source: Interview with the author’s hosted site, “The Discerning Trader” (https://lindaraschke.net/wp-content/uploads/2026/01/Discerning-trader.pdf) and “The Rituals of Trading” (https://lindaraschke.net/wp-content/uploads/2026/01/rituals.pdf). This is a simplified educational walkthrough of the fake-breakout approach, not a complete Turtle Soup ruleset; the numbers, range filters, and time limits are all designed for teaching.
The following is an instructional distillation of a public method. The numeric example, filtering conditions, and practice duration are teaching design choices and do not represent the trader’s complete system or a unified set of parameters. R refers to the initial planned risk for this round; actual losses may exceed the plan due to slippage and fees.
02 Linda Bradford Raschke|Fake Breakout, Wait for Price to Retrace First
LINDA BRADFORD RASCHKE
Core Thinking
First determine whether you’re trading a breakout or a reversal. Before entering, decide on the rationale and the holding period. In this chart exercise, the boundaries are clear and the price is still oscillating within the range.
How to Identify Opportunities
Draw the boundary in advance → price breaks below → the prior cycle closes back in → only then evaluate whether to enter.
Stay outside the boundary at all times; don’t act. If there are only lower wicks, you can’t assert a reversal directly. If price continues pushing lower and the rebounds keep getting weaker, abandon the idea of catching the bottom.
Hypothetical Case: Write Three Exits Together
Set a fixed 1-hour timeframe, with an initial range of 100—116. Price first drops to 98, then closes back to 101; assume entry fills at 101.
- Stop-loss: If it touches 97.5, execute immediately.
- Target exit: At 108, exit according to plan.
- Time-based exit: After entry, if the 3rd subsequent 1-hour candlestick closes and the target hasn’t been reached, exit.
- If the stop-loss or the target triggers first, execute first; a hard stop-loss does not wait for the close.
Initial risk per unit is 3.5, target reward is 7, theoretical cost is the first 2R. Actual fills may include slippage. If price never closes back above 100, you are not eligible to enter at any point.
The Easiest Trap to Fall Into
Trying to buy the lowest; reversing immediately after a stop; the range has already turned into a trend, yet you keep guessing bottoms; your short-term progress isn’t what you expected, so you keep extending the position indefinitely.
Corrective Actions
Accept missing the lowest point in exchange for a confirmed retrace. After stopping out, wait for the full conditions again. In this example, you only hold the rebound within the range—when you hit the target or the time limit, you’re done.
Your advantage is participating conditionally—not guessing the exact lowest point.
Source: Interview with the author’s hosted site, “The Discerning Trader” (https://lindaraschke.net/wp-content/uploads/2026/01/Discerning-trader.pdf) and “The Rituals of Trading” (https://lindaraschke.net/wp-content/uploads/2026/01/rituals.pdf). This is a simplified educational walkthrough of the fake-breakout approach, not a complete Turtle Soup ruleset; the numbers, range filters, and time limits are all designed for teaching.
The following is an instructional distillation of a public method. The numeric example, filtering conditions, and practice duration are teaching design choices and do not represent the trader’s complete system or a unified set of parameters. R refers to the initial planned risk for this round; actual losses may exceed the plan due to slippage and fees.
LINDA BRADFORD RASCHKE
Core Thinking
First determine whether you’re trading a breakout or a reversal. Before entering, decide on the rationale and the holding period. In this chart exercise, the boundaries are clear and the price is still oscillating within the range.
How to Identify Opportunities
Draw the boundary in advance → price breaks below → the prior cycle closes back in → only then evaluate whether to enter.
Stay outside the boundary at all times; don’t act. If there are only lower wicks, you can’t assert a reversal directly. If price continues pushing lower and the rebounds keep getting weaker, abandon the idea of catching the bottom.
Hypothetical Case: Write Three Exits Together
Set a fixed 1-hour timeframe, with an initial range of 100—116. Price first drops to 98, then closes back to 101; assume entry fills at 101.
- Stop-loss: If it touches 97.5, execute immediately.
- Target exit: At 108, exit according to plan.
- Time-based exit: After entry, if the 3rd subsequent 1-hour candlestick closes and the target hasn’t been reached, exit.
- If the stop-loss or the target triggers first, execute first; a hard stop-loss does not wait for the close.
Initial risk per unit is 3.5, target reward is 7, theoretical cost is the first 2R. Actual fills may include slippage. If price never closes back above 100, you are not eligible to enter at any point.
The Easiest Trap to Fall Into
Trying to buy the lowest; reversing immediately after a stop; the range has already turned into a trend, yet you keep guessing bottoms; your short-term progress isn’t what you expected, so you keep extending the position indefinitely.
Corrective Actions
Accept missing the lowest point in exchange for a confirmed retrace. After stopping out, wait for the full conditions again. In this example, you only hold the rebound within the range—when you hit the target or the time limit, you’re done.
Your advantage is participating conditionally—not guessing the exact lowest point.
Source: Interview with the author’s hosted site, “The Discerning Trader” (https://lindaraschke.net/wp-content/uploads/2026/01/Discerning-trader.pdf) and “The Rituals of Trading” (https://lindaraschke.net/wp-content/uploads/2026/01/rituals.pdf). This is a simplified educational walkthrough of the fake-breakout approach, not a complete Turtle Soup ruleset; the numbers, range filters, and time limits are all designed for teaching.
The following is an instructional distillation of a public method. The numeric example, filtering conditions, and practice duration are teaching design choices and do not represent the trader’s complete system or a unified set of parameters. R refers to the initial planned risk for this round; actual losses may exceed the plan due to slippage and fees.
2
225
·
--
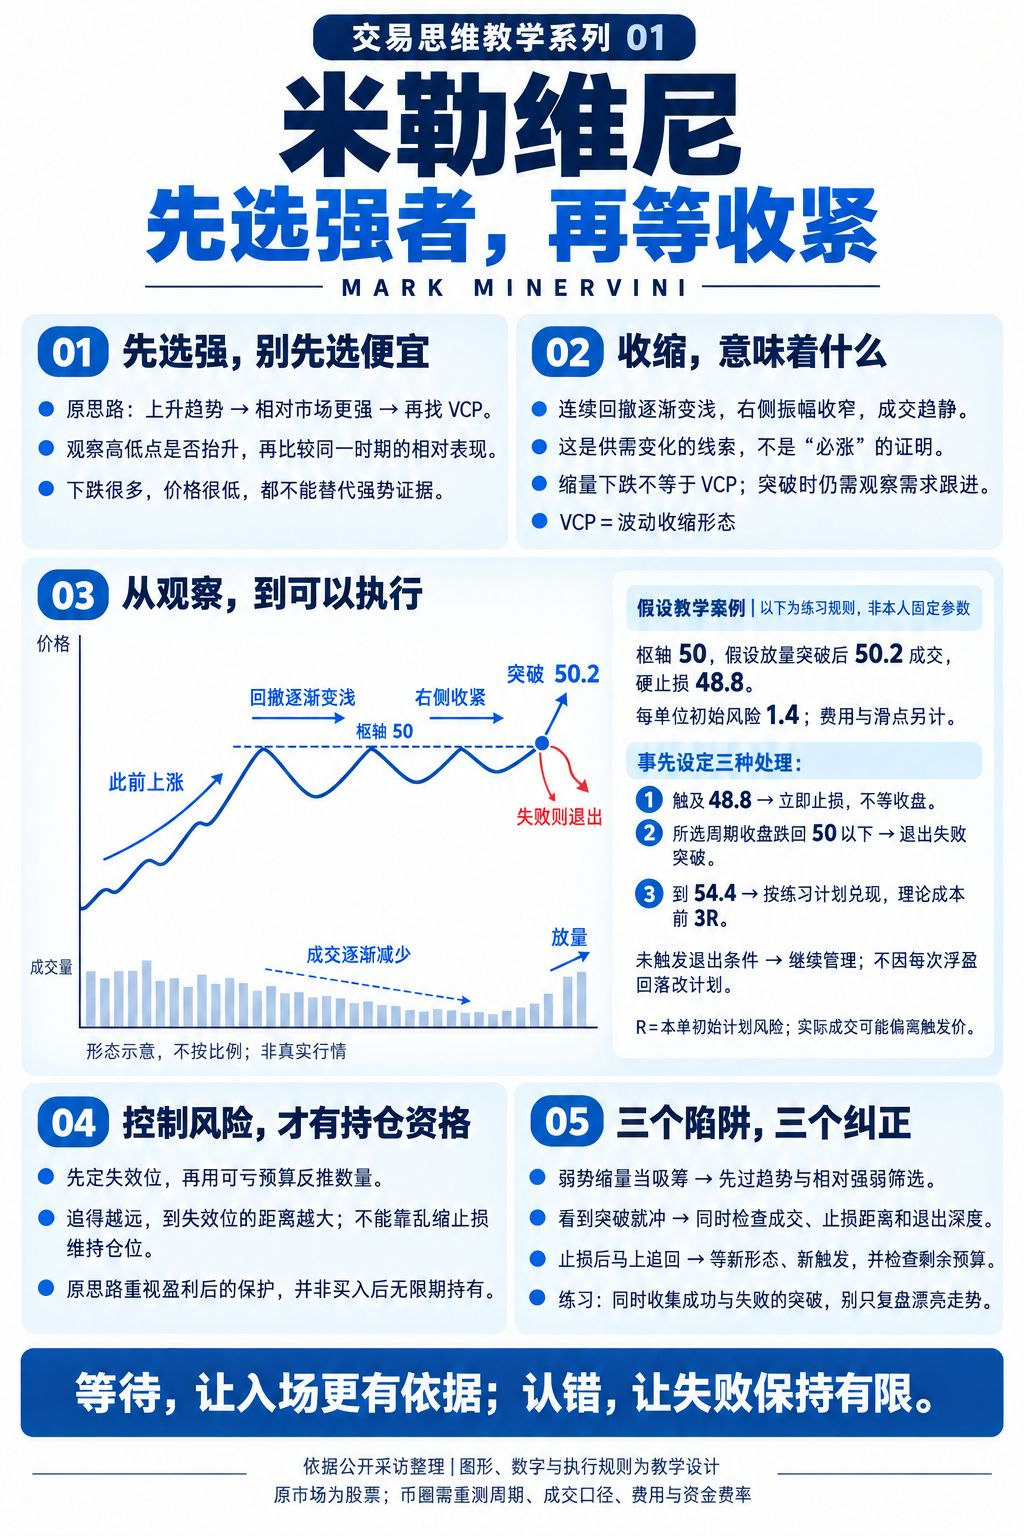
01 Miller Vinny|First pick the stronger one, then wait for the tightening
MARK MINERVINI
Core thinking
First confirm the uptrend, then find issues that are relatively stronger than the broader market, and finally wait for volatility to contract and break out. Low price and percentage drop cannot substitute for evidence of strength.
How to identify opportunities
1. Check whether highs and lows are rising, and compare relative performance in the same period.
2. Look for whether successive pullbacks are gradually getting shallower, whether the amplitude on the right side is tightening, and whether volume is becoming quieter.
3. Mark in advance the top of the final consolidation area and the invalidation level.
4. When a breakout occurs, observe whether there is follow-through demand; only assess execution after confirming the stop-loss distance and the budget are suitable.
VCP is a volatility contraction pattern. Falling on declining volume is not the same as a VCP; contraction also does not guarantee an upside breakout.
Hypothetical case: how to enter, and how to manage
Pivot 50. Assume that after a breakout on volume, the trade at 50.2 occurs, with a hard stop at 48.8. Initial risk per unit is 1.4.
Before opening the position, fix the management timeframe and agree:
- If, during the session, it touches 48.8: execute the stop loss immediately; do not wait for the close.
- If the chosen period’s close falls back below 50: exit as the breakout has failed.
- If it reaches 54.4: realize profits according to the practice plan, with theoretical cost of the first 3R.
- If none of the above conditions is triggered: continue managing; do not change the plan just because floating gains pull back each time.
These are practice rules, not the take-profit/stop-loss parameters Miller Vinervini fixedly uses. Trigger prices do not guarantee the fill prices.
The easiest traps to fall into
Weakness on declining volume as “accumulation”; chasing too far after a breakout; using an overly wide stop loss to buy more; and after a failure, turning a short-term trade into a long-term position.
Corrective actions
First filter by trend and relative strength, then decide whether to study the pattern. First set the invalidation level, then use the “maximum you can lose” budget to back-calculate the quantity you can take. Also review both successful and failed breakouts—don’t only save the pretty charts.
Wait, so there is more basis for entry; admit mistakes, so the failure remains limited.
Source: Michael Sincere’s public interview with Minervini (https://michaelsincere.com/articles/my-marketwatch-interview-with-stock-market-wizard-mark-minervini). The original experience mainly comes from stocks; using it for crypto requires re-testing the timeframe, trade volume conventions, liquidity, and fees.
The following is a teaching distillation of the public methods. The numerical examples, filtering conditions, and practice time limits are instructional designs and do not represent the trader’s complete personal system or unified parameters. R refers to the initial planned risk for this trade; actual losses may exceed the plan due to slippage and fees.
01 Miller Vinny|First pick the stronger one, then wait for the tightening
MARK MINERVINI
Core thinking
First confirm the uptrend, then find issues that are relatively stronger than the broader market, and finally wait for volatility to contract and break out. Low price and percentage drop cannot substitute for evidence of strength.
How to identify opportunities
1. Check whether highs and lows are rising, and compare relative performance in the same period.
2. Look for whether successive pullbacks are gradually getting shallower, whether the amplitude on the right side is tightening, and whether volume is becoming quieter.
3. Mark in advance the top of the final consolidation area and the invalidation level.
4. When a breakout occurs, observe whether there is follow-through demand; only assess execution after confirming the stop-loss distance and the budget are suitable.
VCP is a volatility contraction pattern. Falling on declining volume is not the same as a VCP; contraction also does not guarantee an upside breakout.
Hypothetical case: how to enter, and how to manage
Pivot 50. Assume that after a breakout on volume, the trade at 50.2 occurs, with a hard stop at 48.8. Initial risk per unit is 1.4.
Before opening the position, fix the management timeframe and agree:
- If, during the session, it touches 48.8: execute the stop loss immediately; do not wait for the close.
- If the chosen period’s close falls back below 50: exit as the breakout has failed.
- If it reaches 54.4: realize profits according to the practice plan, with theoretical cost of the first 3R.
- If none of the above conditions is triggered: continue managing; do not change the plan just because floating gains pull back each time.
These are practice rules, not the take-profit/stop-loss parameters Miller Vinervini fixedly uses. Trigger prices do not guarantee the fill prices.
The easiest traps to fall into
Weakness on declining volume as “accumulation”; chasing too far after a breakout; using an overly wide stop loss to buy more; and after a failure, turning a short-term trade into a long-term position.
Corrective actions
First filter by trend and relative strength, then decide whether to study the pattern. First set the invalidation level, then use the “maximum you can lose” budget to back-calculate the quantity you can take. Also review both successful and failed breakouts—don’t only save the pretty charts.
Wait, so there is more basis for entry; admit mistakes, so the failure remains limited.
Source: Michael Sincere’s public interview with Minervini (https://michaelsincere.com/articles/my-marketwatch-interview-with-stock-market-wizard-mark-minervini). The original experience mainly comes from stocks; using it for crypto requires re-testing the timeframe, trade volume conventions, liquidity, and fees.
The following is a teaching distillation of the public methods. The numerical examples, filtering conditions, and practice time limits are instructional designs and do not represent the trader’s complete personal system or unified parameters. R refers to the initial planned risk for this trade; actual losses may exceed the plan due to slippage and fees.
MARK MINERVINI
Core thinking
First confirm the uptrend, then find issues that are relatively stronger than the broader market, and finally wait for volatility to contract and break out. Low price and percentage drop cannot substitute for evidence of strength.
How to identify opportunities
1. Check whether highs and lows are rising, and compare relative performance in the same period.
2. Look for whether successive pullbacks are gradually getting shallower, whether the amplitude on the right side is tightening, and whether volume is becoming quieter.
3. Mark in advance the top of the final consolidation area and the invalidation level.
4. When a breakout occurs, observe whether there is follow-through demand; only assess execution after confirming the stop-loss distance and the budget are suitable.
VCP is a volatility contraction pattern. Falling on declining volume is not the same as a VCP; contraction also does not guarantee an upside breakout.
Hypothetical case: how to enter, and how to manage
Pivot 50. Assume that after a breakout on volume, the trade at 50.2 occurs, with a hard stop at 48.8. Initial risk per unit is 1.4.
Before opening the position, fix the management timeframe and agree:
- If, during the session, it touches 48.8: execute the stop loss immediately; do not wait for the close.
- If the chosen period’s close falls back below 50: exit as the breakout has failed.
- If it reaches 54.4: realize profits according to the practice plan, with theoretical cost of the first 3R.
- If none of the above conditions is triggered: continue managing; do not change the plan just because floating gains pull back each time.
These are practice rules, not the take-profit/stop-loss parameters Miller Vinervini fixedly uses. Trigger prices do not guarantee the fill prices.
The easiest traps to fall into
Weakness on declining volume as “accumulation”; chasing too far after a breakout; using an overly wide stop loss to buy more; and after a failure, turning a short-term trade into a long-term position.
Corrective actions
First filter by trend and relative strength, then decide whether to study the pattern. First set the invalidation level, then use the “maximum you can lose” budget to back-calculate the quantity you can take. Also review both successful and failed breakouts—don’t only save the pretty charts.
Wait, so there is more basis for entry; admit mistakes, so the failure remains limited.
Source: Michael Sincere’s public interview with Minervini (https://michaelsincere.com/articles/my-marketwatch-interview-with-stock-market-wizard-mark-minervini). The original experience mainly comes from stocks; using it for crypto requires re-testing the timeframe, trade volume conventions, liquidity, and fees.
The following is a teaching distillation of the public methods. The numerical examples, filtering conditions, and practice time limits are instructional designs and do not represent the trader’s complete personal system or unified parameters. R refers to the initial planned risk for this trade; actual losses may exceed the plan due to slippage and fees.
4
224
·
--
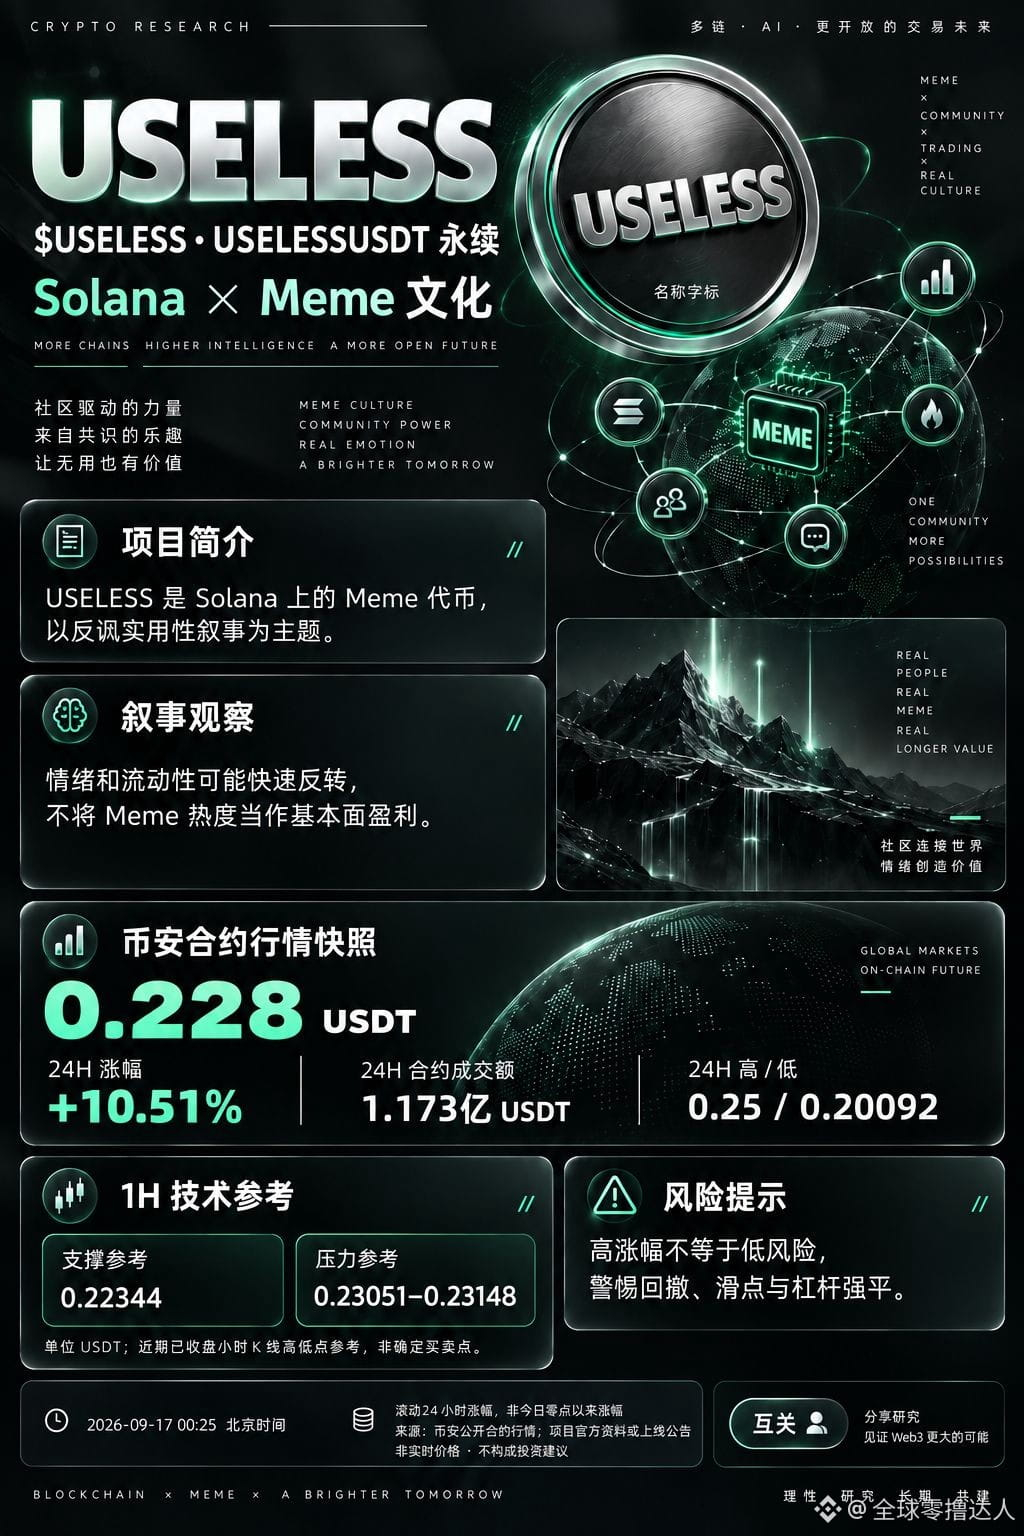
$USELESS sarcastic culture gathers attention—whether Meme hype can last remains to be seen. Snapshot at 00:25 on September 17, 24-hour increase: +10.51%. A high rise doesn’t mean low risk—be wary of chasing after pumps. Mutual follows
$USELESS sarcastic culture gathers attention—whether Meme hype can last remains to be seen. Snapshot at 00:25 on September 17, 24-hour increase: +10.51%. A high rise doesn’t mean low risk—be wary of chasing after pumps. Mutual follows
1
279
·
--
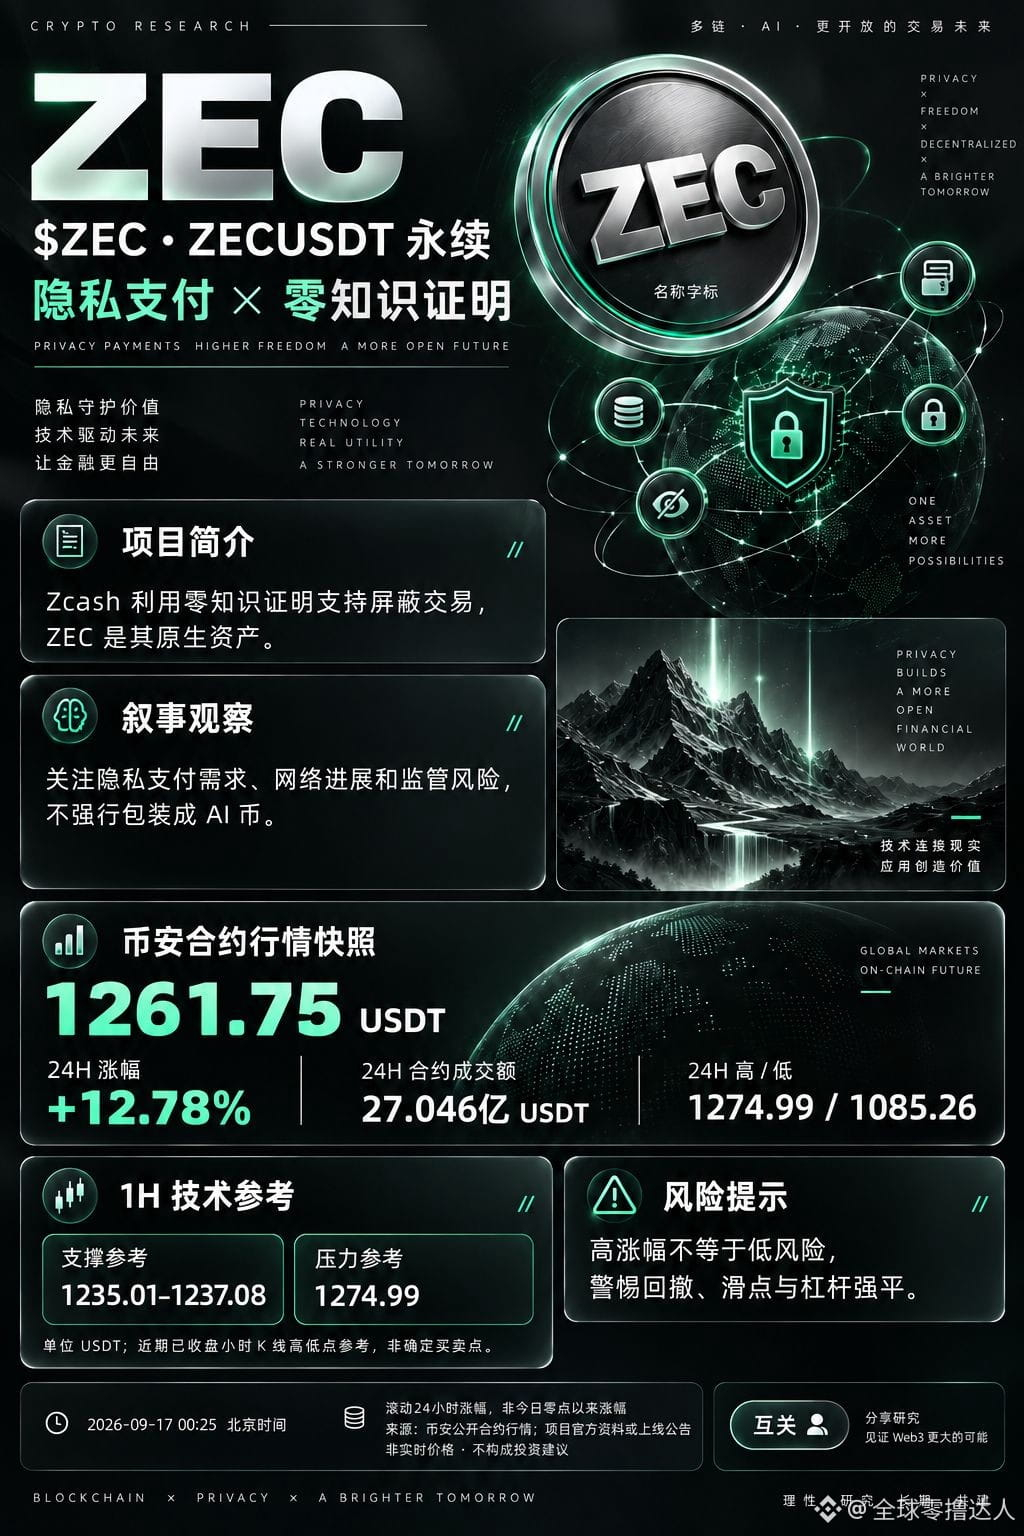
$ZEC privacy payment narratives are receiving attention, while also keeping an eye on regulation and market volatility. 9/17 00:25 snapshot, 24-hour change +12.78%. A high rise does not mean low risk—be wary of chasing after the price. Mutual follow
$ZEC privacy payment narratives are receiving attention, while also keeping an eye on regulation and market volatility. 9/17 00:25 snapshot, 24-hour change +12.78%. A high rise does not mean low risk—be wary of chasing after the price. Mutual follow
1
775
·
--
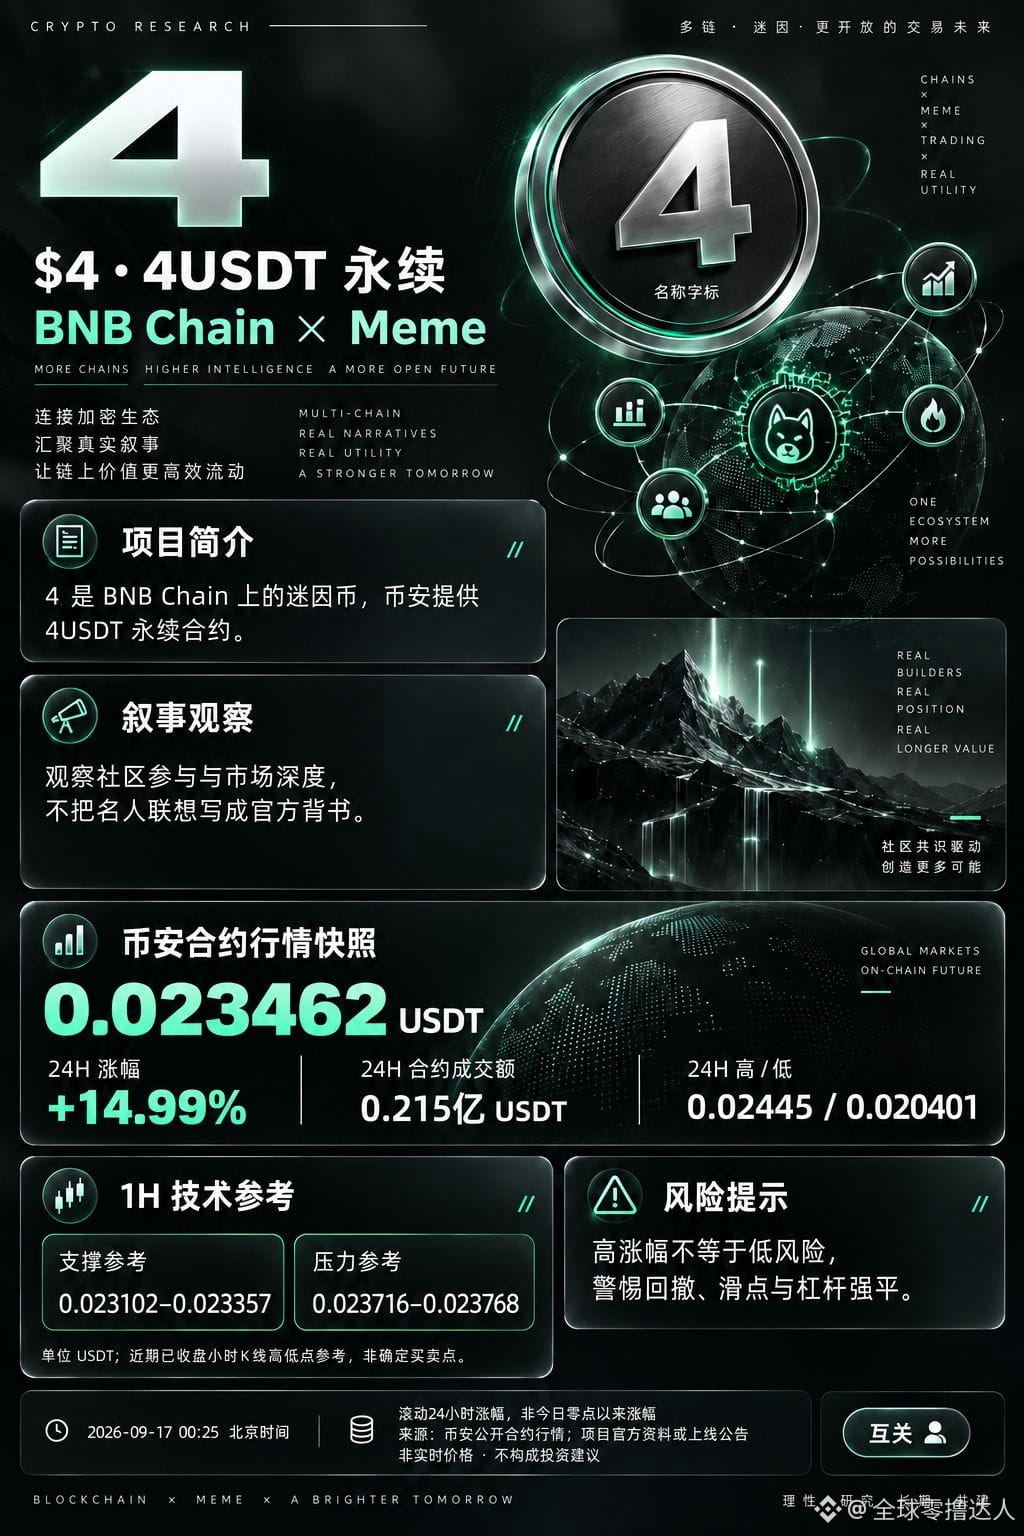
$4 BNB Chain meme market is active, but community buzz doesn’t mean sustained buying pressure. Snapshot at 00:25 on Sept 17, 24-hour increase +14.99%. A high rise doesn’t mean low risk—be alert for chasing the price. Follow each other
$4 BNB Chain meme market is active, but community buzz doesn’t mean sustained buying pressure. Snapshot at 00:25 on Sept 17, 24-hour increase +14.99%. A high rise doesn’t mean low risk—be alert for chasing the price. Follow each other
611
·
--
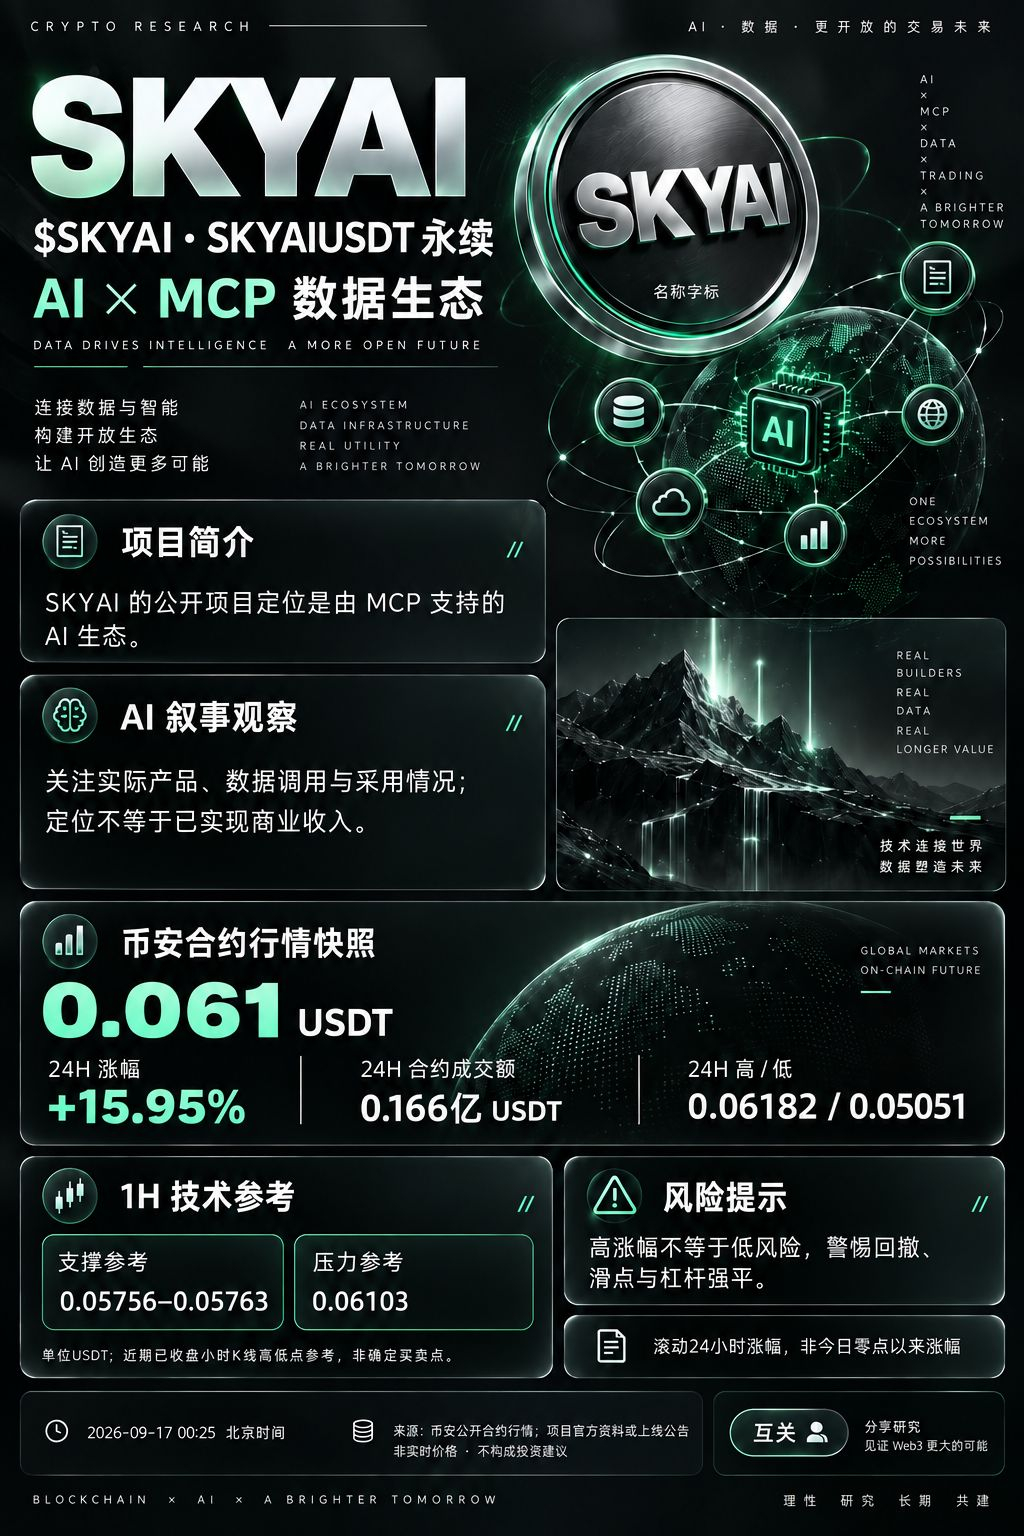
$SKYAI AI + MCP narrative is worth tracking—product implementation and real usage are the real focus. Snapshot at 00:25 on September 17, 24-hour increase: +15.95%. A high rise doesn’t mean low risk—be wary of chasing the price. Follow each other
$SKYAI AI + MCP narrative is worth tracking—product implementation and real usage are the real focus. Snapshot at 00:25 on September 17, 24-hour increase: +15.95%. A high rise doesn’t mean low risk—be wary of chasing the price. Follow each other
326
·
--
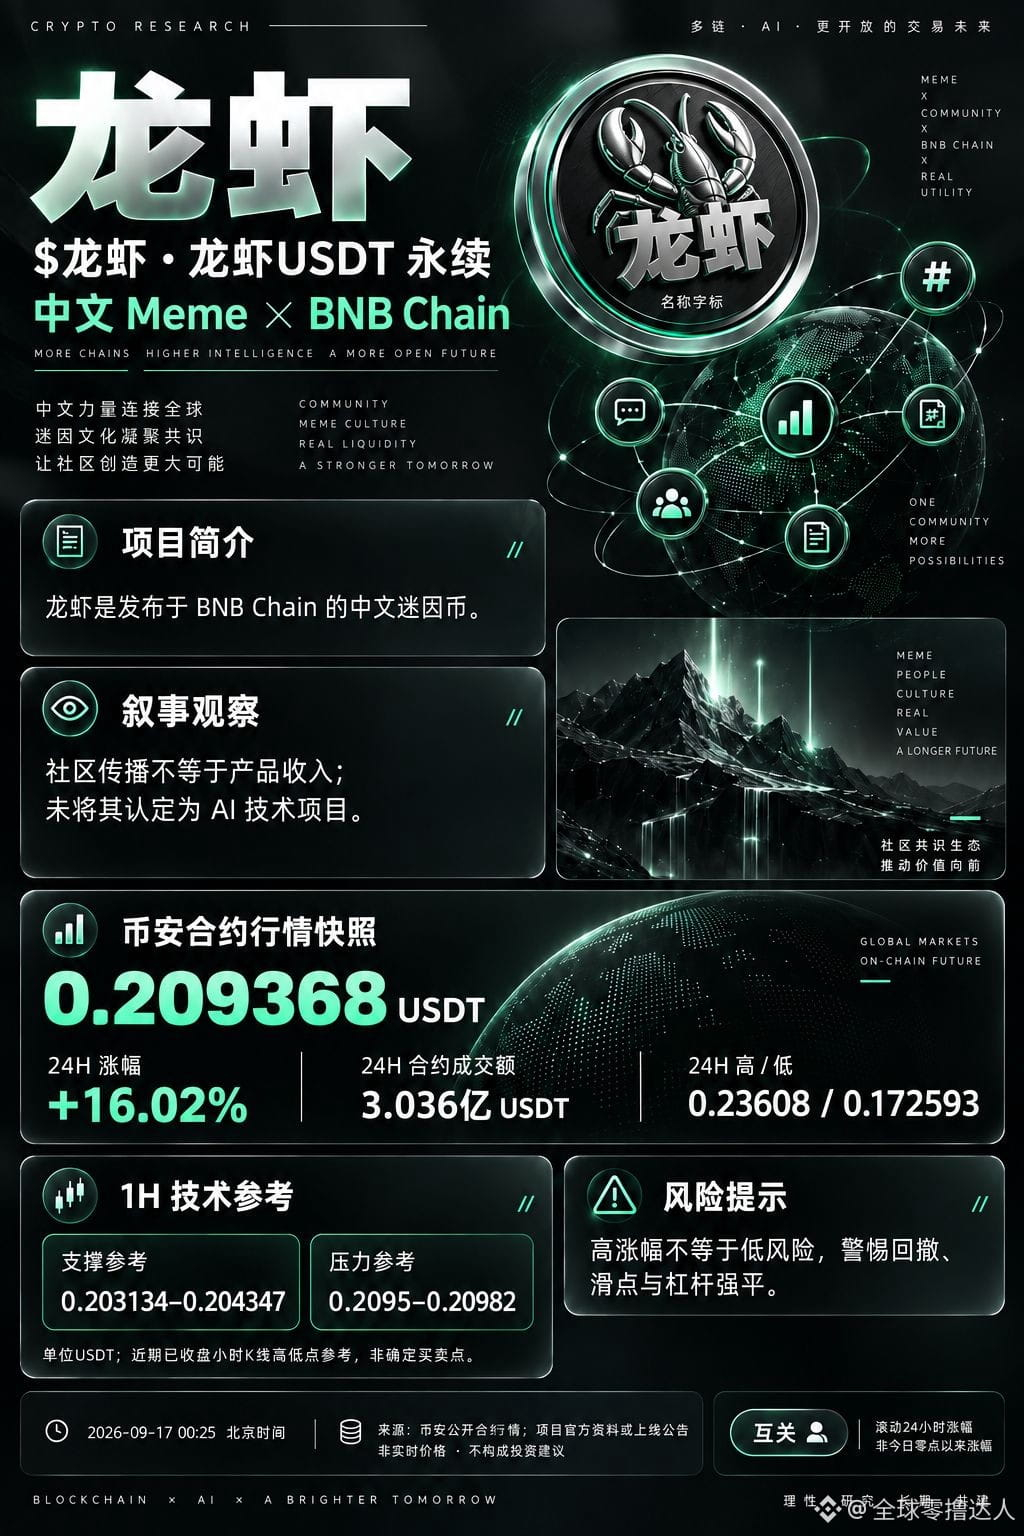
$Lobster Chinese Meme heat rising, pay attention to market depth and concentrated risk of holdings. September 17 00:25 snapshot, 24-hour increase +16.02%. A high surge does not mean low risk—be wary of chasing after it. Follow each other
$Lobster Chinese Meme heat rising, pay attention to market depth and concentrated risk of holdings. September 17 00:25 snapshot, 24-hour increase +16.02%. A high surge does not mean low risk—be wary of chasing after it. Follow each other
1
562
·
--
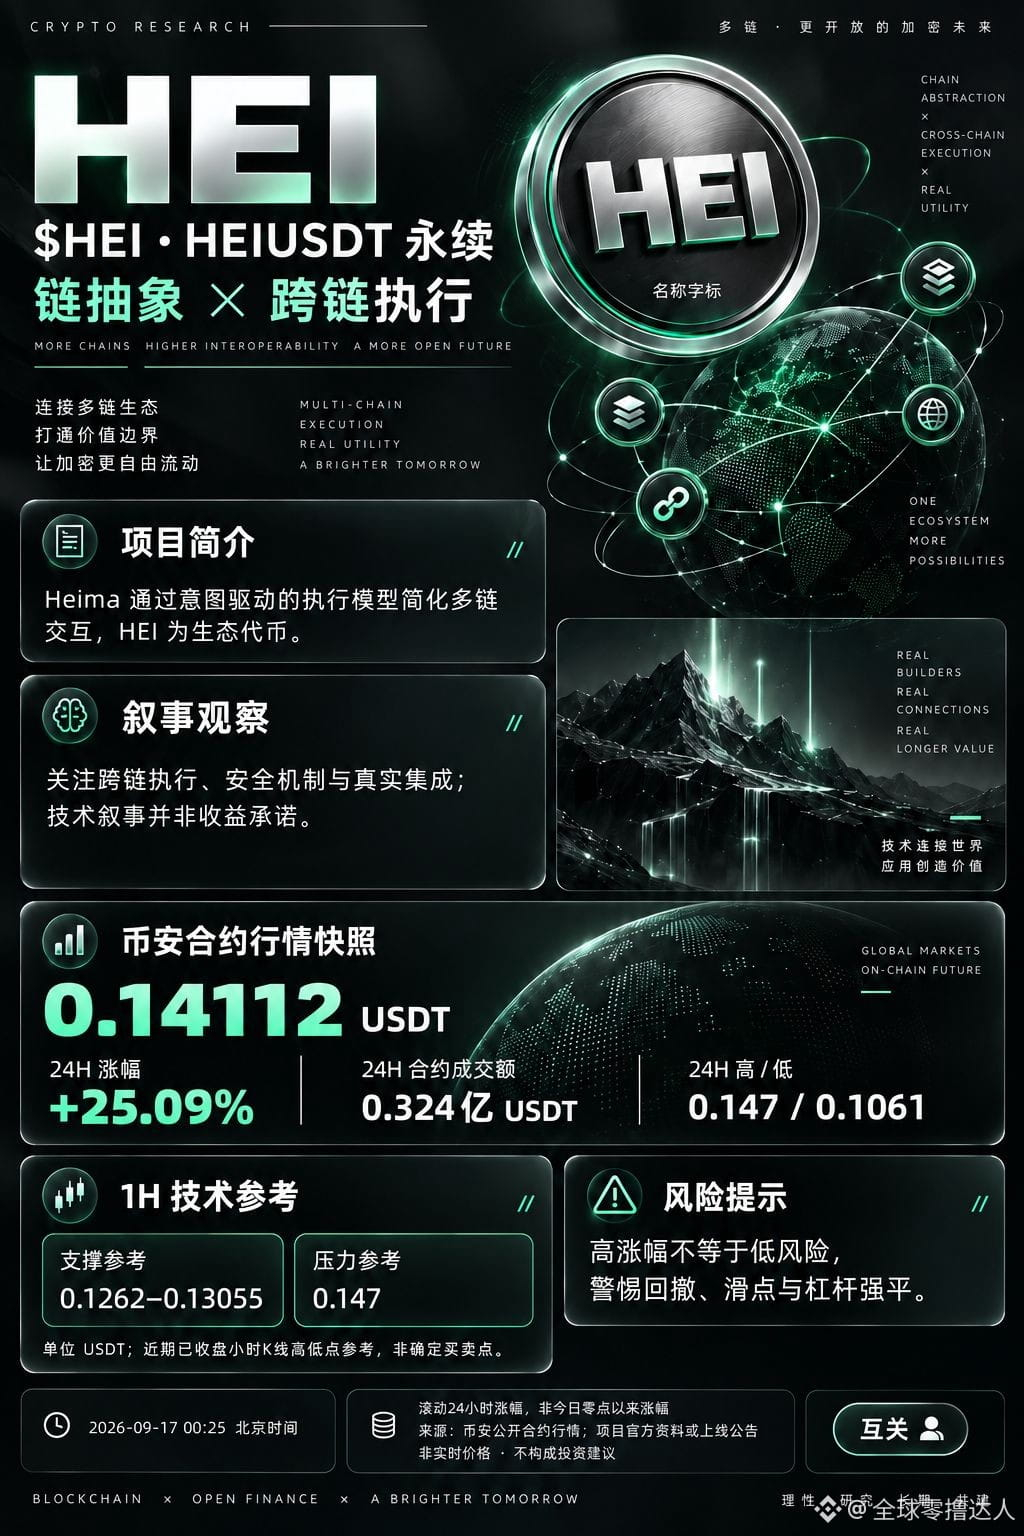
$HEI Chain abstraction makes multi-chain operations simpler. Focus on real integration and usage. Snapshot at 00:25 on September 17, 24-hour gain +25.09%. High gains don’t mean low risk—be wary of chasing price. Follow each other.
$HEI Chain abstraction makes multi-chain operations simpler. Focus on real integration and usage. Snapshot at 00:25 on September 17, 24-hour gain +25.09%. High gains don’t mean low risk—be wary of chasing price. Follow each other.
1
326
·
--
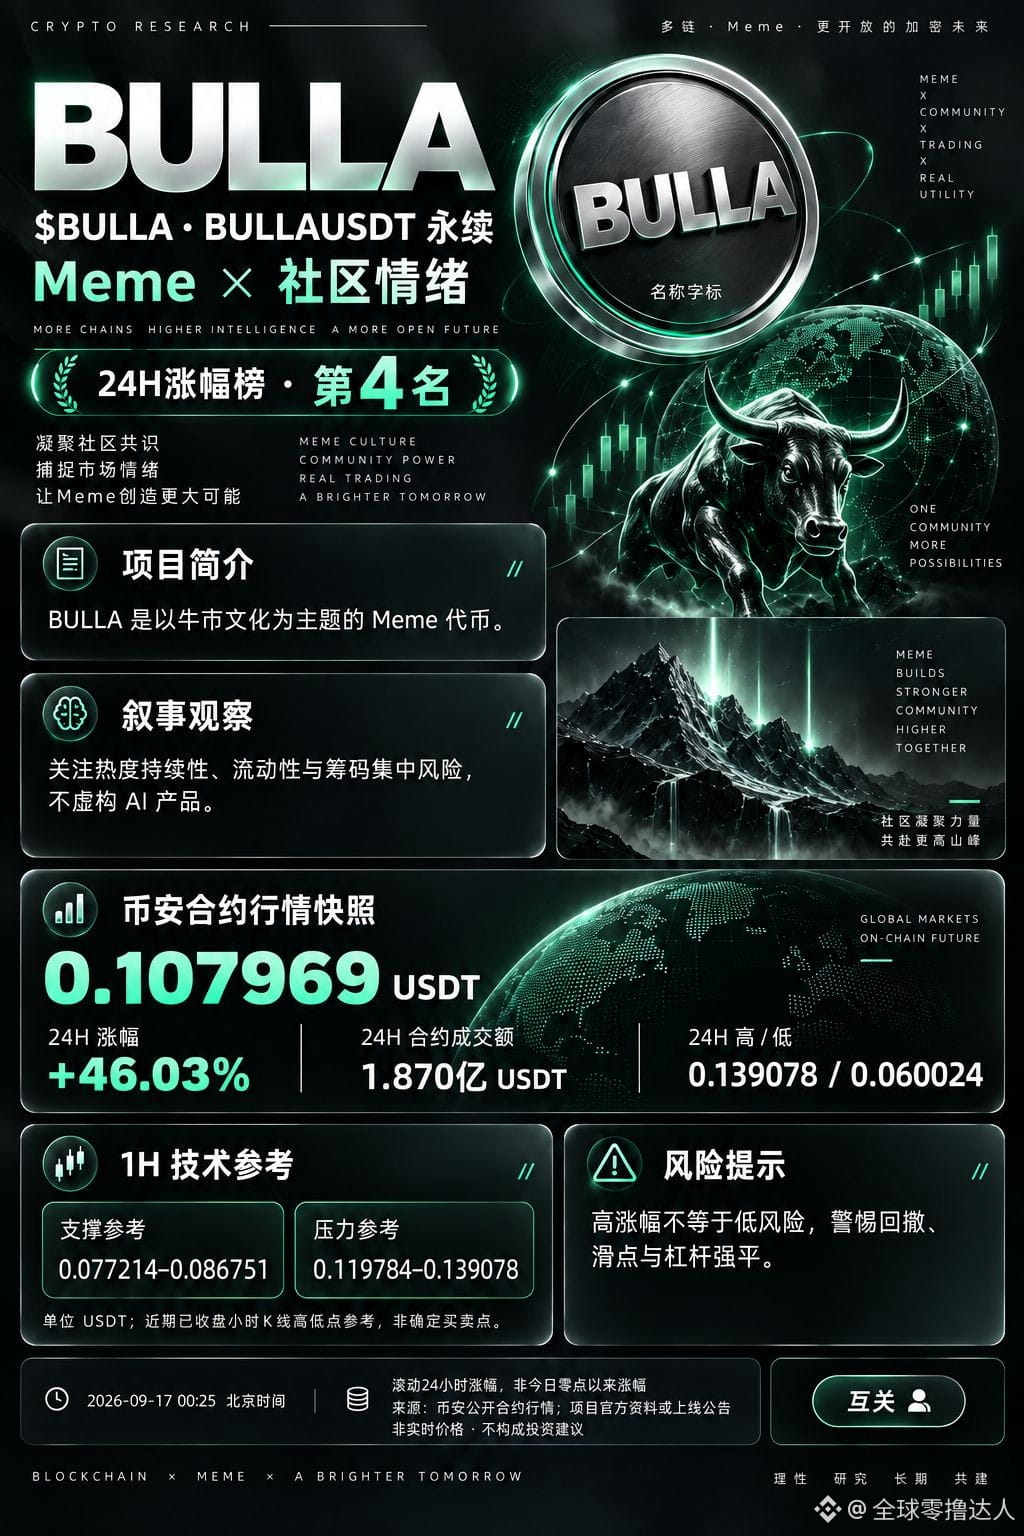
$BULLA Bull market culture drives attention, and Meme sentiment could switch quickly too. Snapshot at 00:25 on September 17, 24-hour gain +46.03%. A high rise doesn’t mean low risk—be cautious about chasing after a spike. Reciprocal follow
$BULLA Bull market culture drives attention, and Meme sentiment could switch quickly too. Snapshot at 00:25 on September 17, 24-hour gain +46.03%. A high rise doesn’t mean low risk—be cautious about chasing after a spike. Reciprocal follow
1
712
·
--
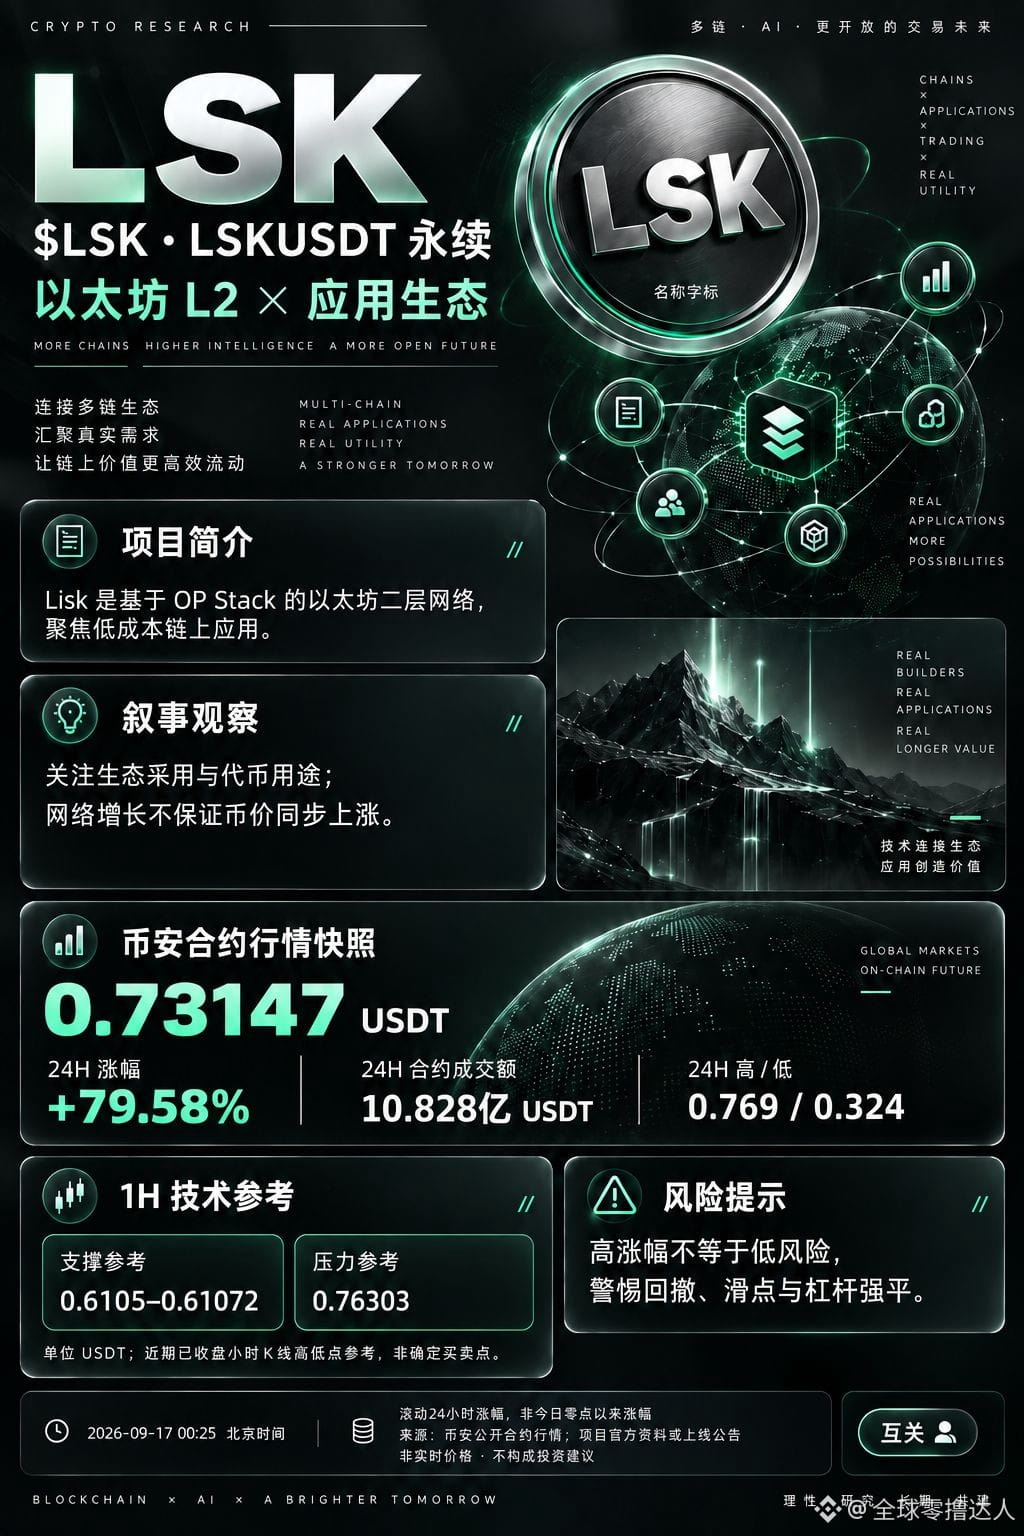
$LSK L2 The market is strengthening. Continue to observe the ecosystem adoption and pullback support. 9/17 00:25 snapshot: 24-hour increase +79.58%. A high rise does not mean low risk—be cautious about chasing gains. Follow each other
$LSK L2 The market is strengthening. Continue to observe the ecosystem adoption and pullback support. 9/17 00:25 snapshot: 24-hour increase +79.58%. A high rise does not mean low risk—be cautious about chasing gains. Follow each other
1
423
·
--
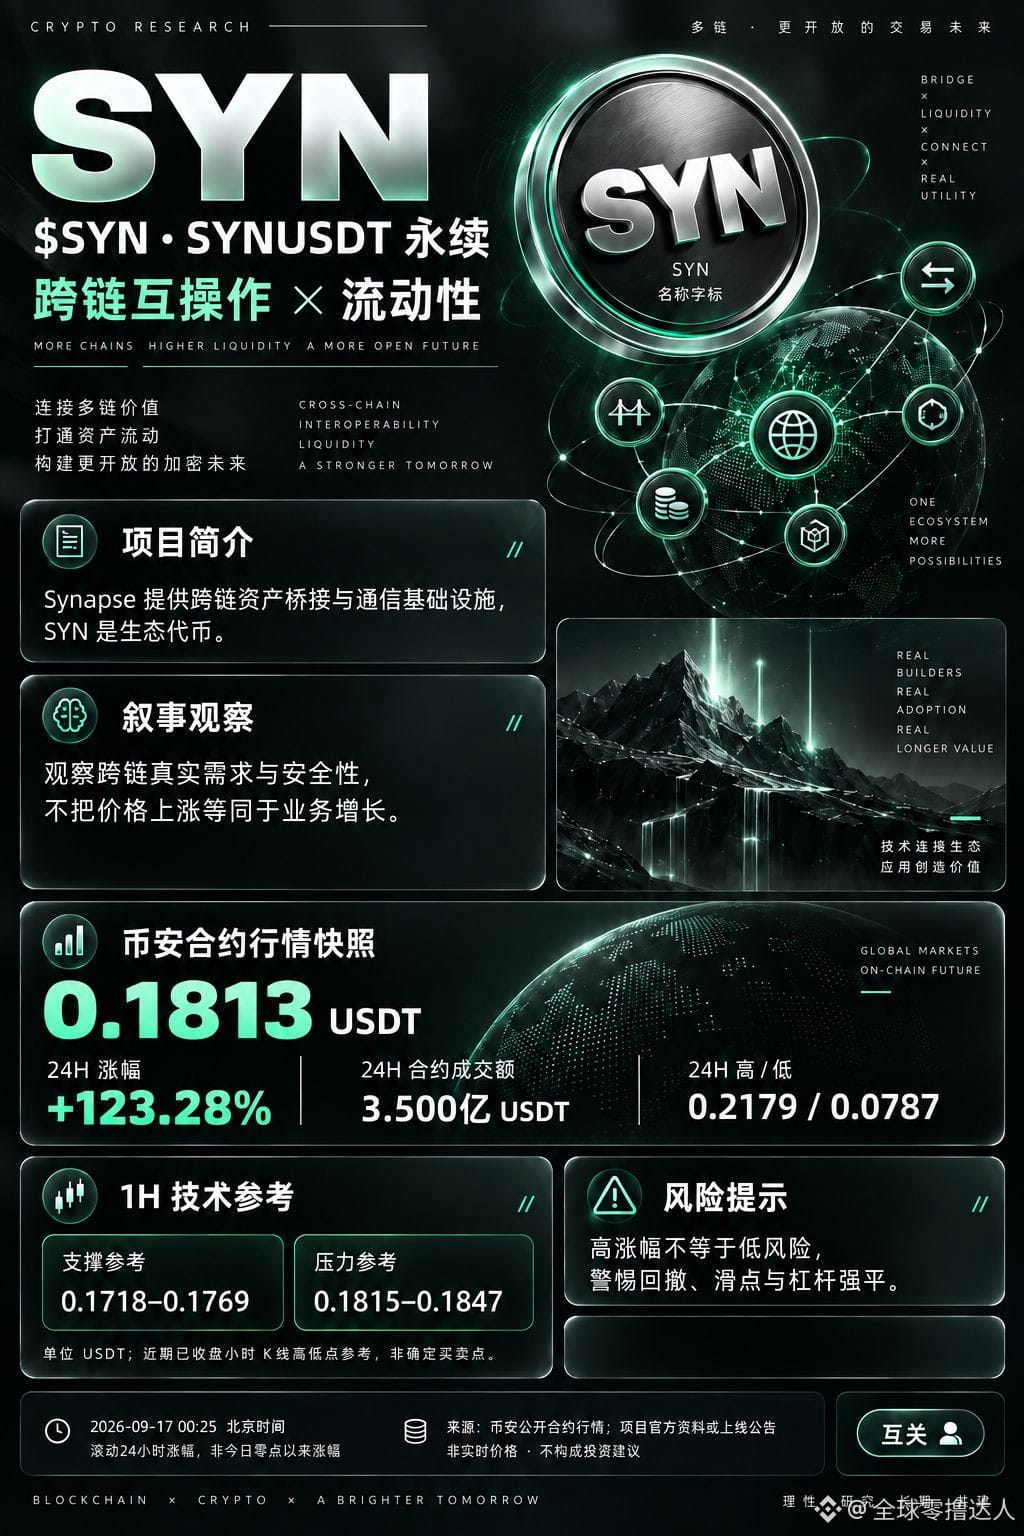
$SYN Cross-chain interest rebounds; real usage demand is more worth tracking than short-term price rallies. Snapshot at 00:25 on September 17, with a 24-hour increase of +123.28%. High returns don’t mean low risk—beware of chasing price. Mutual follow
$SYN Cross-chain interest rebounds; real usage demand is more worth tracking than short-term price rallies. Snapshot at 00:25 on September 17, with a 24-hour increase of +123.28%. High returns don’t mean low risk—beware of chasing price. Mutual follow
1
355
·
--
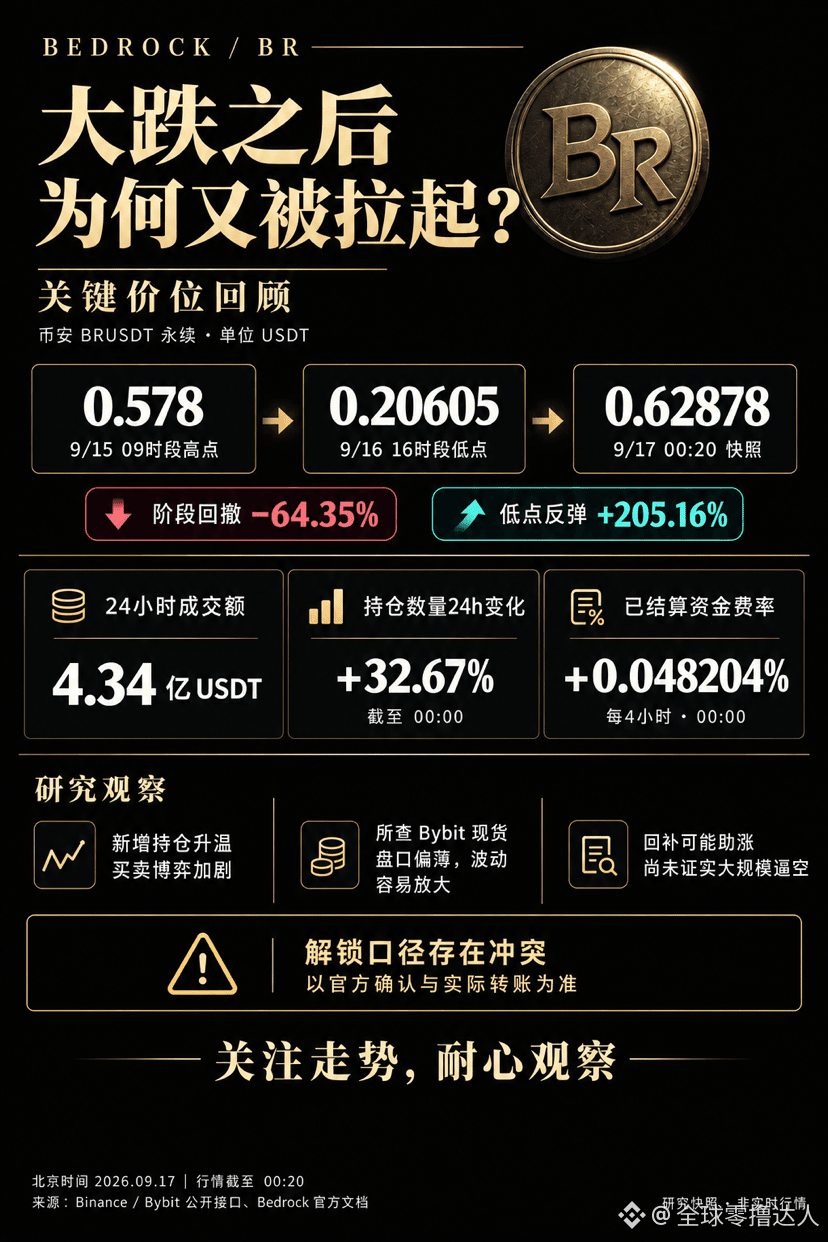
After the BR big drop, why was it quickly pulled back up?
0.578 → 0.20605 → 0.62878 USDT: first it retraced about 64.35%, then rebounded from the low by about 205.16%. This round of price action reflects extreme volatility, and it can’t be simply understood as “it couldn’t fall further.”
As the contract open interest size increased, the spot order book appears relatively thin, and the buy-sell battle remains intense. Short covering may help boost the move, but there’s still no confirmation of a large-scale short squeeze.
The unlock-related information also has conflicting accounts, so you can’t directly treat the unlock date as the day of the sell-off.
Market attention is worth watching—after a sharp rally, stay patient. Focus on the real buy/sell order flow and wait for the price action to provide more confirmation.
Data: Binance BRUSDT perpetual snapshot around 00:20 (Beijing time) on September 17, 2026.
#BR $BR
BR #bedrockoficial #行情观察
{future}(BRUSDT)
After the BR big drop, why was it quickly pulled back up?
0.578 → 0.20605 → 0.62878 USDT: first it retraced about 64.35%, then rebounded from the low by about 205.16%. This round of price action reflects extreme volatility, and it can’t be simply understood as “it couldn’t fall further.”
As the contract open interest size increased, the spot order book appears relatively thin, and the buy-sell battle remains intense. Short covering may help boost the move, but there’s still no confirmation of a large-scale short squeeze.
The unlock-related information also has conflicting accounts, so you can’t directly treat the unlock date as the day of the sell-off.
Market attention is worth watching—after a sharp rally, stay patient. Focus on the real buy/sell order flow and wait for the price action to provide more confirmation.
Data: Binance BRUSDT perpetual snapshot around 00:20 (Beijing time) on September 17, 2026.
#BR $BR
BR #bedrockoficial #行情观察
0.578 → 0.20605 → 0.62878 USDT: first it retraced about 64.35%, then rebounded from the low by about 205.16%. This round of price action reflects extreme volatility, and it can’t be simply understood as “it couldn’t fall further.”
As the contract open interest size increased, the spot order book appears relatively thin, and the buy-sell battle remains intense. Short covering may help boost the move, but there’s still no confirmation of a large-scale short squeeze.
The unlock-related information also has conflicting accounts, so you can’t directly treat the unlock date as the day of the sell-off.
Market attention is worth watching—after a sharp rally, stay patient. Focus on the real buy/sell order flow and wait for the price action to provide more confirmation.
Data: Binance BRUSDT perpetual snapshot around 00:20 (Beijing time) on September 17, 2026.
#BR $BR
BR #bedrockoficial #行情观察
707
3
39
707
·
--
$BR BTCFi narrative heats up—more importantly, look at where the returns come from and the protocol’s security. Snapshot at 00:25 on September 17: 24-hour gain +131.13%. High returns don’t mean low risk—be wary of chasing pumps. Mutual follows
$BR BTCFi narrative heats up—more importantly, look at where the returns come from and the protocol’s security. Snapshot at 00:25 on September 17: 24-hour gain +131.13%. High returns don’t mean low risk—be wary of chasing pumps. Mutual follows

2
521
Log in to explore more content
Join global crypto users on Binance Square
⚡️ Get latest and useful information about crypto.
💬 Trusted by the world’s largest crypto exchange.
👍 Discover real insights from verified creators.
Email / Phone number
Trending Topics
FedRateWatch
1.6M views
7,011 Discussing
Share & Win Traffic Reward in our Trending Hashtag Campaign
✨Topic: FOMC September, What's The Fed's Next Move?
👉How to Join:
Publish a short post or article with hashtag #FedRateWatch
Create content based on the below angles:
- August core CPI rose 0.3% month-over-month, and the odds of a 25bp hike this week are now close to 90%. Do you anticipate a rate hike this week? Is it a one-off, or the start of a longer hiking cycle?
- If the hike lands, how does it play out for BTC, tech stocks, and gold? Bullish or bearish?
- How are you planning to trade next? Share your BTC, stocks or gold trade/holdings with our trade sharing widget.
⏰Campaign Period:
- 2026-09-15 11:00 - 2026-09-17 3:00 UTC
🎁Reward:
- Qualified posts that comply with the above guidelines and contain more than 100 words will be reviewed and may receive a random traffic boost of 500 to 3,000 views. You will receive a notification from your feed secretary if your post is selected.
- Get a chance to have your article featured on Binance Square Official
Need ideas for your post? Visit the topic page #FedRateWatch or the Square Guide on How to Post for Better Reach.
Binance Square Official
·662 Likes
·1.7M views
ZcashRises6%
74,554 views
768 Discussing
XRPSinks10%
47,679 views
507 Discussing