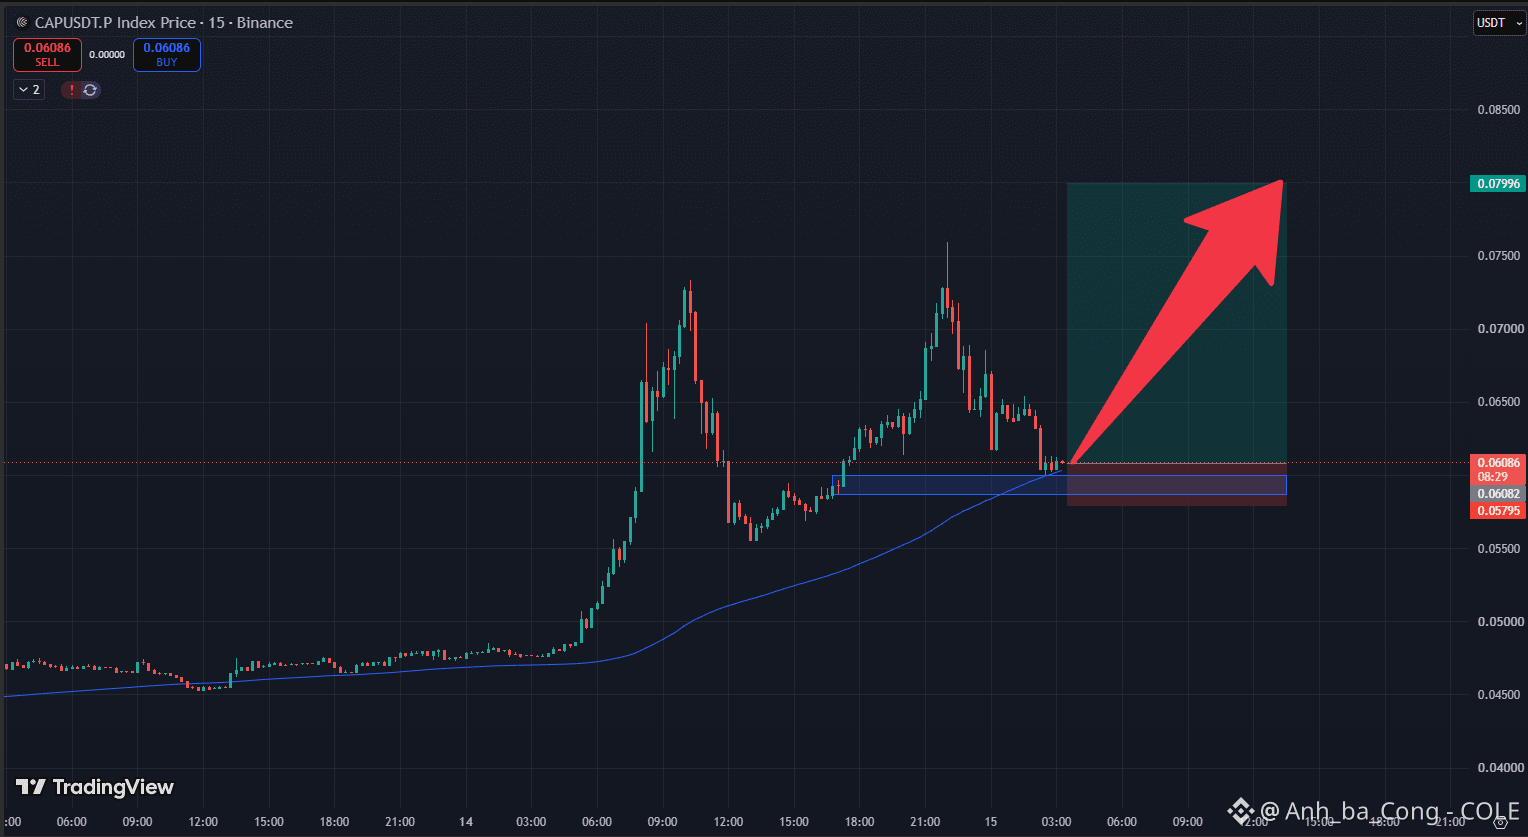
The CAP 15m chart confirms an intact bullish structure of ascending highs and lows as price action pulls back cleanly to the dynamic MA100 trendline near $0.0608. Strong lower-wick absorption over the horizontal demand shelf indicates that buyers have neutralized short-term selling pressure to maintain trend dominance. The optimal approach is to execute a trend-continuation Long near $0.0608 with a tight protective stop-loss parameter below $0.0579, targeting the $0.0799–$0.0800 overhead expansion ceiling. $CAP $AIN $ACE

Post

--Bullish
Disclaimer: Includes third-party opinions. No advice. Binance AI may be used without guarantee. See T&Cs.