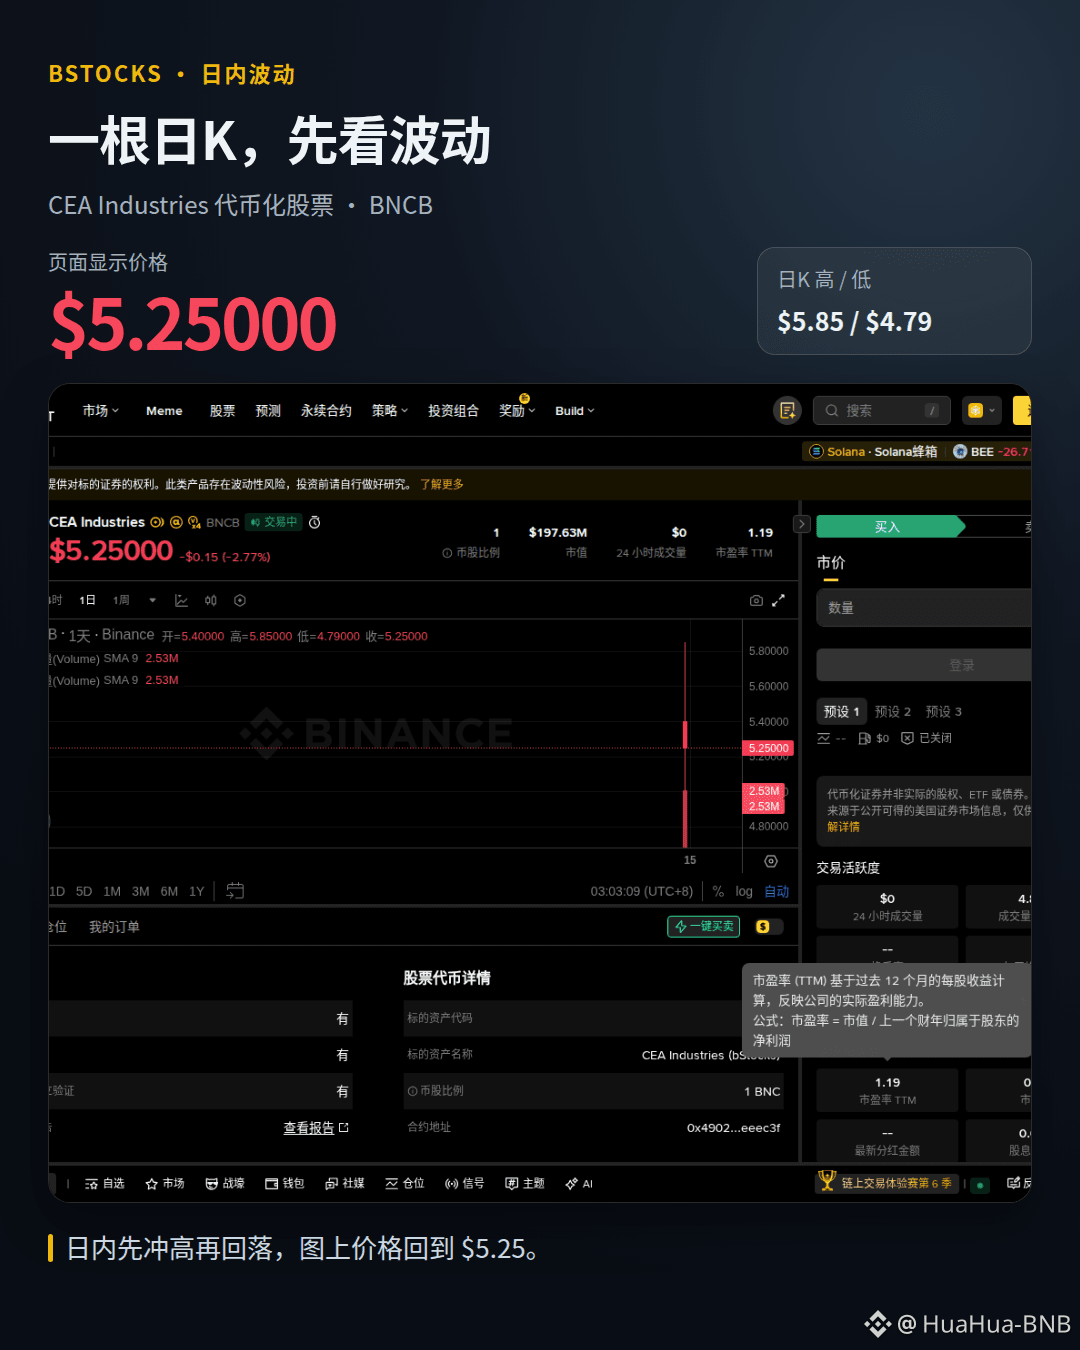

$BNCB Today this daily candlestick is a bit eye-catching: the page shows a move from $5.85 down to $5.25, with an intraday low of $4.79 and -2.77% over the past 24 hours.
I’ll treat it as a volatility sample for tokenized stocks. A single long daily candlestick doesn’t confirm direction—it mostly signals that there’s been significant disagreement in the market.
On the chart, the volume SMA 9 is 2.53M. BNCB corresponds to the bStocks page for CEA Industries. Tokenized securities aren’t actual equity, so you have to evaluate price volatility, liquidity, and information changes separately.
When you see a single daily candlestick like this, do you look at volume first, or do you wait for the close?
$BNCB #bStocks #RWA
I’ll treat it as a volatility sample for tokenized stocks. A single long daily candlestick doesn’t confirm direction—it mostly signals that there’s been significant disagreement in the market.
On the chart, the volume SMA 9 is 2.53M. BNCB corresponds to the bStocks page for CEA Industries. Tokenized securities aren’t actual equity, so you have to evaluate price volatility, liquidity, and information changes separately.
When you see a single daily candlestick like this, do you look at volume first, or do you wait for the close?
$BNCB #bStocks #RWA