$BTC Liying Chat Coin: 9/11 Bitcoin (BTC) and Ethereum (ETH) latest market analysis
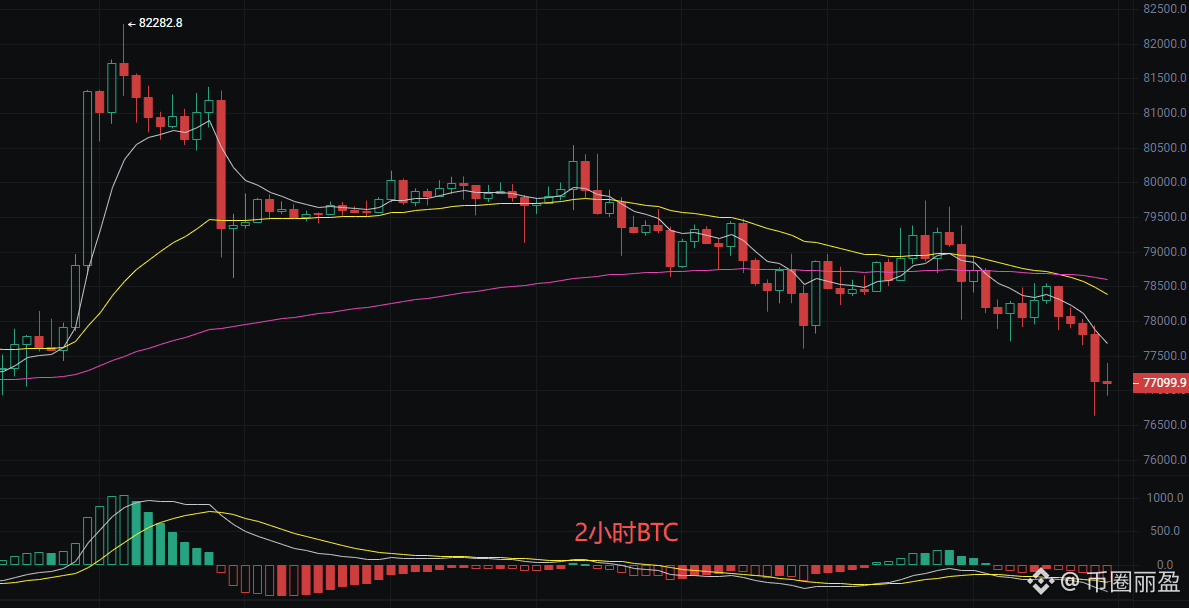
Family members! Bitcoin’s current price is 77,100. From the order book and charts, it looks like the bulls have lost their momentum—rebounds are always fleeting, while the bears press on step by step. Especially in the most recent few candlesticks, the bearish bodies have clearly enlarged, indicating that selling pressure is not small. The EMA moving-average system has formed a bearish arrangement, with short-term MAs exerting strong overhead pressure. Price is firmly pinned below the moving averages, leaving many layers of rebound resistance. The MACD indicator: both DIF and DEA have fallen below the zero line. MACD has been continuously expanding in bearish volume, and bearish momentum is still strengthening—so the downtrend remains unchanged. Price has already touched the lower band at 77,247. The mid band at 78,396 has become a strong resistance. If the lower band breaks, it may open up new downside space. However, short-term oversold conditions could also trigger a technical rebound, but we need to observe whether the rebound can stand above the mid band.
Short-term ideas (reference):
Go long at 80,000–80,500 (likely meant “做空点”): stop-loss 500 points; target 77,000, aiming for 76,500.
Go long at 77,500–77,000 (likely meant “做多点”): stop-loss 500 points; target 78,500, aiming for 79,500.
Ethereum
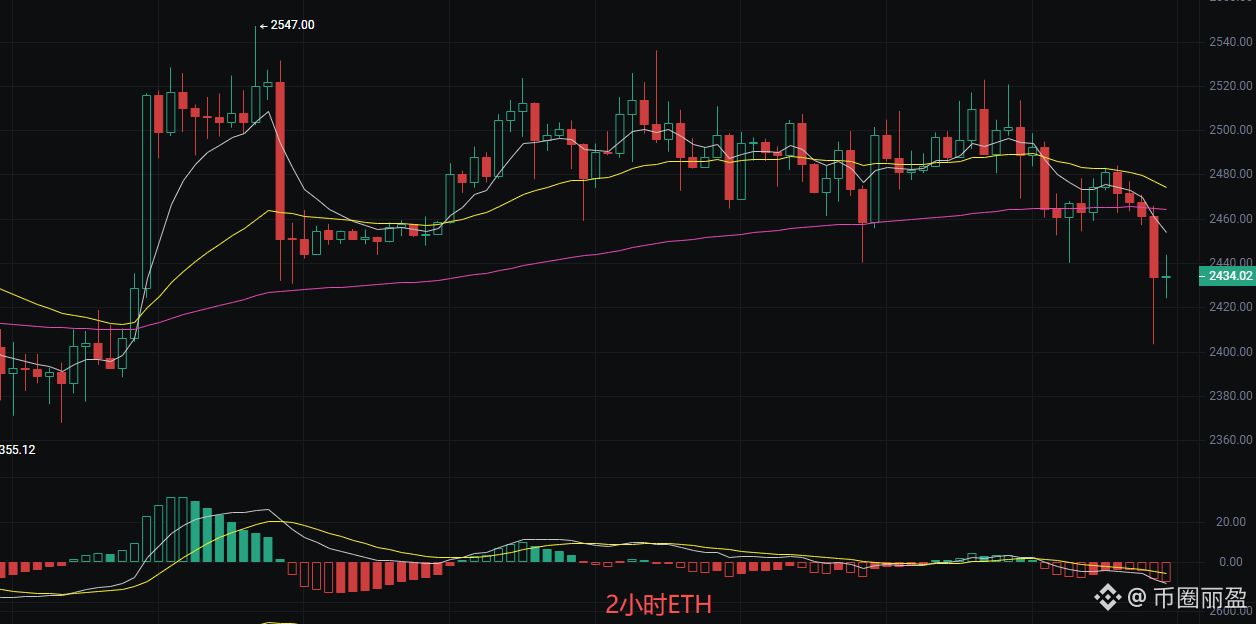
Family members! Ethereum is trading at 2,435. After the prior surge to 2,547, looking back now, it looks like a trap to lure buyers. The current strategy is: no rabbit, no scattering arrows—better to miss than to make a mistake. Protect your capital first, and wait until the trend becomes clear before entering. The technical indicators show a very clear bearish alignment. First, the entire moving-average system is above the current price and has formed a “dead cross” pressure. Especially the short-term moving averages are diverging downward, which indicates heavy selling pressure. The MACD indicator’s DIF and DEA are both forming a downward “dead cross,” and downside momentum is still being released. Price has already touched the lower band at 2,437. Although there is some support here, the Bollinger Bands appear to be opening wider. If the lower band breaks, it may open a new downside channel. Overall, the technical picture is bearish, and rebound resistance is heavy.
Short-term levels (reference):
Go long at 2,440: defense/support 2,420; stop-loss 30 points; target 2,470, aiming for 2,480.
Go long at 2,500: defense/support 2,520; stop-loss 30 points; target 2,470, aiming for 2,440.
The above content is exclusively原创 by Liying. If you reprint it, please indicate the source! The publication and review of the article may be delayed. Markets change rapidly—these suggestions are for reference only; risk is your own responsibility.
#BTC走势分析
Family members! Bitcoin’s current price is 77,100. From the order book and charts, it looks like the bulls have lost their momentum—rebounds are always fleeting, while the bears press on step by step. Especially in the most recent few candlesticks, the bearish bodies have clearly enlarged, indicating that selling pressure is not small. The EMA moving-average system has formed a bearish arrangement, with short-term MAs exerting strong overhead pressure. Price is firmly pinned below the moving averages, leaving many layers of rebound resistance. The MACD indicator: both DIF and DEA have fallen below the zero line. MACD has been continuously expanding in bearish volume, and bearish momentum is still strengthening—so the downtrend remains unchanged. Price has already touched the lower band at 77,247. The mid band at 78,396 has become a strong resistance. If the lower band breaks, it may open up new downside space. However, short-term oversold conditions could also trigger a technical rebound, but we need to observe whether the rebound can stand above the mid band.
Short-term ideas (reference):
Go long at 80,000–80,500 (likely meant “做空点”): stop-loss 500 points; target 77,000, aiming for 76,500.
Go long at 77,500–77,000 (likely meant “做多点”): stop-loss 500 points; target 78,500, aiming for 79,500.
Ethereum
Family members! Ethereum is trading at 2,435. After the prior surge to 2,547, looking back now, it looks like a trap to lure buyers. The current strategy is: no rabbit, no scattering arrows—better to miss than to make a mistake. Protect your capital first, and wait until the trend becomes clear before entering. The technical indicators show a very clear bearish alignment. First, the entire moving-average system is above the current price and has formed a “dead cross” pressure. Especially the short-term moving averages are diverging downward, which indicates heavy selling pressure. The MACD indicator’s DIF and DEA are both forming a downward “dead cross,” and downside momentum is still being released. Price has already touched the lower band at 2,437. Although there is some support here, the Bollinger Bands appear to be opening wider. If the lower band breaks, it may open a new downside channel. Overall, the technical picture is bearish, and rebound resistance is heavy.
Short-term levels (reference):
Go long at 2,440: defense/support 2,420; stop-loss 30 points; target 2,470, aiming for 2,480.
Go long at 2,500: defense/support 2,520; stop-loss 30 points; target 2,470, aiming for 2,440.
The above content is exclusively原创 by Liying. If you reprint it, please indicate the source! The publication and review of the article may be delayed. Markets change rapidly—these suggestions are for reference only; risk is your own responsibility.
#BTC走势分析