$BTC Market recap: bullish on the daily chart, bearish on the short term—how to set a risk-reward plan?
Currently, BTC is showing a typical multi-timeframe divergence:
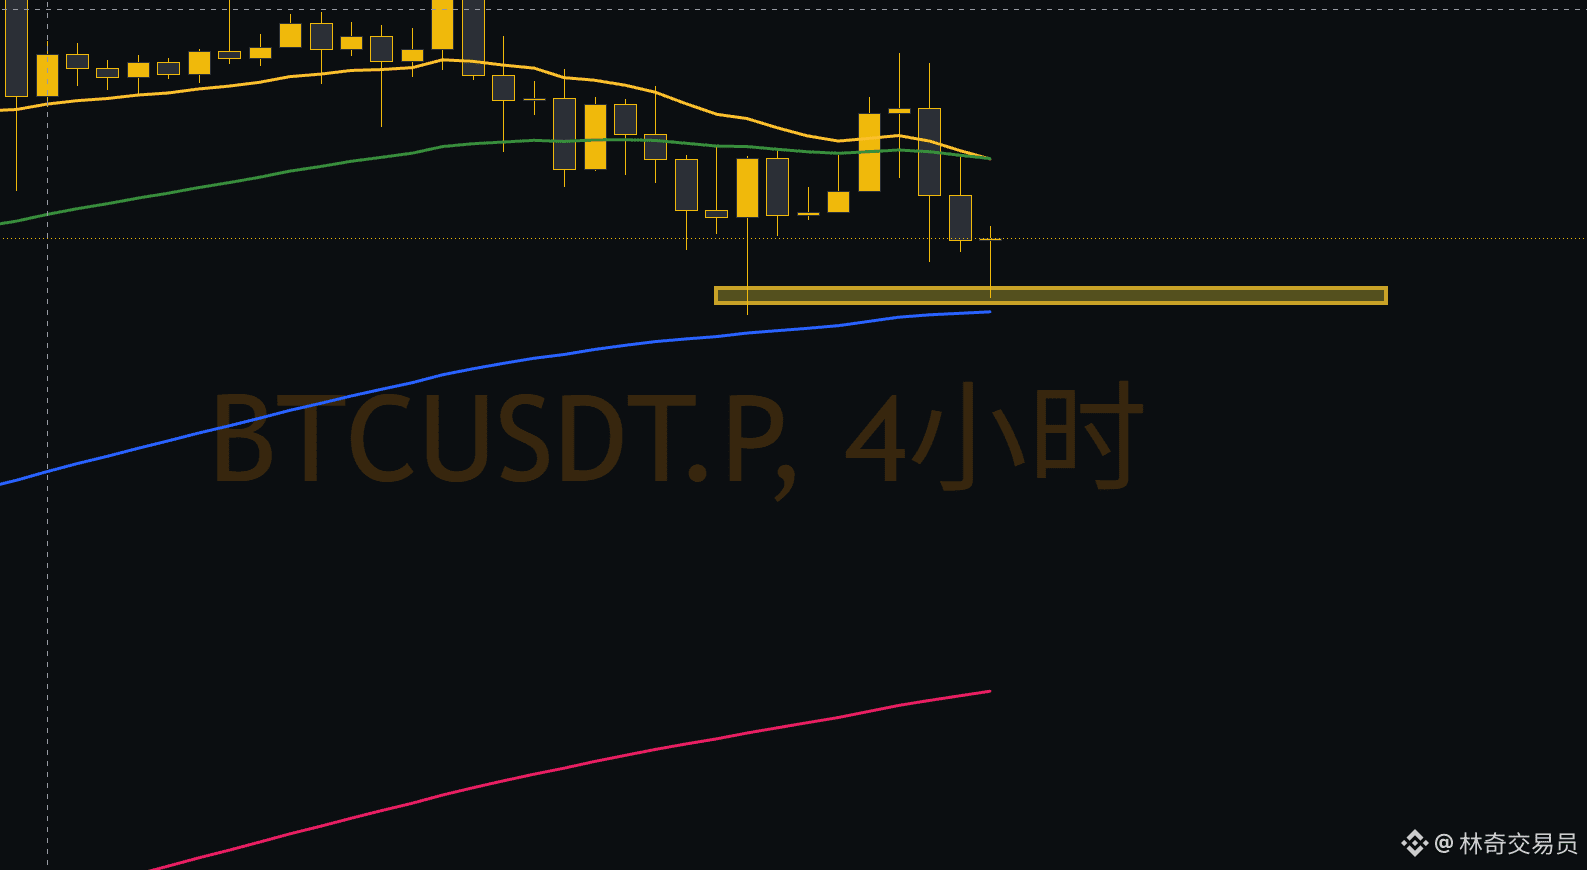
① Higher level: the daily chart looks bullish, but the 4H support is weak.
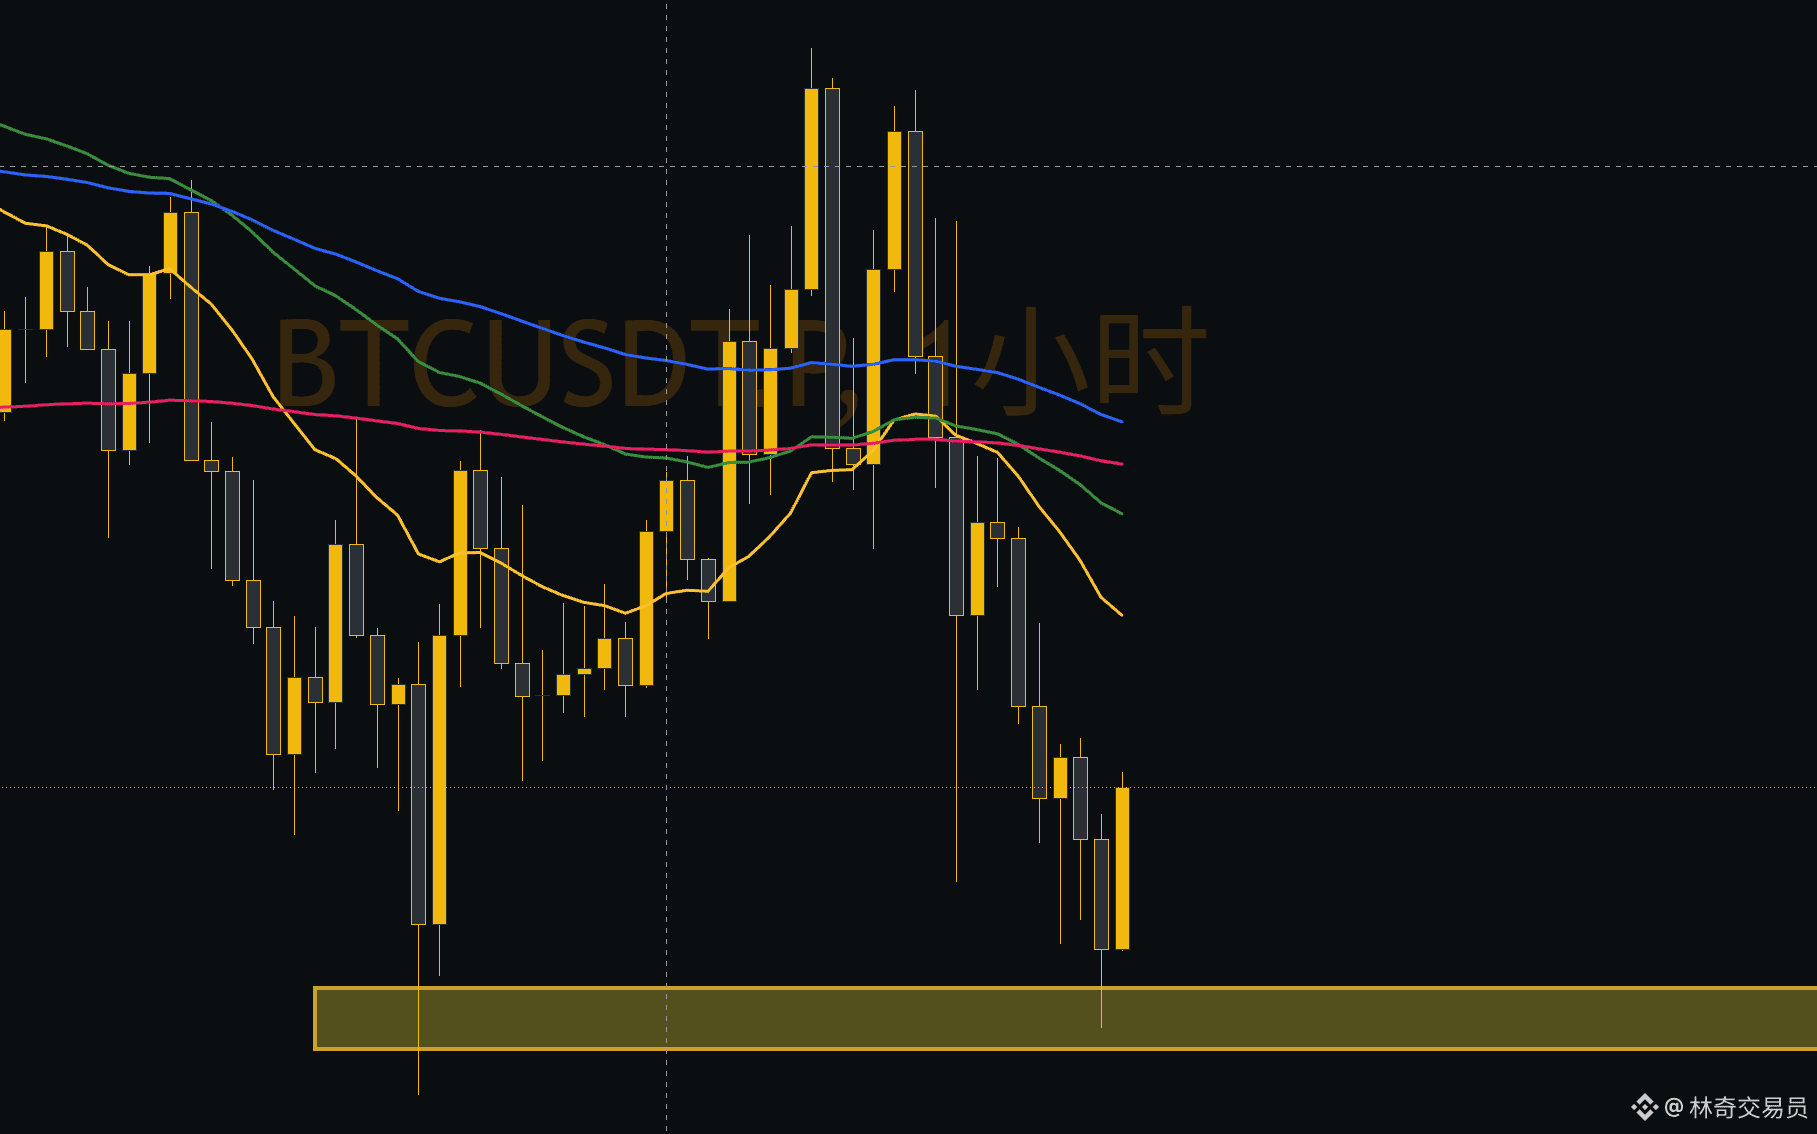
② Lower level: the 1H/15M charts are in a standard bearish alignment, with lower highs and lower lows—an established downtrend.
③ Core strategy: align with the lower-timeframe cycle resonance to go short, but never chase lows.
Trade details: wait for a rebound into the key resistance zone ([Resistance 1: 78343.6] / [Resistance 2: 78828.7]); only enter again when the lower timeframe shows exhaustion or a reversal structure.
No structure, no trading. If you agree with the logic, give it a follow and keep sharing real-time trade ideas.
#BTC走势分析
Currently, BTC is showing a typical multi-timeframe divergence:
① Higher level: the daily chart looks bullish, but the 4H support is weak.
② Lower level: the 1H/15M charts are in a standard bearish alignment, with lower highs and lower lows—an established downtrend.
③ Core strategy: align with the lower-timeframe cycle resonance to go short, but never chase lows.
Trade details: wait for a rebound into the key resistance zone ([Resistance 1: 78343.6] / [Resistance 2: 78828.7]); only enter again when the lower timeframe shows exhaustion or a reversal structure.
No structure, no trading. If you agree with the logic, give it a follow and keep sharing real-time trade ideas.
#BTC走势分析