BTC is consolidating at the top—are we about to break out, or break down?
Near the $80,000 area, the market is choosing between two outcomes: either confirm a head-and-shoulders bottom and open the second leg of the small bull run; or stage a fake breakout and fall back to retest the right shoulder.
This rebound is first sparked by macro factors. The Ministry of Finance expanded long-term government bond repo operations. The market read it as a form of easing under debt pressure—weakening the dollar and pulling down long-end yields. The “devaluation trade” is back on, and both gold and Bitcoin move higher in sync. On top of that, spot Bitcoin ETFs resumed net inflows, squeezing the shorts. Price quickly surged from around 63,000 to about 81,000.
But it hasn’t turned fully dovish: inflation is still above 2%, and interest rates are stuck at 3.50%–3.75%, with rate-hike expectations not gone. For the true second-leg bull run, we need yields to stabilize, the dollar to stop strengthening, and ETF inflows to keep coming.
If Bitcoin forms and completes this head-and-shoulders bottom, that would be more consistent with the start of the second bull cycle.
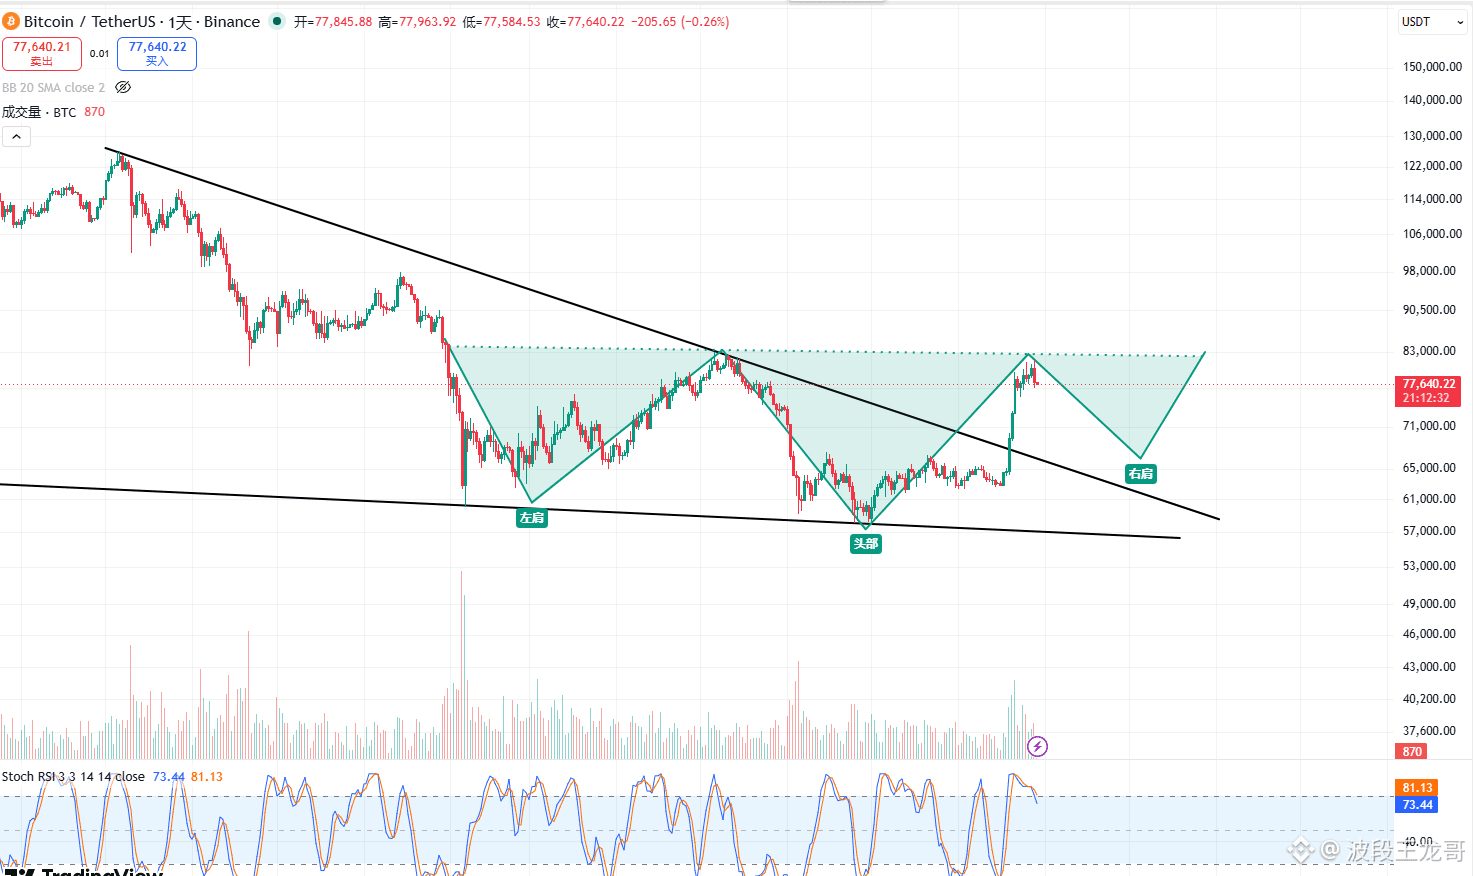
The structure is clear: the left shoulder is the first effective bottoming during the decline; the head, around $57,000–$61,000, breaks through the sell pressure. The right-shoulder low is clearly higher than the head, indicating that bearish force is weakening. The green zone roughly corresponds to the neckline supply band (around $83,000). Above that, the long-term descending trendline is still capping price.
The key to a head-and-shoulders bottom isn’t just “the pattern exists”—it’s a breakout with volume and a firm hold above the neckline. The measured move projects upward by the distance from the head to the neckline. If it fully plays out, it points to higher ranges. Even with a discount, it’s enough to form a medium-term bull cycle—not just a rebound from oversold conditions.
Right now, price has pulled back to around 77,600. RSI is elevated, so the short term needs to digest. A cleaner path is to pull back to support near the right shoulder or the trendline, then attack the neckline again. If BTC breaks below the right shoulder and re-enters the head region, the pattern fails—and the small-bull narrative will be delayed.
The macro provides the match, and the chart provides the map. We’re just missing the last stroke: the breakout of the neckline. Are you also expecting the next leg of the bull market to start!
$BTC
Near the $80,000 area, the market is choosing between two outcomes: either confirm a head-and-shoulders bottom and open the second leg of the small bull run; or stage a fake breakout and fall back to retest the right shoulder.
This rebound is first sparked by macro factors. The Ministry of Finance expanded long-term government bond repo operations. The market read it as a form of easing under debt pressure—weakening the dollar and pulling down long-end yields. The “devaluation trade” is back on, and both gold and Bitcoin move higher in sync. On top of that, spot Bitcoin ETFs resumed net inflows, squeezing the shorts. Price quickly surged from around 63,000 to about 81,000.
But it hasn’t turned fully dovish: inflation is still above 2%, and interest rates are stuck at 3.50%–3.75%, with rate-hike expectations not gone. For the true second-leg bull run, we need yields to stabilize, the dollar to stop strengthening, and ETF inflows to keep coming.
If Bitcoin forms and completes this head-and-shoulders bottom, that would be more consistent with the start of the second bull cycle.
The structure is clear: the left shoulder is the first effective bottoming during the decline; the head, around $57,000–$61,000, breaks through the sell pressure. The right-shoulder low is clearly higher than the head, indicating that bearish force is weakening. The green zone roughly corresponds to the neckline supply band (around $83,000). Above that, the long-term descending trendline is still capping price.
The key to a head-and-shoulders bottom isn’t just “the pattern exists”—it’s a breakout with volume and a firm hold above the neckline. The measured move projects upward by the distance from the head to the neckline. If it fully plays out, it points to higher ranges. Even with a discount, it’s enough to form a medium-term bull cycle—not just a rebound from oversold conditions.
Right now, price has pulled back to around 77,600. RSI is elevated, so the short term needs to digest. A cleaner path is to pull back to support near the right shoulder or the trendline, then attack the neckline again. If BTC breaks below the right shoulder and re-enters the head region, the pattern fails—and the small-bull narrative will be delayed.
The macro provides the match, and the chart provides the map. We’re just missing the last stroke: the breakout of the neckline. Are you also expecting the next leg of the bull market to start!
$BTC