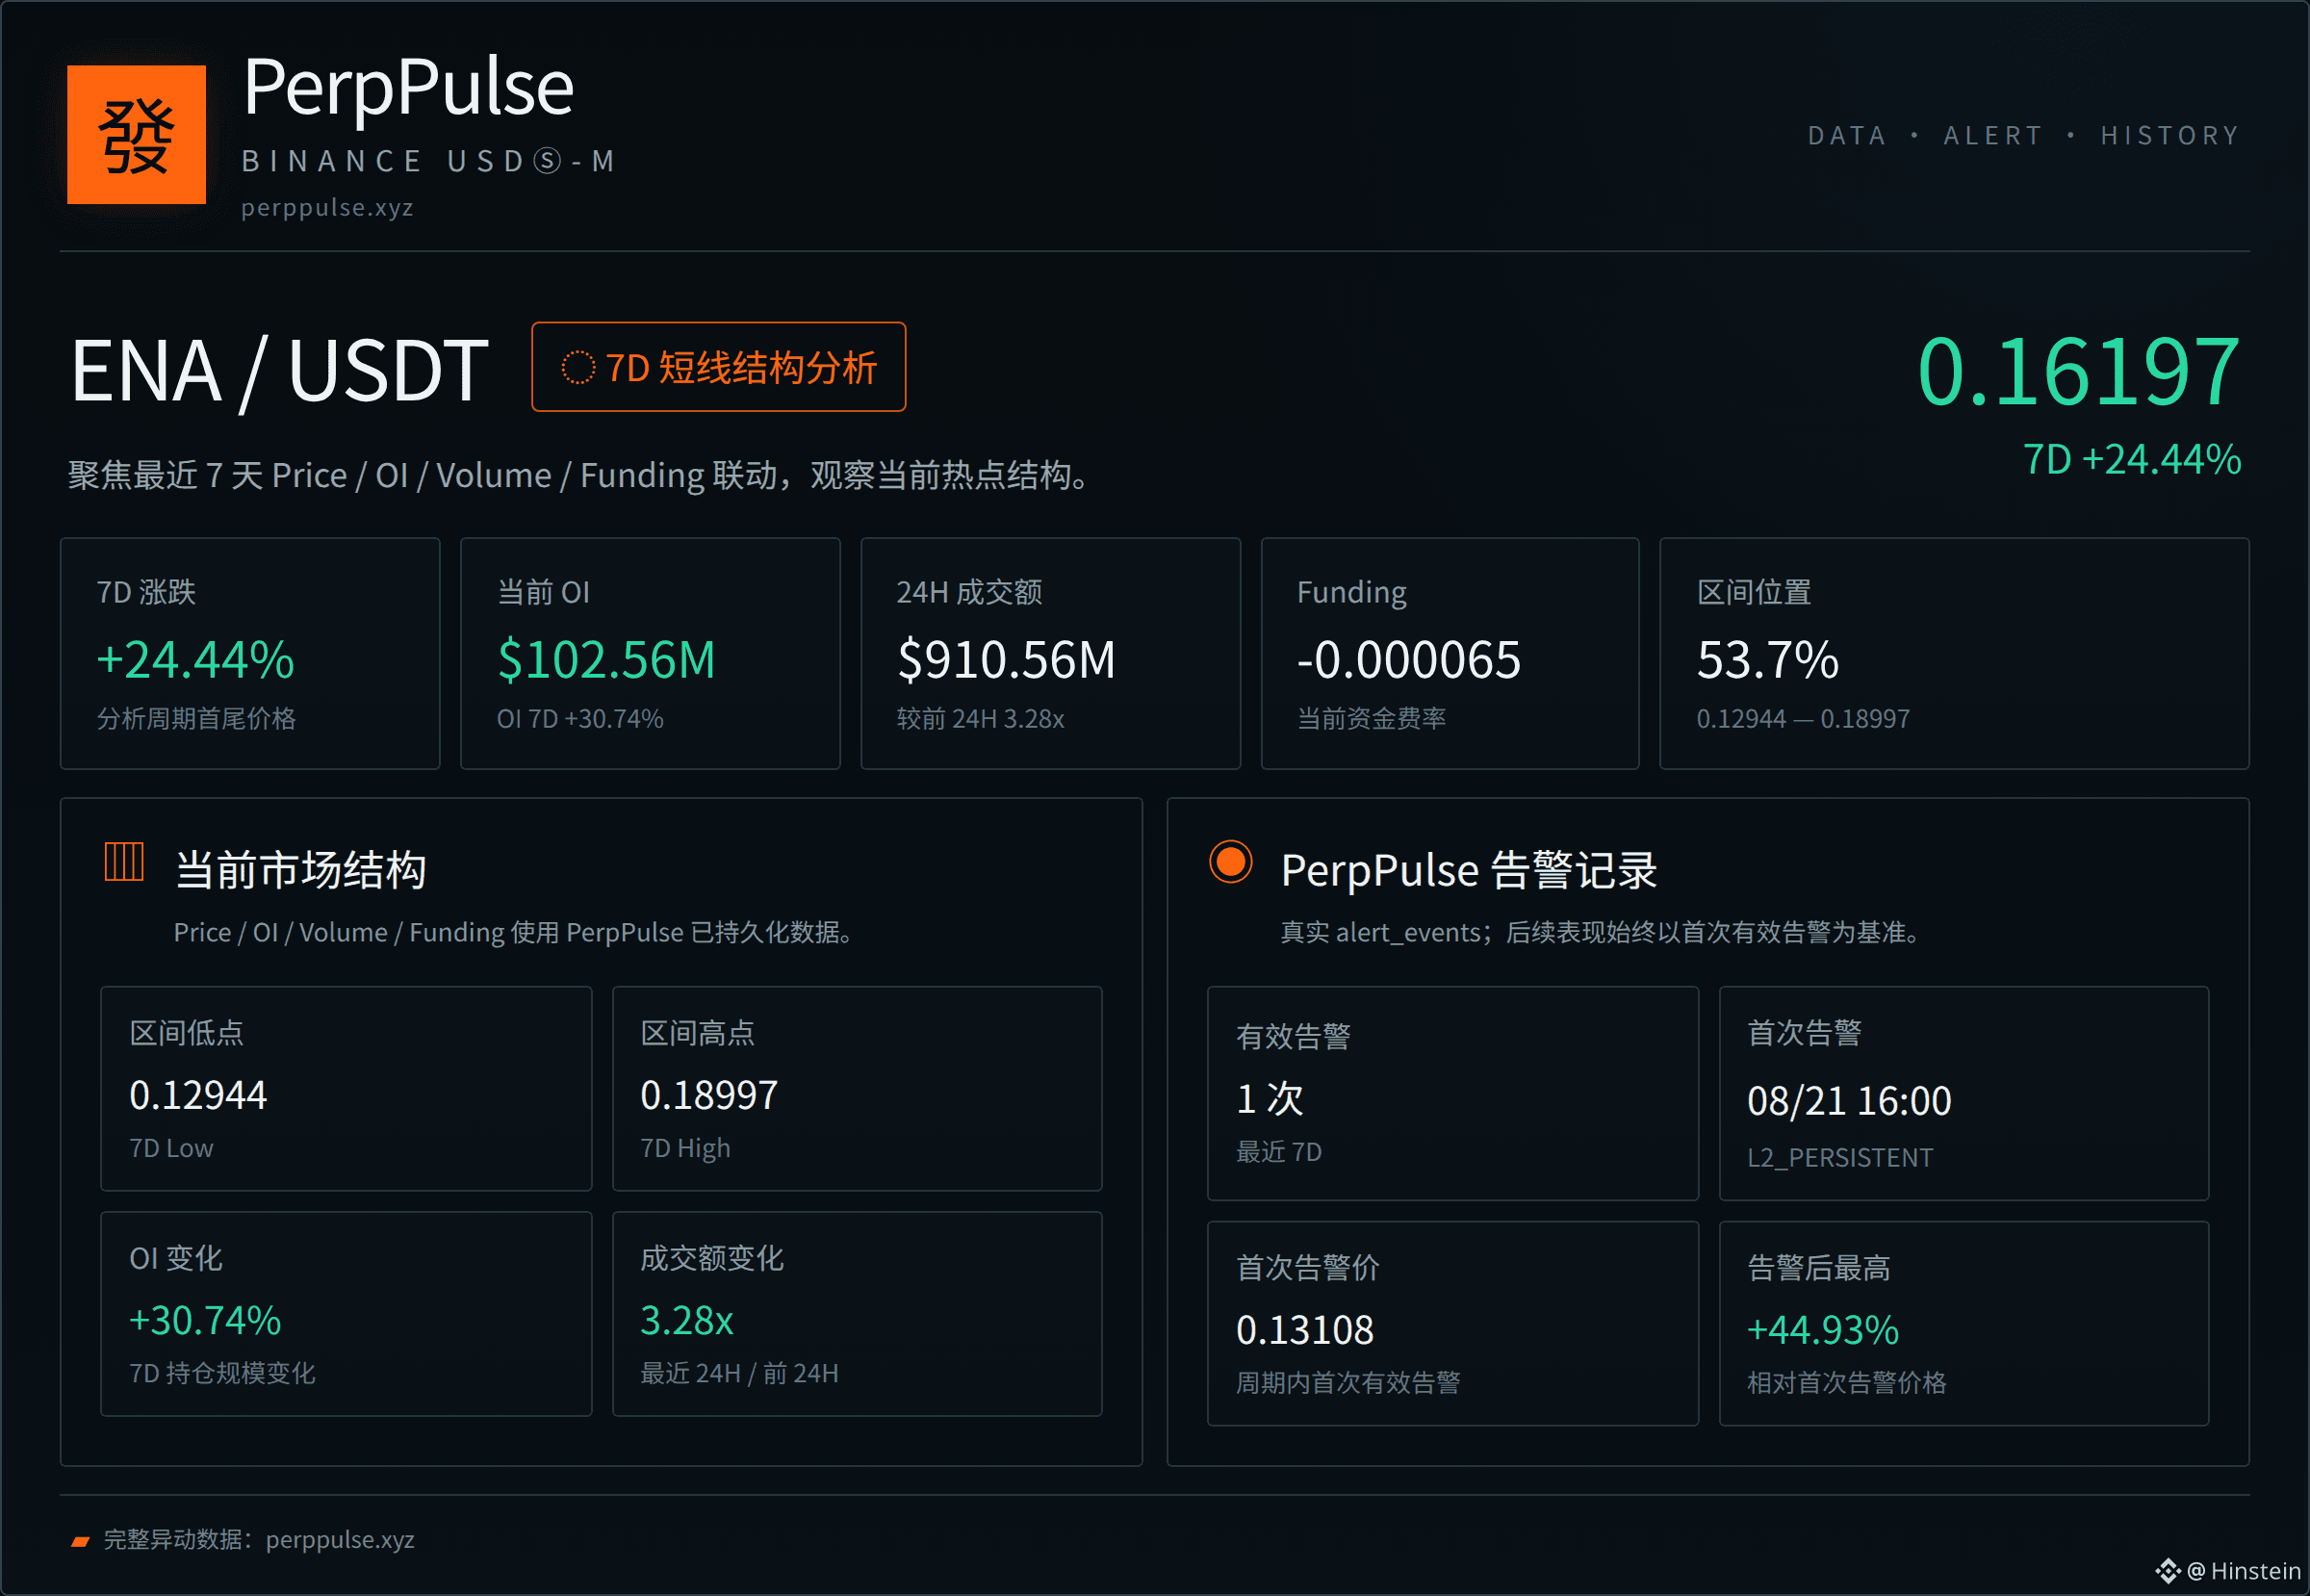
$ENA This week, it once again became the market’s focus. Over 7 days, it climbed steadily from 0.13016 to 0.16197, with a rise of 24.44% across the range. But what truly heated up the order book was the high-volume bullish candle on August 23: the price jumped directly from 0.15426 to 0.17607, and the single candlestick’s traded value surged to 339.36M, pulling the entire contract market’s attention back in.
This rally wasn’t a straight line. After spiking on August 23, $ENA entered a clearly noticeable contraction-and-pullback phase. From August 25 to 26, the traded value shrank to around 30M, and the price also retreated to about 0.138. However, on August 27, trading activity picked up again: traded value expanded from 60.70M to 202.36M, and the price rose once more, reaching the 7-day high of 0.18997 in the early hours of August 28. The current price is 0.16197, sitting at the 53.7% mark of the 7-day range—right in a classic “mid-run consolidation observation zone” after a high-and-pullback.
Changes in fund flows are worth noting. In the past 24 hours, traded value reached 910.56M, up about 228.36% versus 277.30M in the previous 24 hours—clearly higher volume. But OI fell from the peak of 122.23M to 102.56M. The 7-day OI increase is still 30.74%, suggesting that some positions chose to exit after the high. The funding rate shifted from a 7-day average of 0.005% to the current -0.0065%, loosening the cost basis for long and short positions and cooling short-term sentiment.
PerpPulse recorded an L2_PERSISTENT alert on August 21, 2026 at 08:00. At that time, the price was 0.13108, right in the volume-expansion launch phase. Over 8 hours, the price changed by 12.34%, OI changed by 10.19%, and the 2-hour volume ratio reached 19.12. After the alert, the price peaked at 0.18997, for a maximum gain of 44.93%.
Next, the observation points are very clear: resistance overhead is at the 0.18997 swing high; support below is the dense traded area between 0.156 and 0.161. The current price at 0.16197 is right in the middle. If OI can rise again and volume can hold steady, the upside structure remains valid. If it breaks below 0.156 and OI keeps falling, it may enter a deeper pullback adjustment. The funding rate turning from positive to negative is the key signal to track right now—whether price stabilizes afterward will determine the next leg of this move.
Full anomaly data: perppulse.xyz
This rally wasn’t a straight line. After spiking on August 23, $ENA entered a clearly noticeable contraction-and-pullback phase. From August 25 to 26, the traded value shrank to around 30M, and the price also retreated to about 0.138. However, on August 27, trading activity picked up again: traded value expanded from 60.70M to 202.36M, and the price rose once more, reaching the 7-day high of 0.18997 in the early hours of August 28. The current price is 0.16197, sitting at the 53.7% mark of the 7-day range—right in a classic “mid-run consolidation observation zone” after a high-and-pullback.
Changes in fund flows are worth noting. In the past 24 hours, traded value reached 910.56M, up about 228.36% versus 277.30M in the previous 24 hours—clearly higher volume. But OI fell from the peak of 122.23M to 102.56M. The 7-day OI increase is still 30.74%, suggesting that some positions chose to exit after the high. The funding rate shifted from a 7-day average of 0.005% to the current -0.0065%, loosening the cost basis for long and short positions and cooling short-term sentiment.
PerpPulse recorded an L2_PERSISTENT alert on August 21, 2026 at 08:00. At that time, the price was 0.13108, right in the volume-expansion launch phase. Over 8 hours, the price changed by 12.34%, OI changed by 10.19%, and the 2-hour volume ratio reached 19.12. After the alert, the price peaked at 0.18997, for a maximum gain of 44.93%.
Next, the observation points are very clear: resistance overhead is at the 0.18997 swing high; support below is the dense traded area between 0.156 and 0.161. The current price at 0.16197 is right in the middle. If OI can rise again and volume can hold steady, the upside structure remains valid. If it breaks below 0.156 and OI keeps falling, it may enter a deeper pullback adjustment. The funding rate turning from positive to negative is the key signal to track right now—whether price stabilizes afterward will determine the next leg of this move.
Full anomaly data: perppulse.xyz