


Has the price of Bitcoin really bottomed out?
Why surrender is a process, not a price, and what the current data indicates;
Analysis can be conducted from a structured probabilistic framework based on four independent areas of the Bitcoin market.
The four areas are: holder behavior, network-level losses, cost-based dynamics, and statistical extremes.
Now everyone wants the same thing: certainty.
Not hope, not feeling, and not blind confidence on Twitter, but genuine, data-based answers.
Overall, they allow us to answer a simple yet unsettling question:
Are we in the final phase of the bear market process, or is there still considerable downside potential ahead?
① Bear markets leave structural traces: Each Bitcoin bear market has recurring on-chain and statistical characteristics that appear with decreasing severity.
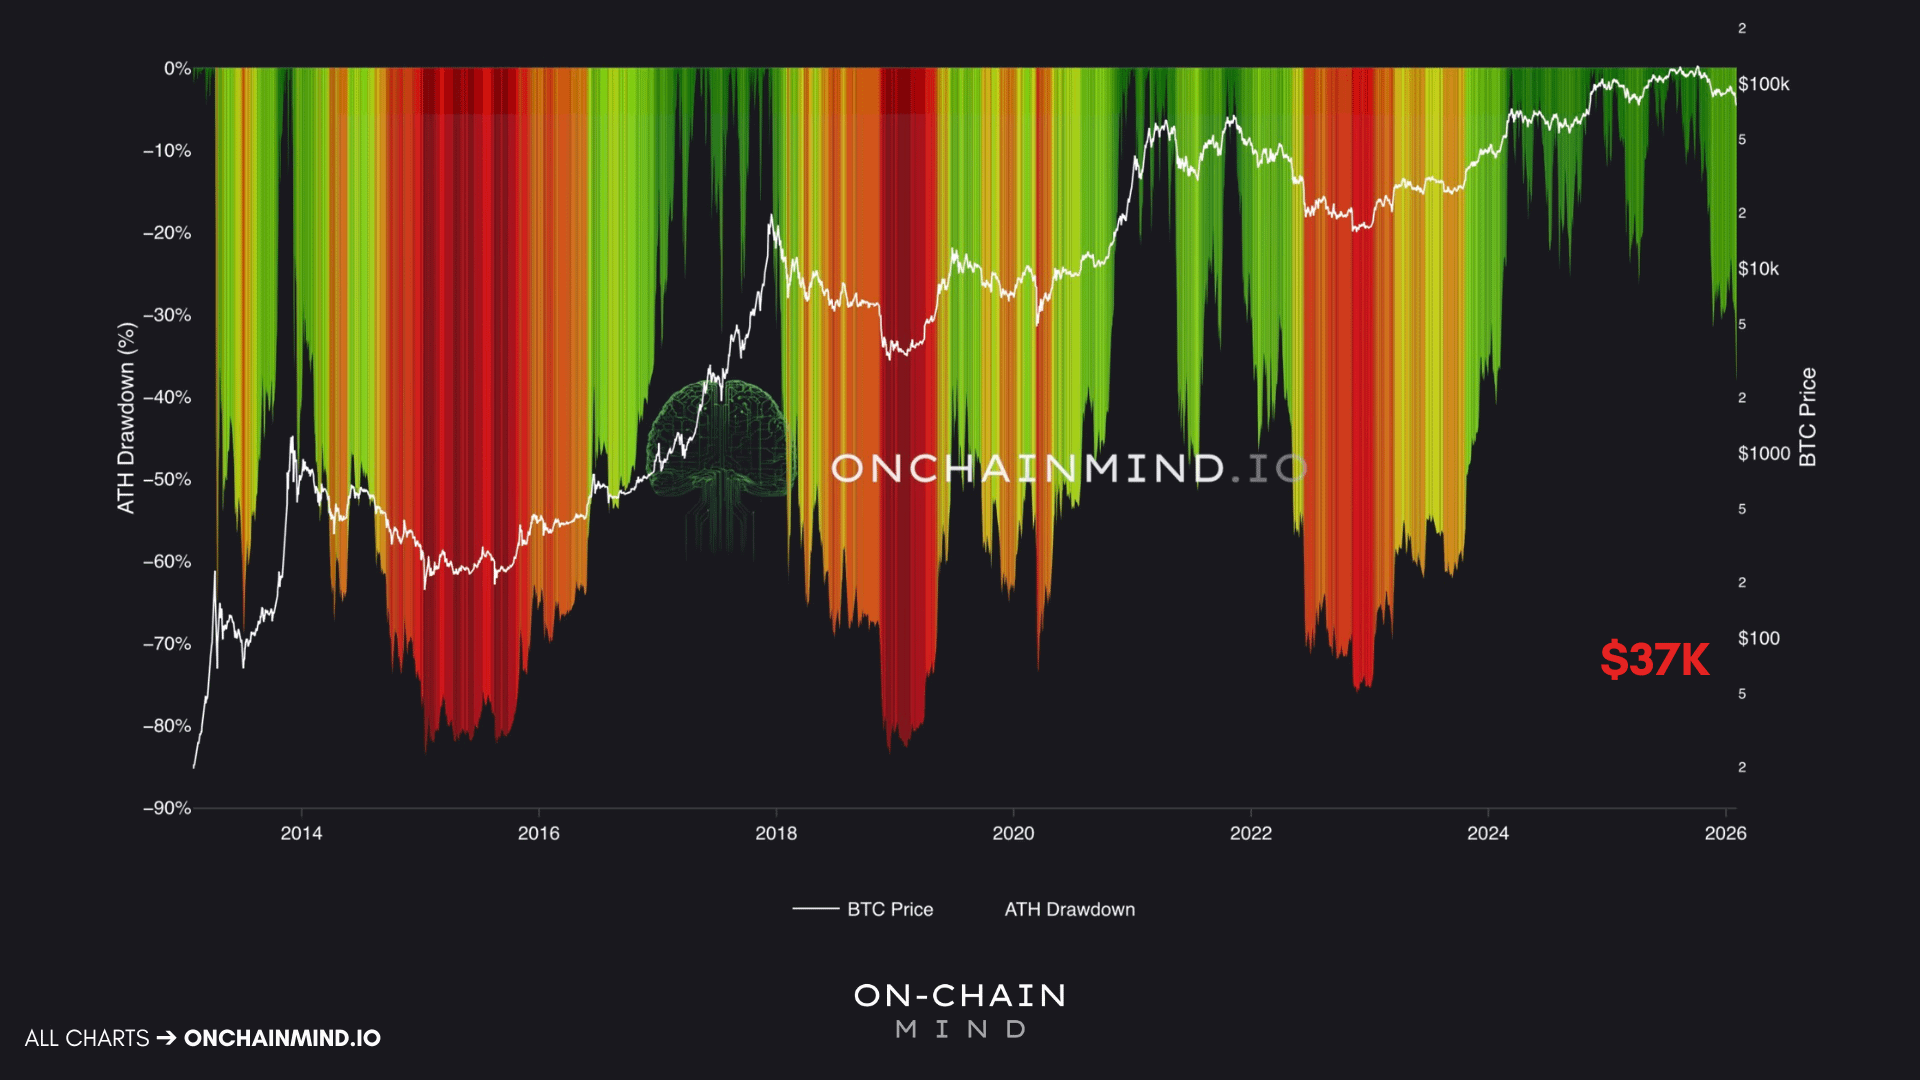
Bitcoin Price ATH Drawdown
Bitcoin Price Historical ATH Drawdown
"Classic" Bear Market Framework
Let’s start with a disconcerting fundamental assumption: This time may not be different.
So far, every major cycle of Bitcoin has ended bear markets with deep structural resets. A drop of over 70% from peak to trough is not unusual but rather a historical norm. If we follow this 'standard' trajectory from the high of $126,000, Bitcoin's price should now be around $37,000.
That being said, this cycle complicates matters. The previous bull market was noticeably much milder than the previous frenzied upswings, setting the stage for the subsequent milder bear market.
There is some truth to this statement. But truly mature investors do not build strategies around the best-case scenario; they prepare for a range of possible outcomes.
Instead of using any arbitrary percentage drawdown as a benchmark, we need to examine whether the conditions that historically defined the true bear market bottom have emerged.
② Capitulation-style selling is a process, not a moment: The most intense sell-offs often signal the beginning of bottom formation, not the final low.
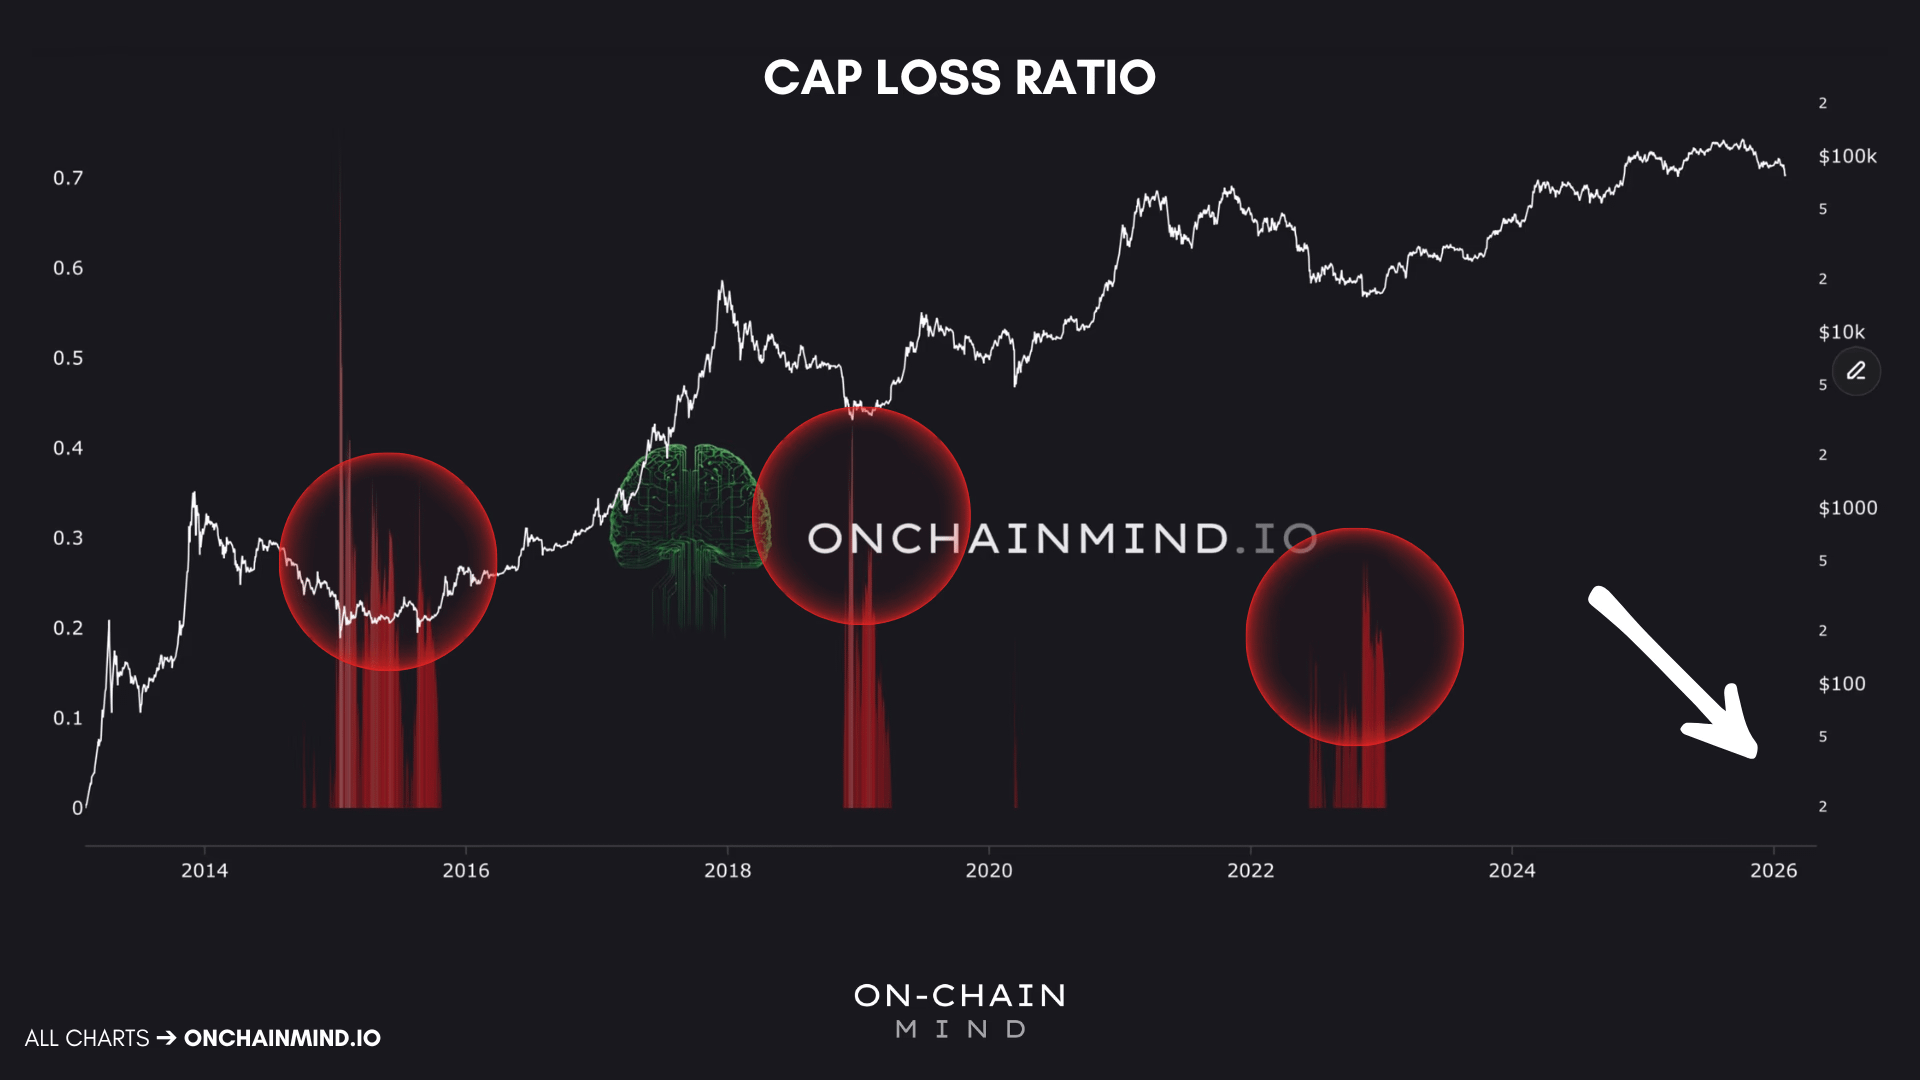
Bitcoin Cap Loss Ratio
Measuring Pain Across the Network
One of the most telling indicators here is what I call the 'Cap Loss Rate' indicator. This is a network-level indicator designed to measure the extent of losses in the Bitcoin ecosystem at any given point.
Essentially, the capital loss rate compares two things:
Market Cap, reflecting current price-based valuation.
Realized Capital, representing the total cost basis of all circulating coins.
When the market cap falls below the realized market cap, the entire network operates at a loss. This is not a theoretical situation, but a financial loss borne by millions of participants.
This is why it acts like a surrender thermometer. It only activates when losses are widespread and unavoidable. The greater the fluctuation, the more severe the predicament.
From a historical perspective, this pattern is clear:
In 2015, this ratio often exceeded 0.3, sometimes even surpassing 0.5. That was complete surrender.
In 2018-19, it broke through 0.3 again and briefly touched 0.4.
In 2022, this value mostly hovered above 0.2 and briefly entered the 0.3 range.
Each cycle shows a trend of decreasing extreme values, with peak stress levels dropping by about 0.1 each time. If this pattern continues, similar collapses in this cycle may occur between 0.1 and 0.2.
The key is: We have not yet reached the destination.
This ratio has not seen a significant rise. From a purely network loss perspective, the market has not yet experienced the systemic pain that typically marks the final low of a bear market in history.
But this does not guarantee that prices will necessarily fall. However, it does indicate that within the 'classic' bear market framework, the downside risk has not yet been fully released.
When this indicator lights up, history has clearly shown that these moments provide Bitcoin with the most generational wealth accumulation opportunities ever.
③ HODLer behavior is more important than price: The long-term and short-term cost bases reveal pressure levels that price itself cannot reflect.
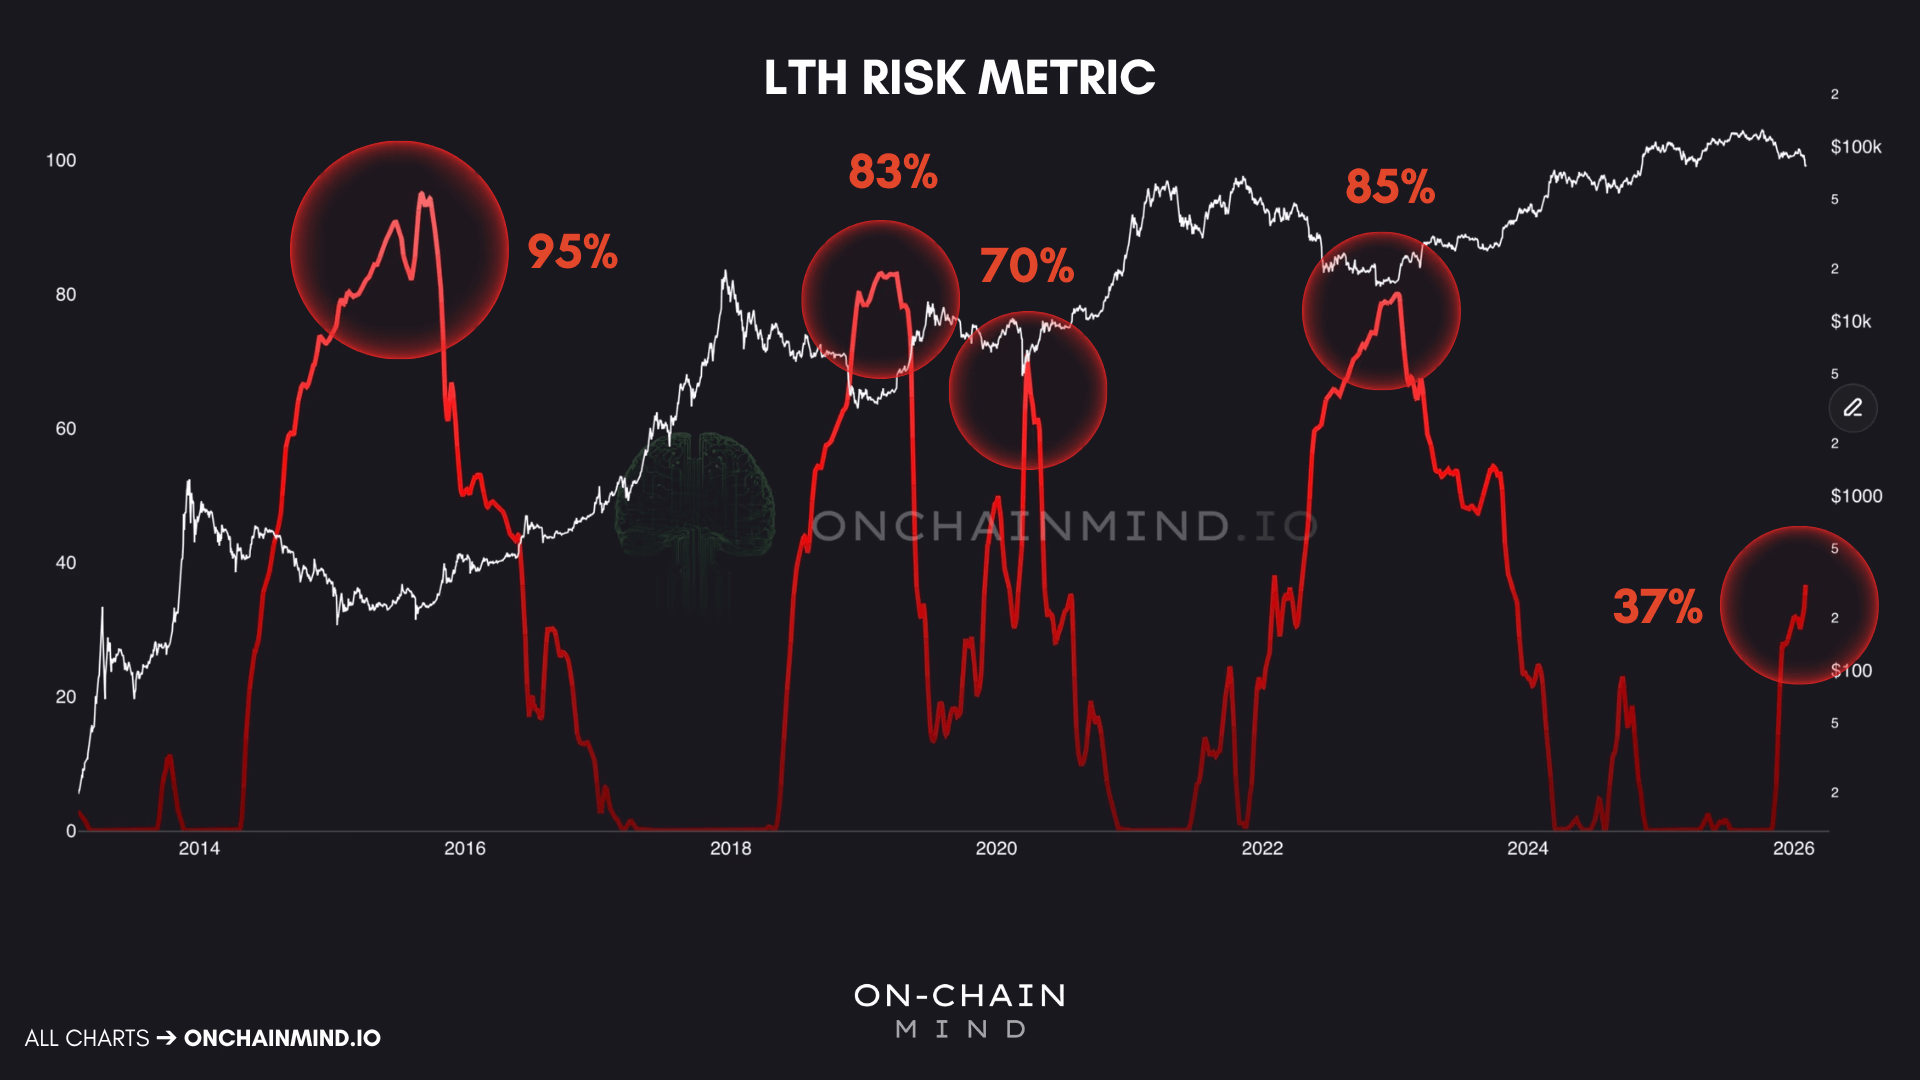
LTH Loss Risk Metric
Pressure of the Strong
Bitcoin holders are not a monolith. Their investment horizons fundamentally change their behavior, and the data has excellently captured this transition.
The industry standard threshold is 155 days, just over 5 months. Below this threshold, you will be classified as a Short-Term Holder (STH). Above this threshold, you will be considered a Long-Term Holder (LTH).
This distinction is crucial because afterward, their behavior will change significantly. From the statistics, long-term investors (LTH) are less reactive, have smaller emotional swings, and can better withstand the selling pressure brought on by market volatility. But when they do face pressure, it requires extra attention.
The LTH Risk Metric tracks the percentage of unrealized losses among long-term holders.
Such companies typically have strong profitability, which is a significant feature. Therefore, when a considerable number of companies in this group experience a decline in performance, it indicates that there are deep-seated issues within their structure.
Data has been standardized into probability risk indicators:
0% represents a situation where long-term holders have almost no losses. This situation typically coincides with the expansion phase of a bull market.
100% does not mean all long-term holders are at a loss. It indicates that the metric has reached the highest level of long-term holder distress observed historically.
Looking back:
Peaked in 2015 at about 95%.
It reached about 83% in 2019.
Soared to about 70% in March 2020.
Peaked near 85% in 2022.
The condition has eased somewhat, but not significantly.
The most important threshold is this one. Based on historical data, once this indicator exceeds 55-60%, the process of bottom retracement will quickly begin. Within a few months, the market will complete its transformation and rebound.
Today, we are roughly at around 37%.
This tells us some important information. Long-term holdings, although unsettling, are not yet in complete distress. If this cycle follows historical patterns, even with a reduced scale, breaking through 70% strongly indicates we are nearing the end of the bear market.
Even when the most patient participants are feeling pain, you are usually close to the target.
④ Probability over Prediction: The statistical deviation model can continuously identify when downside risk is essentially exhausted.
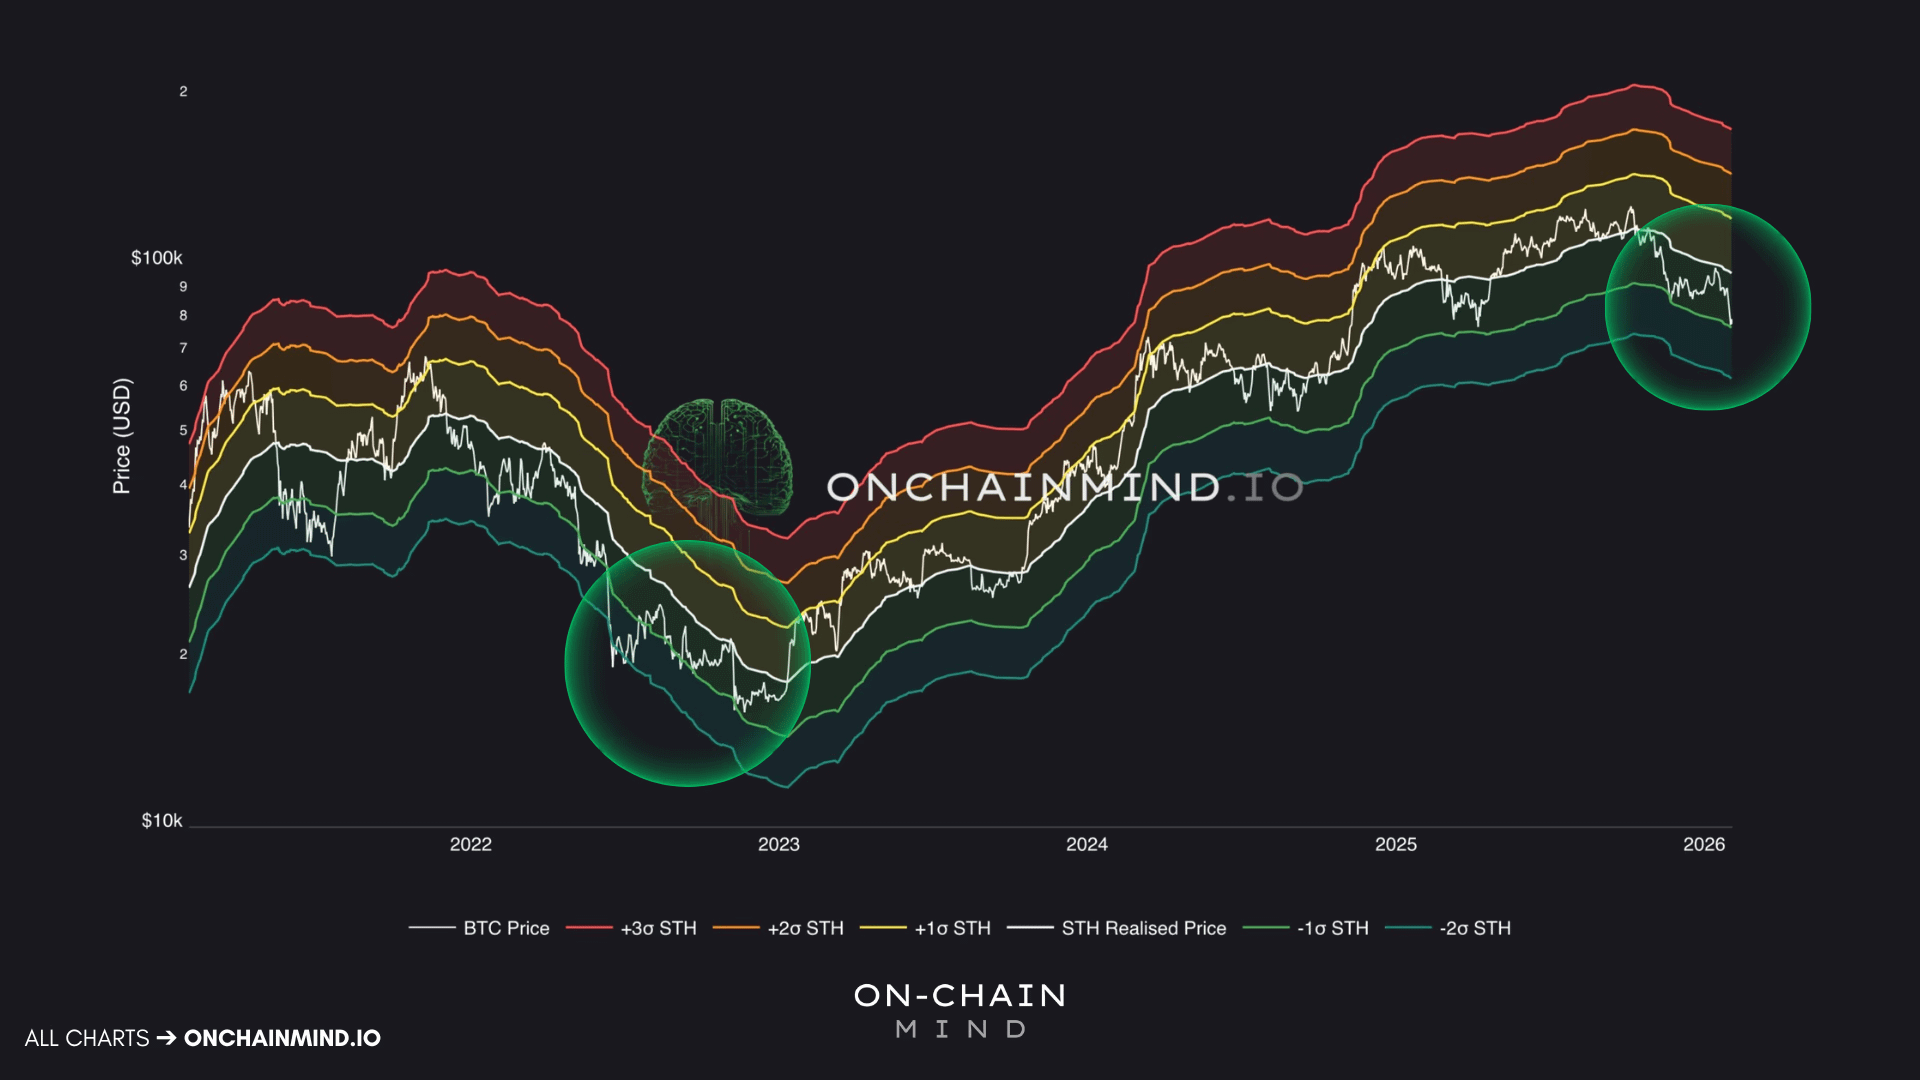
STH Cost Bands
Floor Construction Location
Now let’s change our perspective and take a look at the latest participants: Short-Term Holders.
This group represents new members who joined in the last 5 months. Their average acquisition price constitutes the actual price for STH, around which we can build dynamic cost ranges.
These ranges are like a probability chart, indicating where bear markets usually end:
The green area represents about 1 standard deviation below the STH cost benchmark.
The blue banded area represents deeper surrender events within a range of 2 standard deviations, which are typically brief and intense.
In past bear markets, price bottoms have always been in these areas.
Looking at recent history, the green area has played most of the role. The blue area is usually only touched during liquidity-driven rapid fluctuations when supply is almost immediately absorbed.
Currently, the price is at the lower end of the green band and close to the blue band.
Specifically:
The current price of the green version is approximately $75,000.
The price of the blue version is close to $61,000.
These price levels are not predictions but rather probabilistic accumulation zones. They tell you when the risk-reward balance will decisively shift towards the buyers.
A crucial note: these price ranges are dynamically changing. Within a few months, price fluctuations could reach $5,000 to $10,000. That’s why real-time monitoring is essential. Static values cannot reflect the actual situation.
But structurally, historically being in this area has always been a great opportunity for wealth accumulation rather than panic.
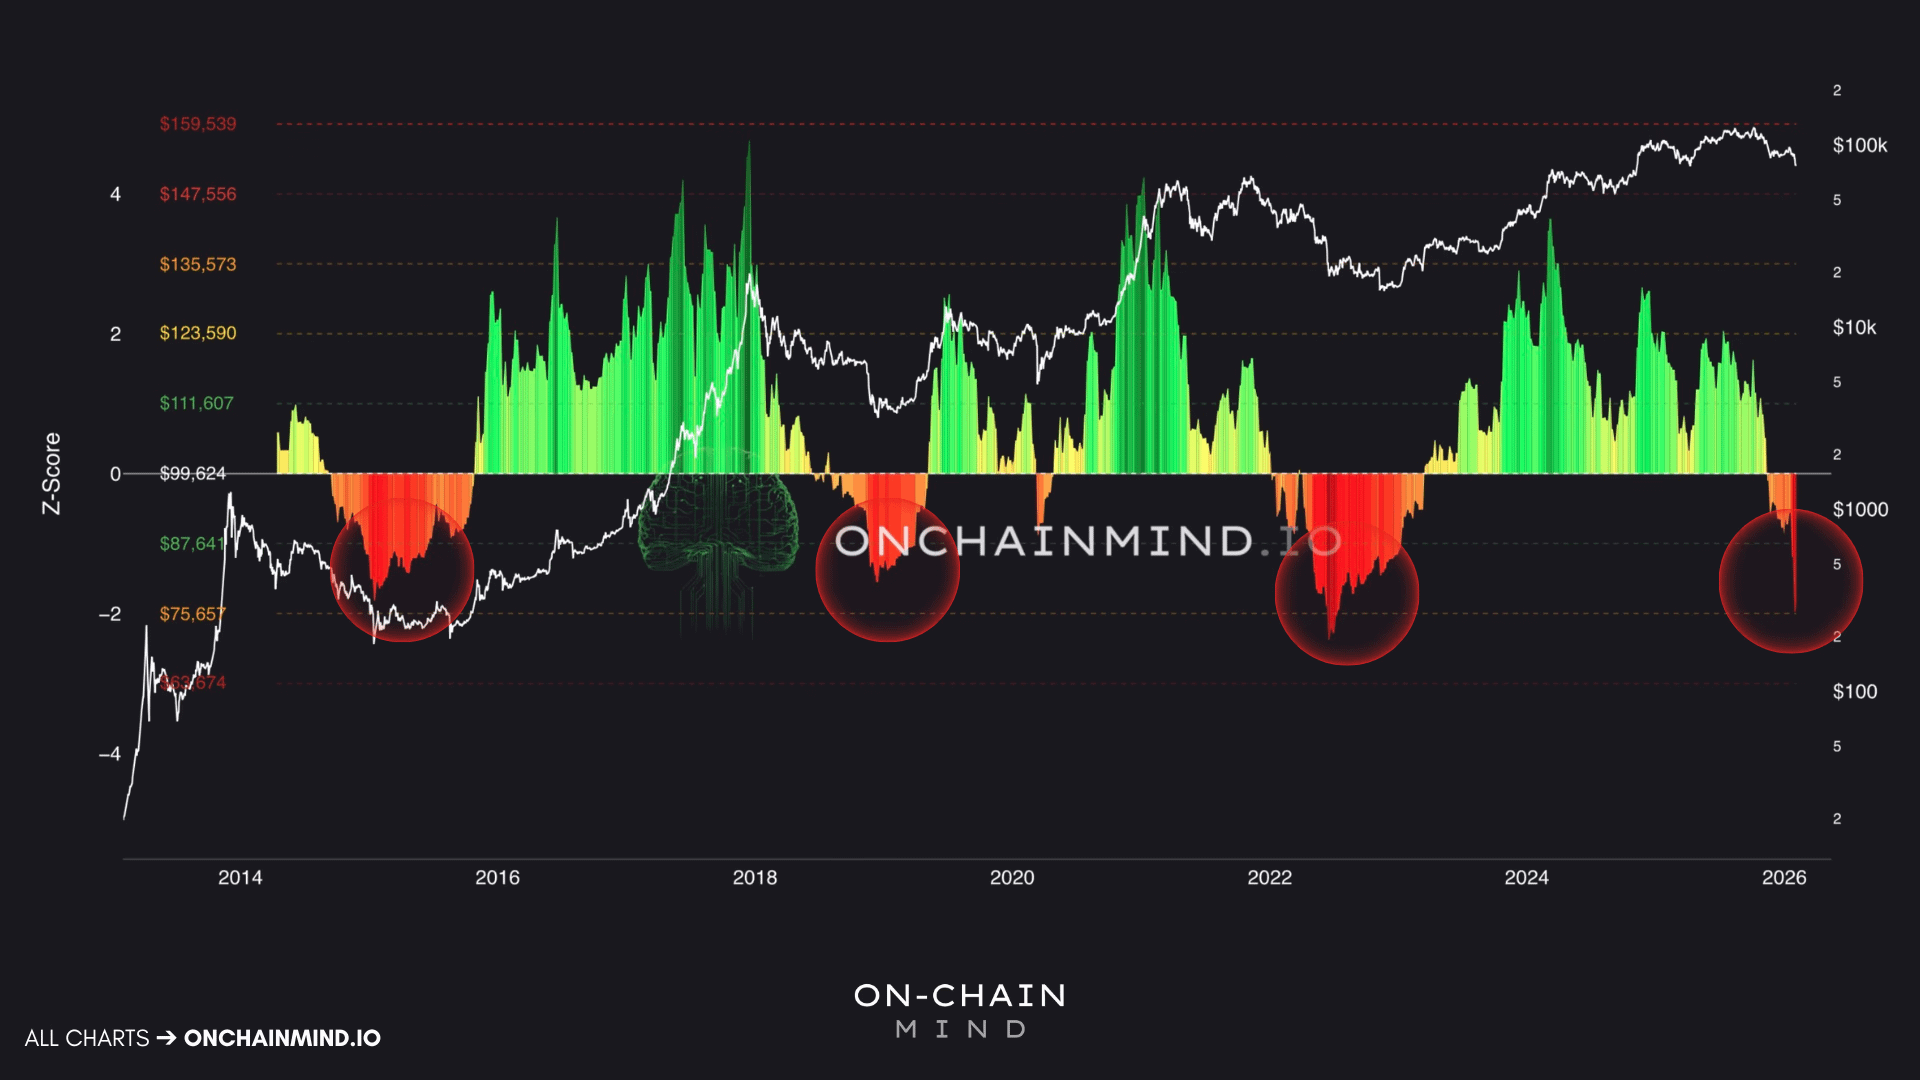
⑤ The clearest signal comes from posing a simpler question: How extreme is the current price relative to its own historical price, statistically speaking?
Z-Score Probability Waves
Z-Score Probability Wave
Probability of Disengagement
On-chain data is indeed powerful, but it is not the only perspective worth using.
Sometimes, the clearest signal comes from posing a simpler question: How extreme is the current price relative to its own historical price, statistically speaking?
This is the role of the Z-Score Probability Wave.
This model measures the degree to which price deviates from its long-term mean in standard deviations. Unlike many indicators, it can automatically adapt to cyclical changes without manually considering diminishing returns or changes in market mechanisms.
Historically, Bitcoin bear market bottoms usually form between -1 to -2 standard deviations, potentially dipping below -2 during extreme events.
We have just experienced volatility of -2 standard deviations.
These events are extremely rare and represent a statistically significant downward deviation. Importantly, they almost never mark the exact date of the price bottom, but rather indicate that the bottoming process has begun.
What usually follows is not a V-shaped rebound but rather months of oscillation, frustrating and slightly declining price trends. This phase is designed to exhaust selling power, shake market confidence, and test long-term holders.
Prices could still drop another $5,000, $10,000, or even $15,000. This is part of the bottoming process.
If you’re still here after experiencing such fluctuations, then you’ve weathered one of the most severe statistically significant market declines in modern history.

The Psychology of the Lone Wolf
I remember the exact moment when the excitement faded during previous rounds of Bitcoin price fluctuations, when mainstream media announced for the hundredth time that Bitcoin was dead, and my friends stopped asking me how to buy Bitcoin.
In fact, they completely stopped talking about it because it was no longer speculative gambling they were engaging in daily.
When the opportunity to make easy money disappears, curiosity often fades away.
It was then that I doubled down on learning about Bitcoin and the psychology of the potential investors driving the trading of this asset.
There is a recurring pattern in human behavior, the predictability of which rivals that of Bitcoin halving itself. When the price exceeds $200,000, those friends will flood back into my DMs, asking, 'Is now a good time to re-enter?'
This occurs in every cycle, without exception.
They want glory but do not want to put in the effort. But the wisest approach is to go against the tide when the data shows that a certain field is severely undervalued, even if it feels uncomfortable. Especially when it feels uncomfortable.
We are currently in a market oscillation phase. The data now tells me that the market has not hit the bottom, but rather we are in a severely undervalued market range, and the bottom phase of the bear market may be unfolding.
It is chaotic, frustrating, and slow.
A severe capitulation-style drop may have already occurred. What follows will be a long and painful tug-of-war aimed at making the market feel weary, frustrated, and exhausted until confidence ultimately collapses.
The ultimate winners are not those who precisely time the market lows, but those who understand market principles deeply, can act decisively when the situation is in their favor, and hold on during the collapse of public opinion.
If you’re still in the game, still learning, and resisting the impulse for panic selling, then you are ahead of 99% of market participants. In two to three years, you will be the one laughing last.
Keep going.
This article is translated from @OnChainMind Market Analysis;
Everything is interconnected, and data is king | More Airdrop activities follow #welinkBTC
Focusing on Web3, chain games, AI, and AirDrop investment opportunities 🫙 Monitoring 100 crypto influencers across the network 🔥 Let’s traverse the bull and bear markets together$BNB