
After a wild vertical breakout, the active peg tapped into local profit-taking. The BMT (Bubblemaps) pair shows a corrective red candle on the daily timeframe, but it still holds a strong gain of +57.47% and is trading at $0.03225 (after reaching the day’s high at $0.04361 — with a low of $0.01967 and a previously recorded deep bottom at $0.01087).
What the technical picture on the chart shows:
Corrective move: The red candle indicates a partial profit-taking by traders after the large pump in the previous days.
Trading volumes: Daily turnover remains at a high level — over 79.51 million USDT (with volume of 2.51 billion BMT), indicating that the market’s immense attention to the project persists.
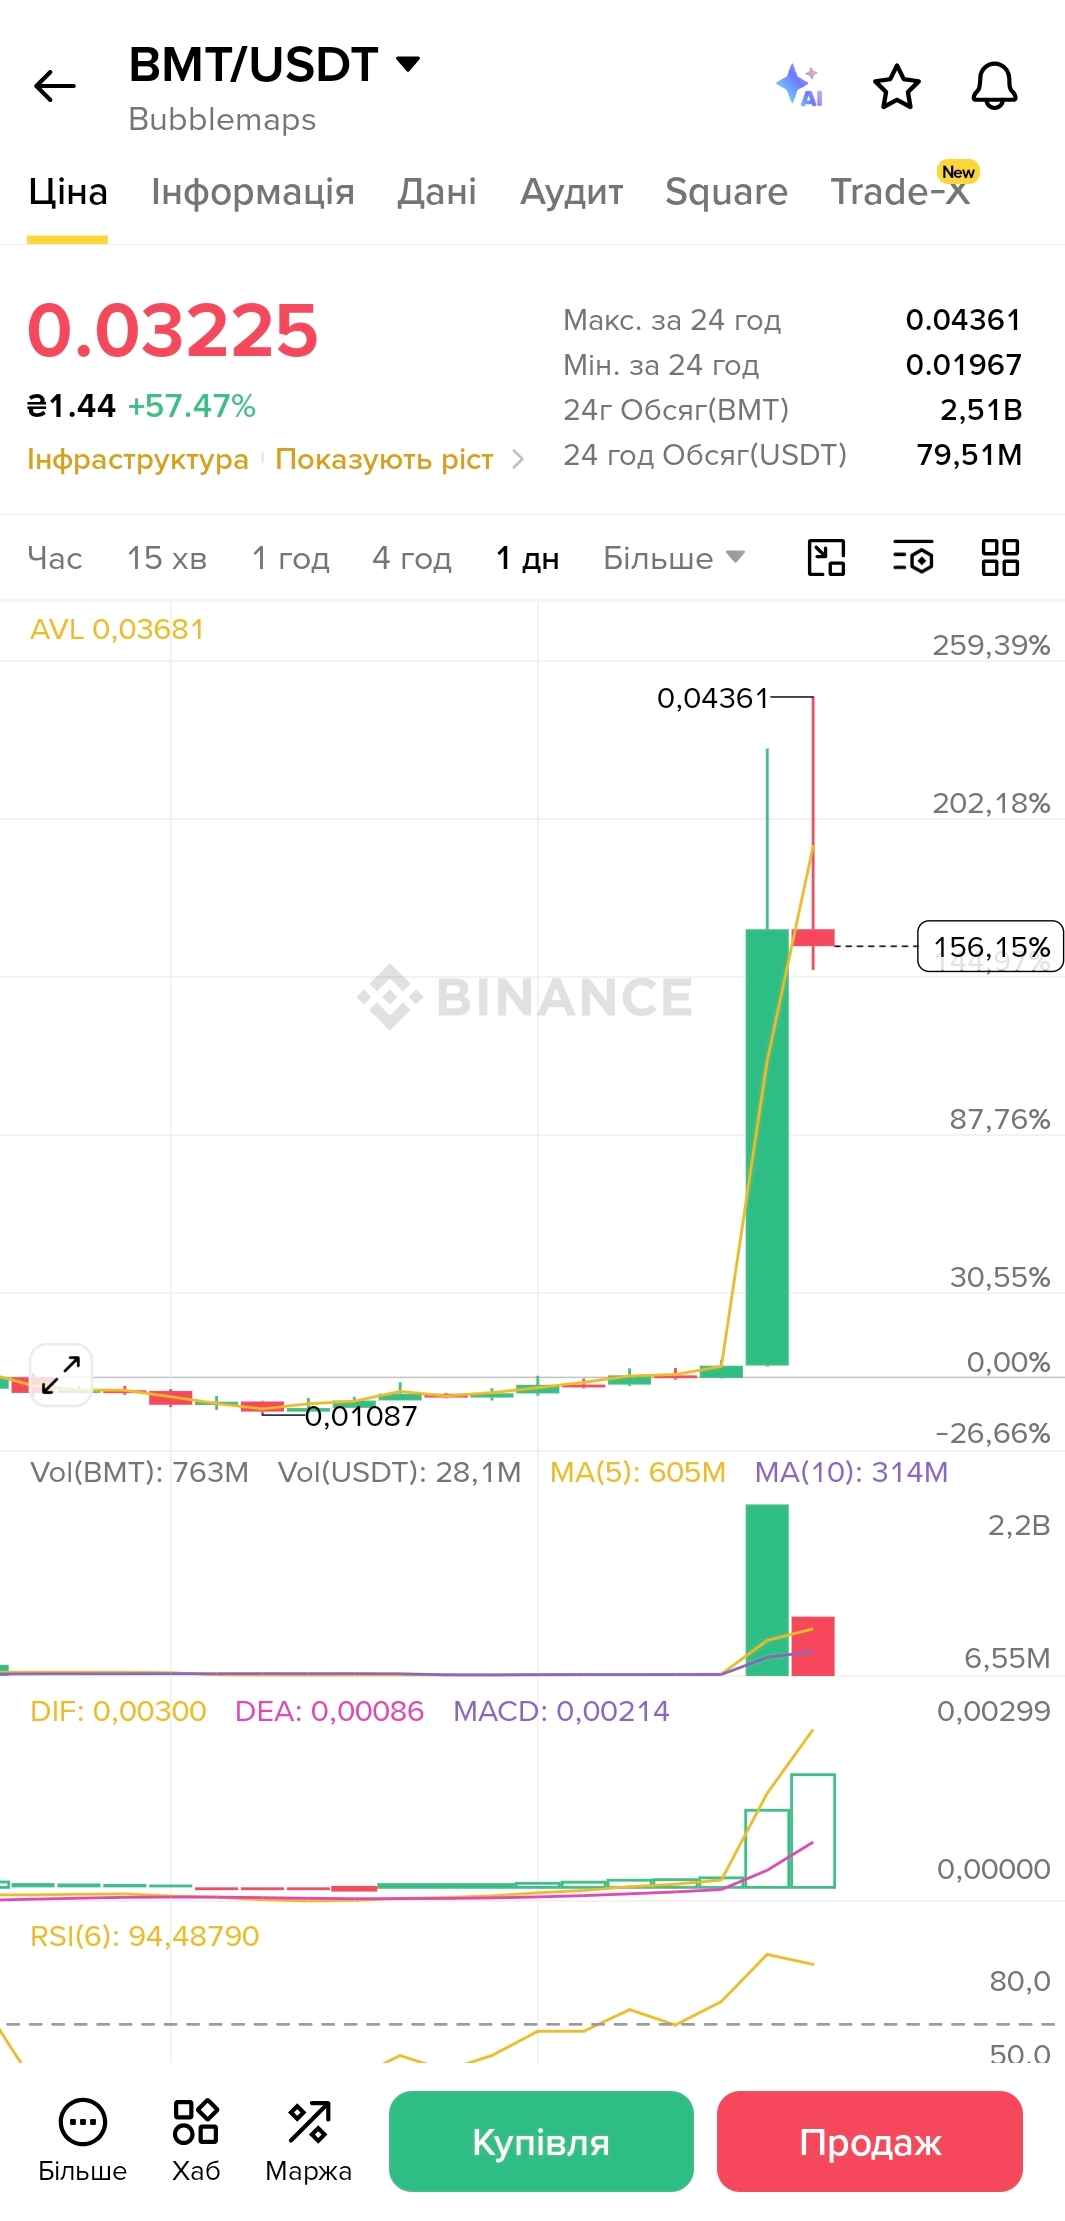
Technical condition: The RSI indicator has cooled slightly to 94.49, moving away from the absolute peak but remaining in a zone of high activity.
⚠️ Volatility remains extremely high, so strictly follow risk management and watch the market’s reaction to support.
📉 How are you responding to this BMT correction? Are you taking profits or holding the asset longer? Share your thoughts in the comments 👇
#BinanceSquare #BMT #Bubblemaps #cryptotrading #altcoins #TechnicalAnalysis


