


Bitcoin's 2025 is often told through the USD chart, a familiar framework reflecting a volatile Q4, as BTC fluctuated wildly over two months of chaos.
Bitcoin's price once surged to around $124,700 at the end of October, before plummeting into the mid-$80,000 range in November, erasing over $40,000 in just a brief fluctuation. This strong volatility led traders to debate whether the market structure remains intact, even as the market attempts to recover from this shock.
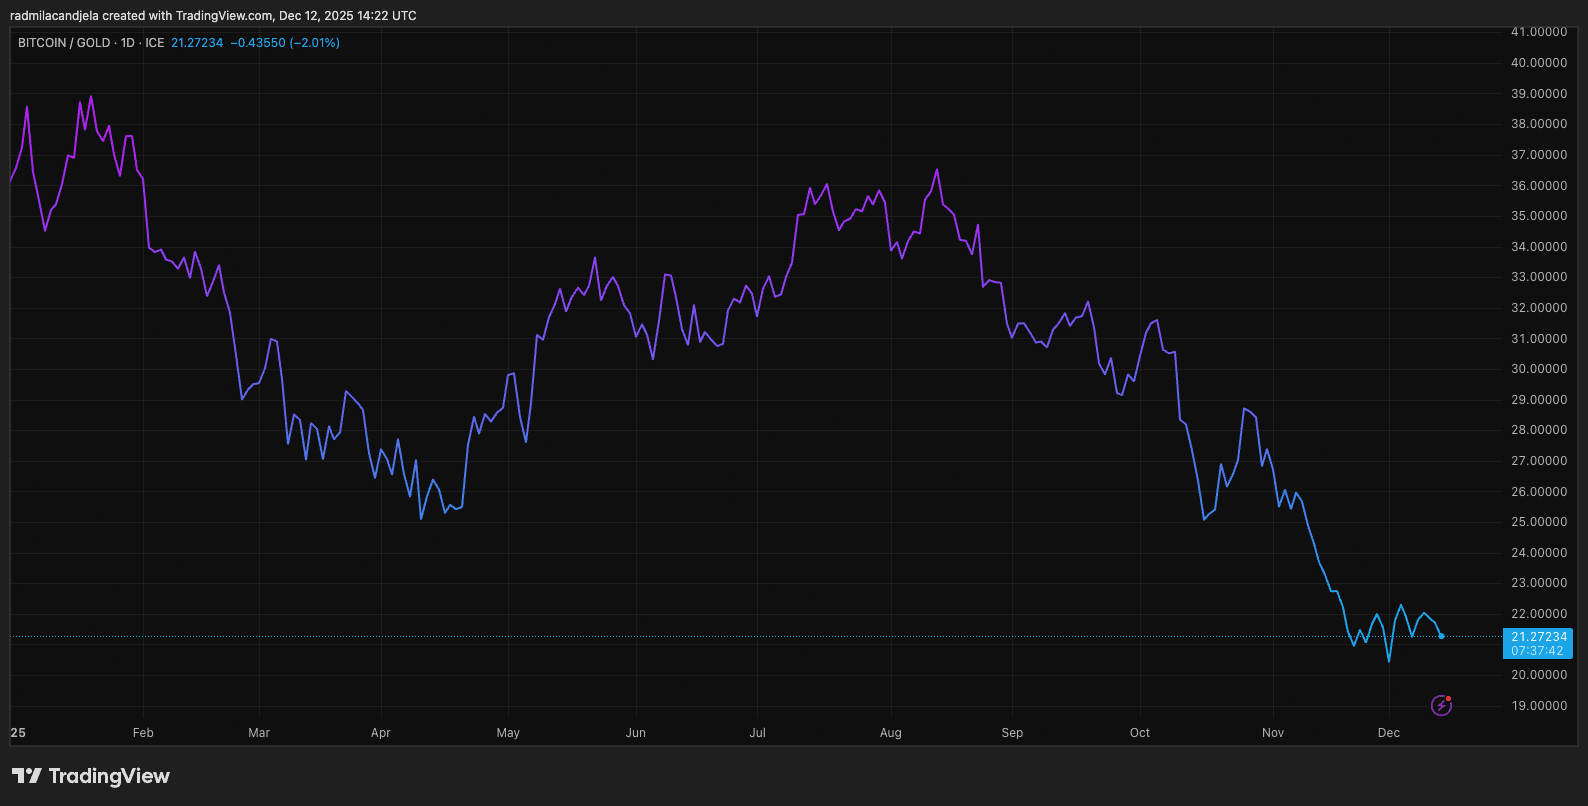
However, if we remove the USD framework and measure the same period in ounces of gold, the picture changes completely. Data indicates a prolonged decline over 11 months, causing the BTC/XAU rate to drop by approximately 45% from the highs of January 12, a structure that remains intact even though prices have slightly increased at the beginning of December.
The bear is 'lurking' on the USD chart
In terms of weekly closing prices, Bitcoin has only decreased about 10% from the beginning of the year in USD. But this figure masks the reality that from peak to present, BTC has experienced one of the most volatile periods of the year: rapidly rising to $125,000, then plummeting to the mid-$80,000 range in just a few weeks.
Even if prices stabilize in mid-December, from $89,348 on December 5 to over $92,300 on December 12, compared to gold, the picture is entirely different: the decline is more than four times greater, lasting nearly a year without significant recovery.
The gap between the volatility according to USD and the sustained weakening compared to gold opens up a broader discussion about 'real yields' for investors who view Bitcoin as a hard asset. Part of this decline in the rate is due to the rise in gold prices as expectations for real interest rates decrease and geopolitical instability drives demand for safe havens.
Even so, a continuous decline rate of 46 consecutive weeks is still an important signal regarding how capital flows assess the risk of hard assets throughout 2025. Even a slight increase of 2–3% in the rate last week did not change the prolonged downward structure since the beginning of the year.
The volatility according to USD in autumn only underscores this: Bitcoin has recovered from the lows of November and increased a few thousand USD within the week, but has never reversed poor performance compared to gold.
Why cross-asset comparisons matter
Comparing Bitcoin to gold rather than USD or any other fiat currency helps eliminate distortions from monetary conditions and policy cycles. It poses a simple question: how many ounces of gold is the market willing to exchange for one unit of Bitcoin? The answer week after week is 'less than before,' and this consistency is more important than any USD fluctuations.
Interestingly, the two separate charts clearly delineate the two natures of Bitcoin:
The USD chart reflects the liquidity-sensitive aspect, influenced by USD cash flows, ETFs, and risk sentiment. The autumn fluctuations are evidence: rapid increases due to leverage, sudden reversals, and fragile recovery efforts.
The XAU chart reflects the hard asset nature of Bitcoin, its ability to hold neutral value and potential for long-term reserves. On this axis, Bitcoin has nearly continuously declined throughout the year, with an insignificant increase in October and a decline in November only extending the trend from the beginning of the year.
Institutional investors often view through a cross-asset framework. They are not only concerned about whether Bitcoin recovers from a sell-off, but also assess it against a basket of reserve assets, hedges, and real assets in the portfolio.
Bitcoin and the 2026 challenge
For Bitcoin to escape the 'lurking' bear measured in ounces of gold, the BTC/XAU ratio must break the 11-month pattern and create new weekly highs, something that has not occurred since January. This requires a combination of Bitcoin's strength and gold's stability, which typically appears when liquidity increases sharply and safe-haven demand decreases.
If gold continues to rise or hold steady while Bitcoin trades in the aftermath of autumn volatility, the BTC/XAU ratio could decline further, widening the gap between USD traders and cross-asset framework allocators.
Overall, the USD chart tells a story of drama and autumn recovery, while the gold chart emphasizes the issue of fundamental trust lasting the whole year. As 2026 approaches, the second chart becomes a simple measure of what Bitcoin needs to prove: strength not only compared to currencies under cyclical policies but also compared to central value stores of institutional investment.
Until this challenge is overcome, the perspective measured in ounces will always remind the market that volatility and long-term trends are two different issues, and the real cyclical signals are truly written in gold.