My crypto people! 🚨 Did you see this? Dogecoin ($DOGE) is juggling right above a support that is the very last floor of its long-term structure. This is not just any bounce; it is a litmus test to see if the party of the last few years is still alive. Get comfortable as I explain what this technical play means that has all the traders glued to their screens! 🧐📈
🐕 Ichimoku: The Guardian Dragon of $DOGE
An analyst who goes by the name Cantonese Cat (the Cantonese Cat! 😹) dropped a bombshell with a monthly chart, and the truth is that $DOGE it is "licking the bottom of its monthly Ichimoku cloud". And what is this Ichimoku thing?
Imagine the Ichimoku Kinko Hyo (full name) as a super technical oracle that uses various lines and a "Cloud" (Kumo) to predict and define trends.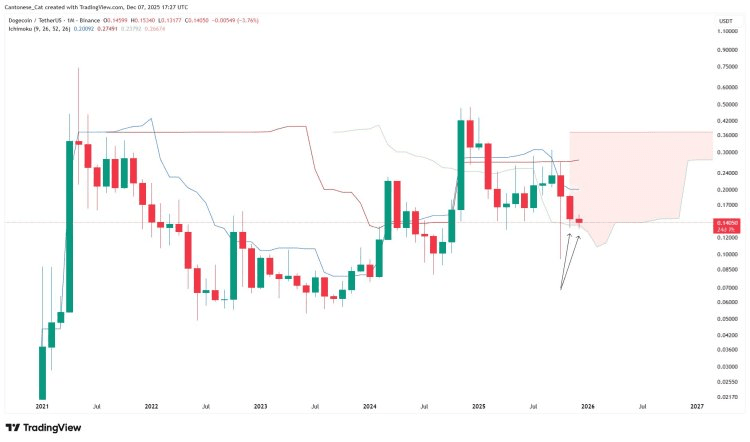
The Cloud (Kumo): This is the most important thing here. It's like the structural ceiling or floor of price action. When the price is within or above, things look good in the long run.
The Critical Detail: Right now, Dogecoin is trading just at the lower edge of that Cloud on the monthly chart, around $0.14. This edge curves into the $0.12–$0.14 zone and, for those who know Ichimoku, this is the final structural support for the long-term growth trend not to break completely.
The message is clear, buddy: as long as DOGE manages to keep its monthly closes above that $0.12–$0.14 zone, we can keep talking about this as a potential long-term bottom and not a free fall. It's a red line that cannot be crossed! 🙅♂️
📉 The Learn and Shrink on the Weekly Chart
But wait, the thing doesn't end there. If we look at the weekly chart, DOGE is also in a key support area, between $0.135 and $0.145.
This area was a tough resistance in the past (a ceiling that wouldn't let the price rise) and has now turned into a support (a floor that stops it). Classic in trading!
The Bad News: The price of DOGE lost an upward trend line (a black line connecting higher lows). Upon breaking that line, it plummeted.
The Compression: Now, DOGE is trapped. Below, it has the red support floor that we are discussing. Above, it has that broken trend line and several Exponential Moving Averages (EMAs, like the 200-week one at $0.15563) that now act as a supply ceiling, as if they are crushing it! 💥
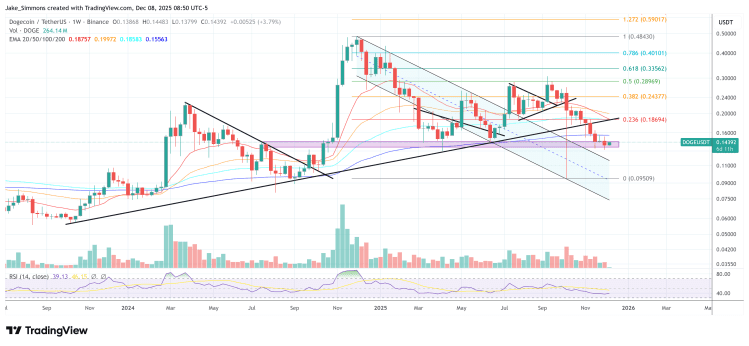
The market is testing this support with brutal aggression, with the candles sticking and crossing that zone repeatedly. The pressure is real and the price is at a breaking point.
🤔 Reflective Close: Epic Resistance or Free Fall?
The crypto community is holding its breath. That $DOGE being at this double support point (monthly Ichimoku and weekly horizontal) is not a coincidence; it is the final battle to define its path. Will we see an epic bounce that uses this area as a launchpad for the next bullish wave, or will the "doggie" fail the test and sink further into the correction mud? What do you think will happen with the most famous meme coin? Is it time to go all in at the bottom, or to wait and see if it breaks through the cloud? 👀$DOGE
