1. Major Breakdown Completed
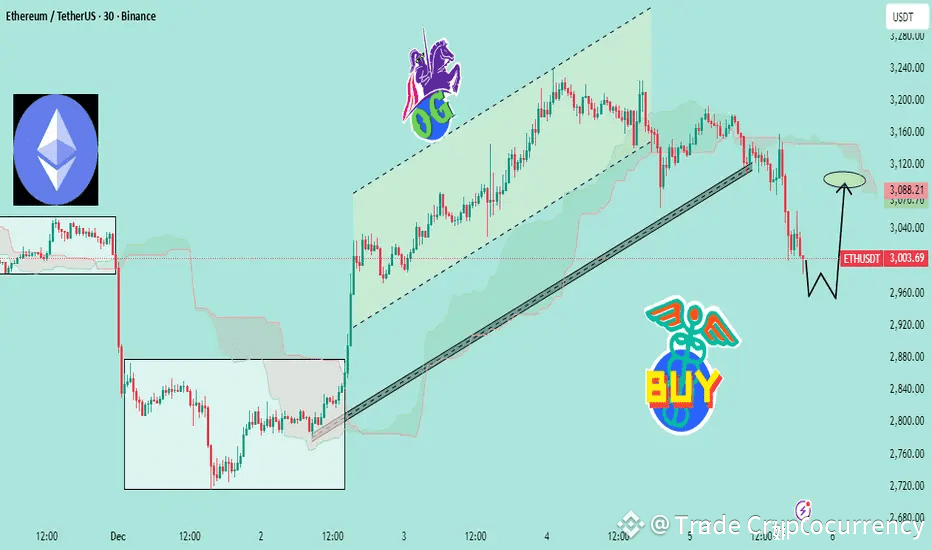
ETH formed a sharp sell-off leg, moving along the long diagonal trendline you drew.
This indicates strong downside momentum that has now reached exhaustion near the bottom zone.

2. Price Tapped a Key Demand Zone
The lower green/grey area marks a high-volume demand block.
ETH reacted strongly from this zone, showing:
A wick rejection
Shift in market structure
Buyers absorbing the remaining liquidity
This confirms the zone is valid.
3. Liquidity Grab at the Lows
That spike below the structure (where you marked the “M-shaped” dip) looks like a classic stop-hunt / liquidity sweep.
After grabbing liquidity, ETH bounced aggressively.
This is usually a sign of smart-money accumulation.
4. Early Trend Reversal Signals
The small bullish rally forming now suggests:
Momentum is shifting
Bears are losing control
ETH might build a new short-term uptrend from this area
Trade at your own Risk 👍
Best Regards, Trade Cryptocurrency
Stay Tuned for Further Updates.