
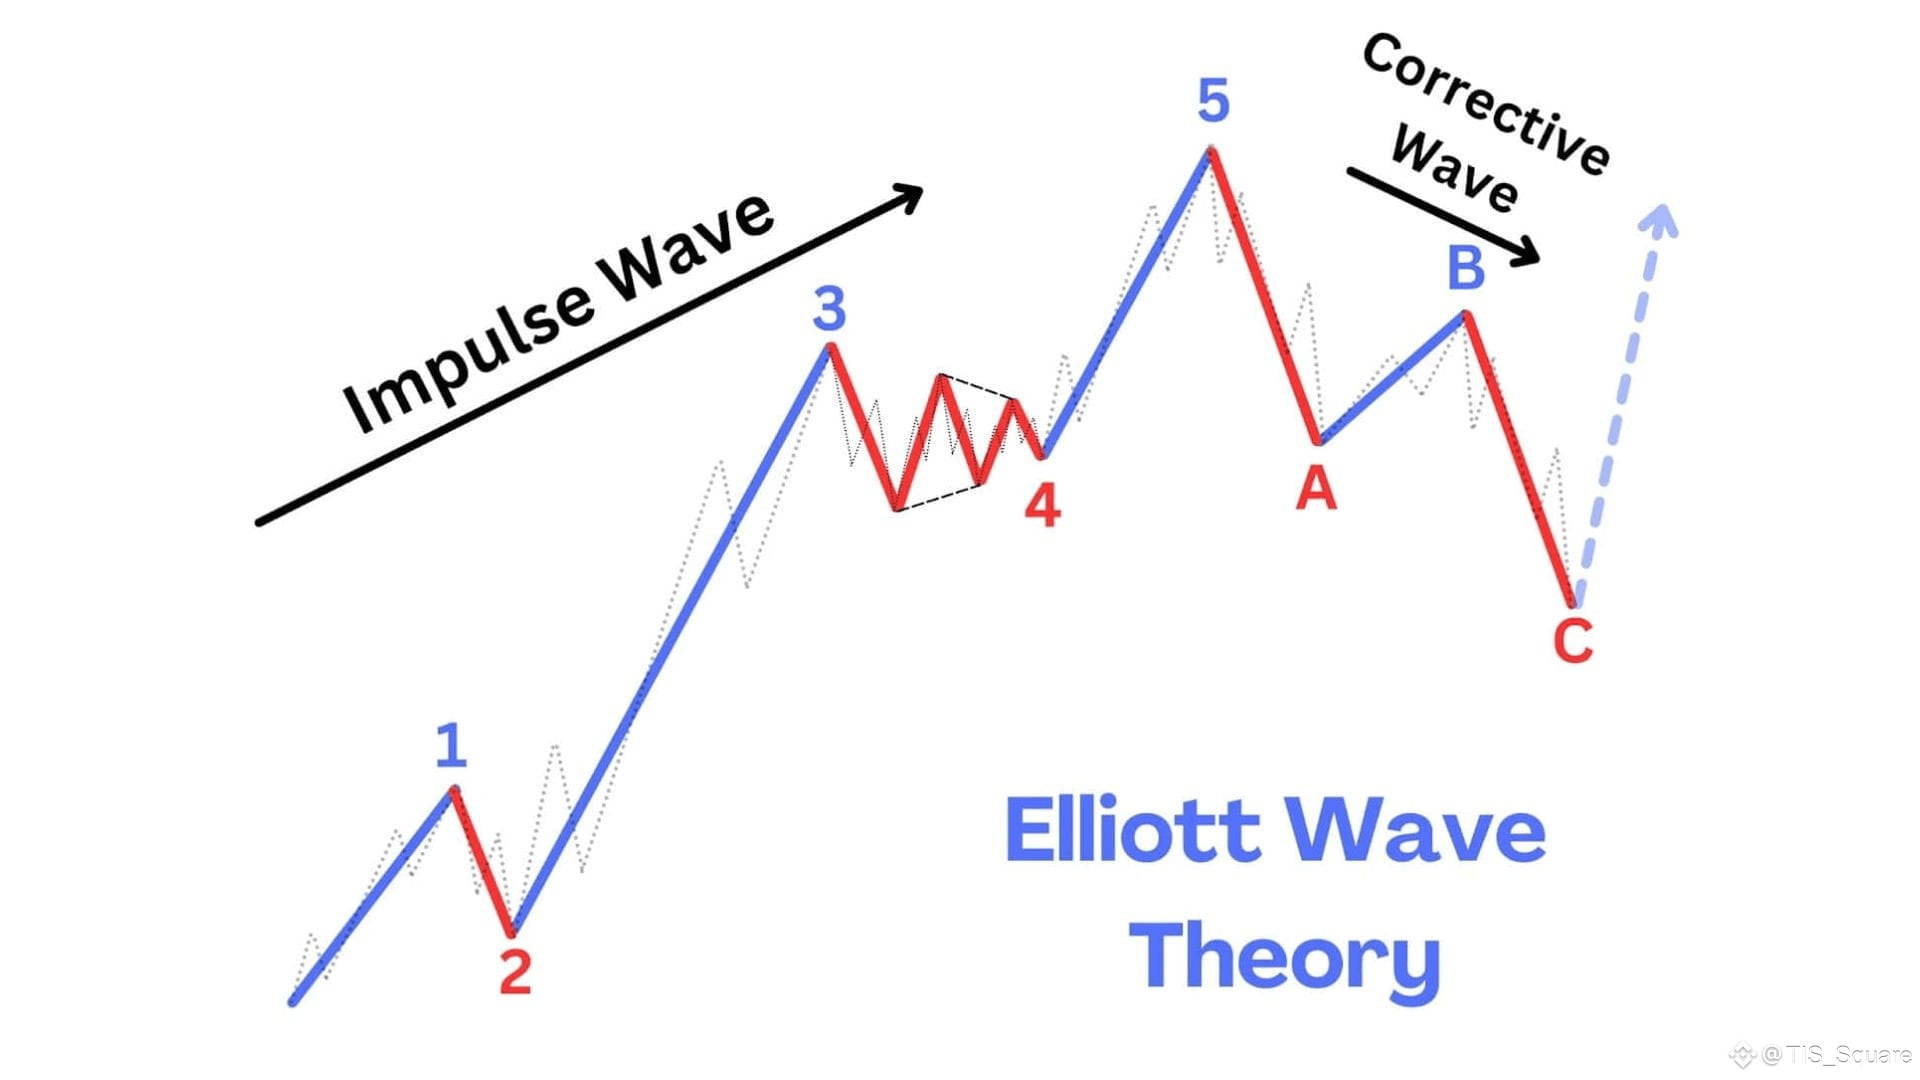
Elliott Wave theory is dubbed one of the most comprehensive and complex technical analysis tools helping traders deeply understand the structure and crowd psychology behind every price fluctuation
🔹 A complete growth cycle always includes 5 impulse waves numbered from 1 to 5 in which
Waves 1, 3 and 5 are impulse waves following the main trend representing the excitement of the buyer
Waves 2 and 4 are counter trend correction waves that help the market accumulate energy and shake off weak investors before the next explosion
🔸 In most cases, wave 3 is always the strongest, longest wave and brings the biggest profit because
This is when the crowd recognizes the trend and FOMO money starts pouring in massively, causing the price to run vertically
So those who know how to patiently wait for the entry point after wave 2 ends will eat the best part of the fish
🔹 After the 5-wave impulse cycle ends, the market will enter a painful ABC correction phase and this is when most of the profits of FOMO investors who bought the peak of wave 5 are wiped out
When wave A creates the illusion of just a slight correction
Wave B is a Bull Trap
Wave C is a crash confirming a bear market
🔸 To correctly identify the wave, you must adhere to the iron rules
Like wave 2 must not decrease beyond the starting point of wave 1
To preserve the bullish structure
Wave 3 is never the shortest wave
To ensure momentum and wave 4 must not enter the price zone of wave 1
Because to avoid violating the overlapping principle
🔹However, wave counting is highly subjective and each person can see a different scenario. Depending on the time frame and experience, never go all in. Do not rely on only one way of counting waves, but always have a backup scenario and manage capital strictly
Have you ever ridden the explosive wave 3 or been stuck in the painful corrective wave C?