

In the past week, Ether (ETH) has recorded superior growth compared to Bitcoin (BTC), both in price movement and cash flows into ETFs, thereby reinforcing the capital rotation story in the market. In just the past two weeks, ETH spot ETFs have attracted net inflows of up to $360 million, three times the $120 million of BTC, reflecting a marked change in the market's investment appetite.
Investors are actively selling and accumulating Ether, but the risk of a correction remains
According to data from CryptoQuant, the average order size index in the spot market shows a significant shift in Ether trading behavior. When ETH dropped below the $2,700 threshold on November 21, buying pressure from individual investors surged, driving a recovery based on real demand. This development is reminiscent of previous accumulation phases, particularly from March to May, when retail investor buying activity often appeared before a deeper correction.
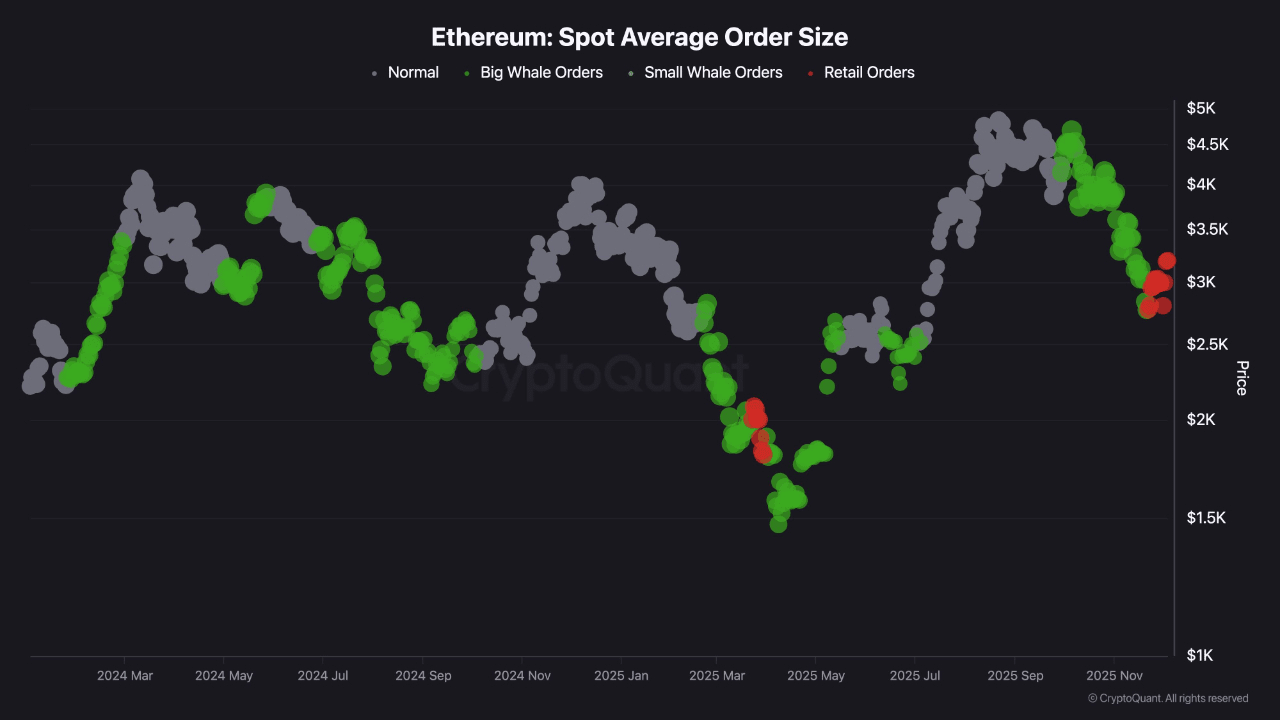
Market history shows that recoveries led by individual investors at bottom zones are often challenged for liquidity, aiming to shake out late buyers before a true uptrend is established. This means that ETH may still undergo a controlled correction to rebalance positions, preparing for a more sustainable growth cycle in the future.
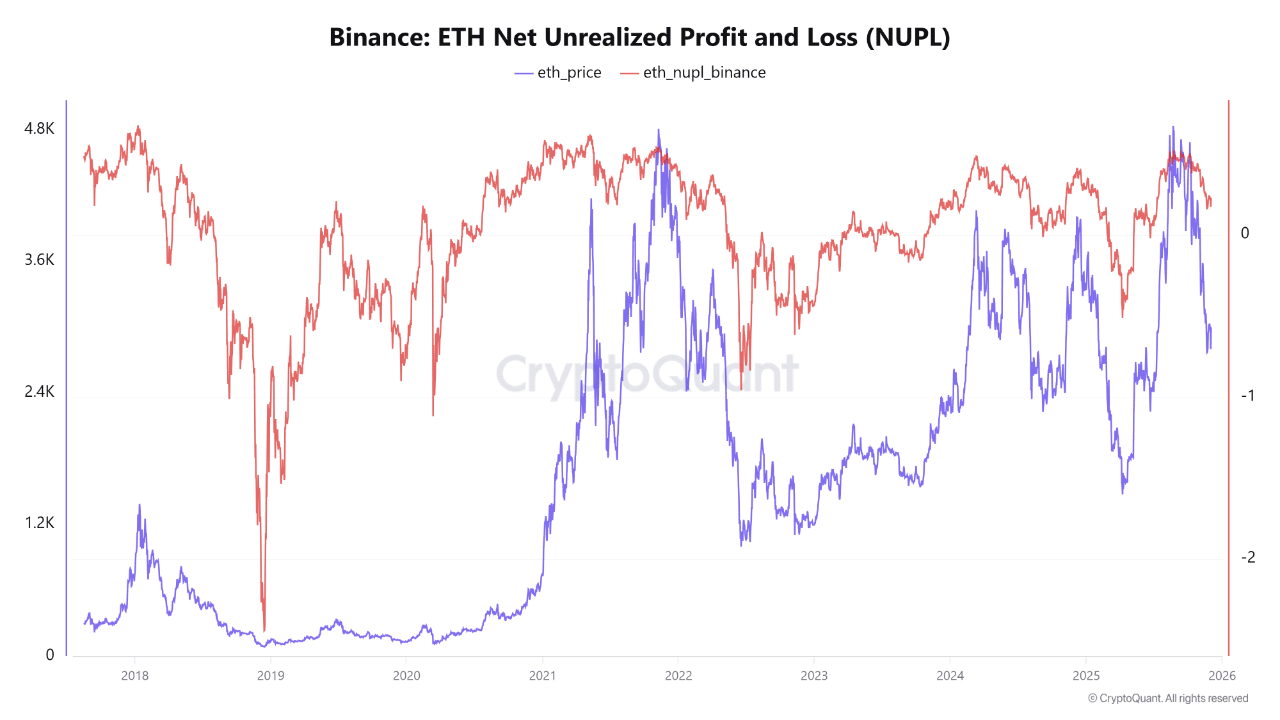
Currently, the net unrealized profit/loss (NUPL) of Ether is around 0.22, reflecting a balanced market state, as investors are still making moderate profits without falling into an overly excited state.
Notably, NUPL has not yet fallen into the negative zone, indicating that investors maintain a strong mindset, thus minimizing the risk of additional selling pressure. As long as NUPL stays above 0.20, market sentiment will continue to support a recovery when the right driving factors emerge.
ETH is temporarily ahead of Bitcoin
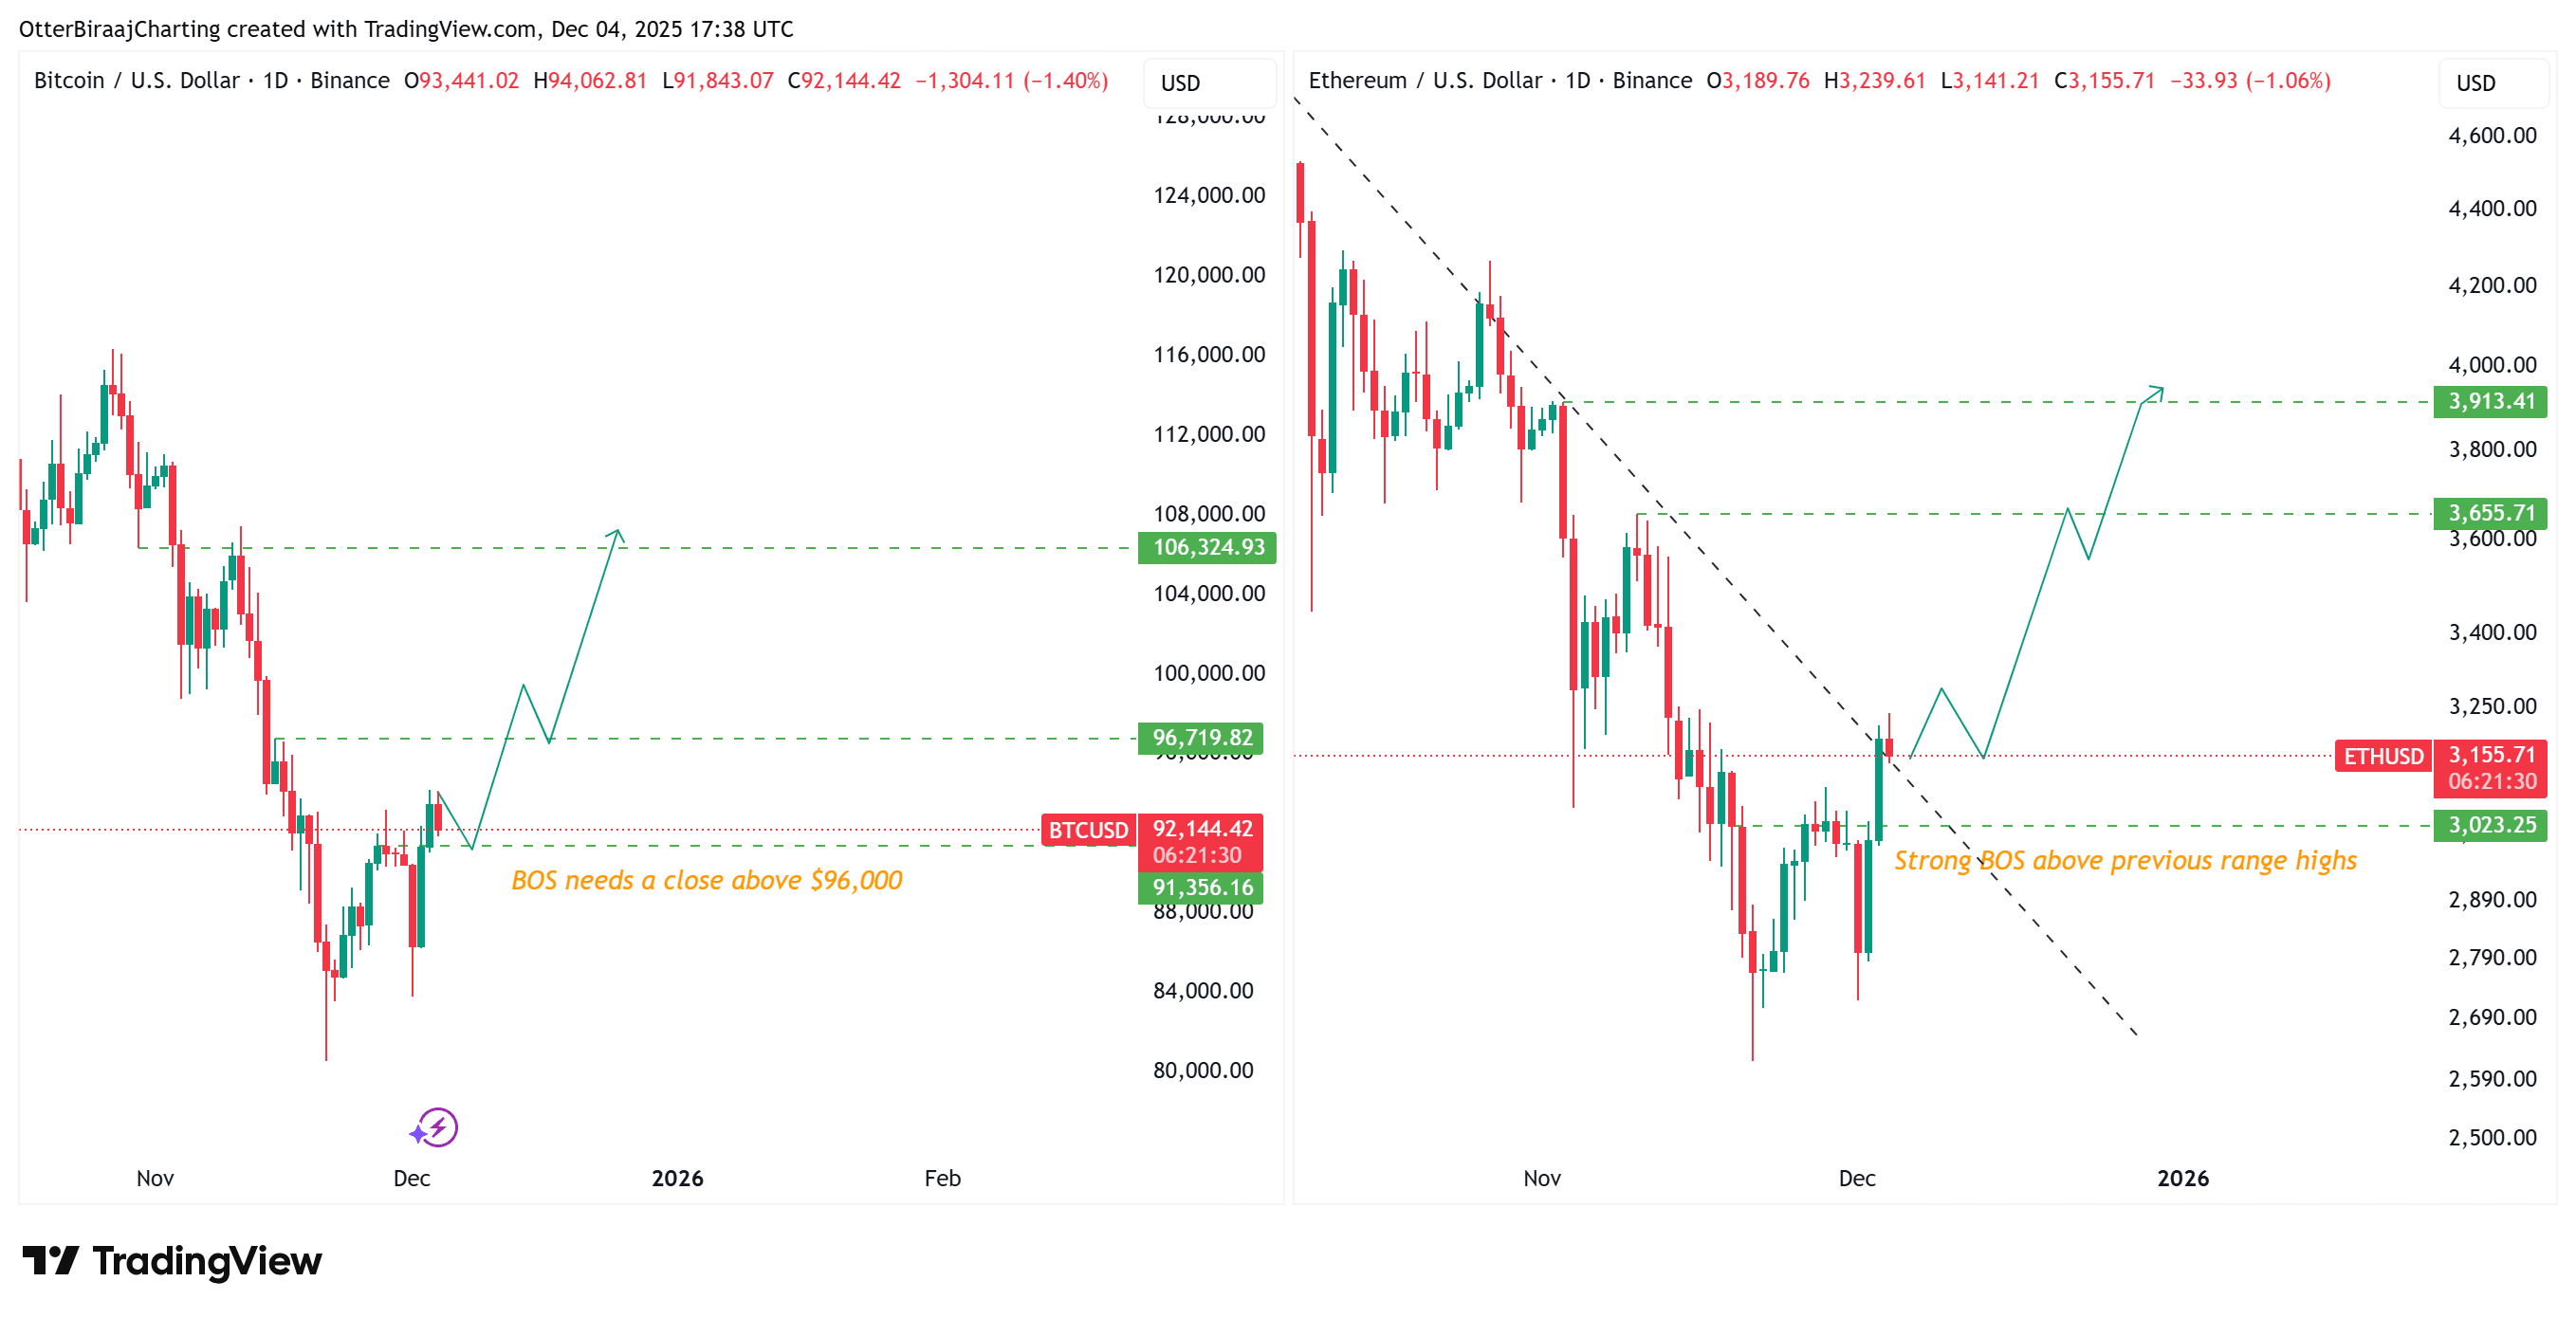
Technically, Ether is exhibiting a clearer and more positive large timeframe (HTF) pattern compared to Bitcoin. ETH has just confirmed a breakout structure (BOS) when it exceeded the 20-day high above $3,200, indicating that buying has transformed the previous resistance level into support, opening opportunities for a new uptrend.
In contrast, Bitcoin still needs a daily close above $96,000 to confirm the breakout, which means ETH is currently holding a structural advantage.
The ETH/BTC exchange rate chart on the daily timeframe reinforces this advantage as the pair has just surpassed a 30-day accumulation zone - where supply has continuously limited upward efforts. This breakout is further supported by a successful test of the 200-day simple moving average (SMA), which has been a solid support level since July. In the past, when ETH/BTC reclaimed the 200-day SMA and broke through the prolonged accumulation zone, it often signaled a phase of ETH outperforming.
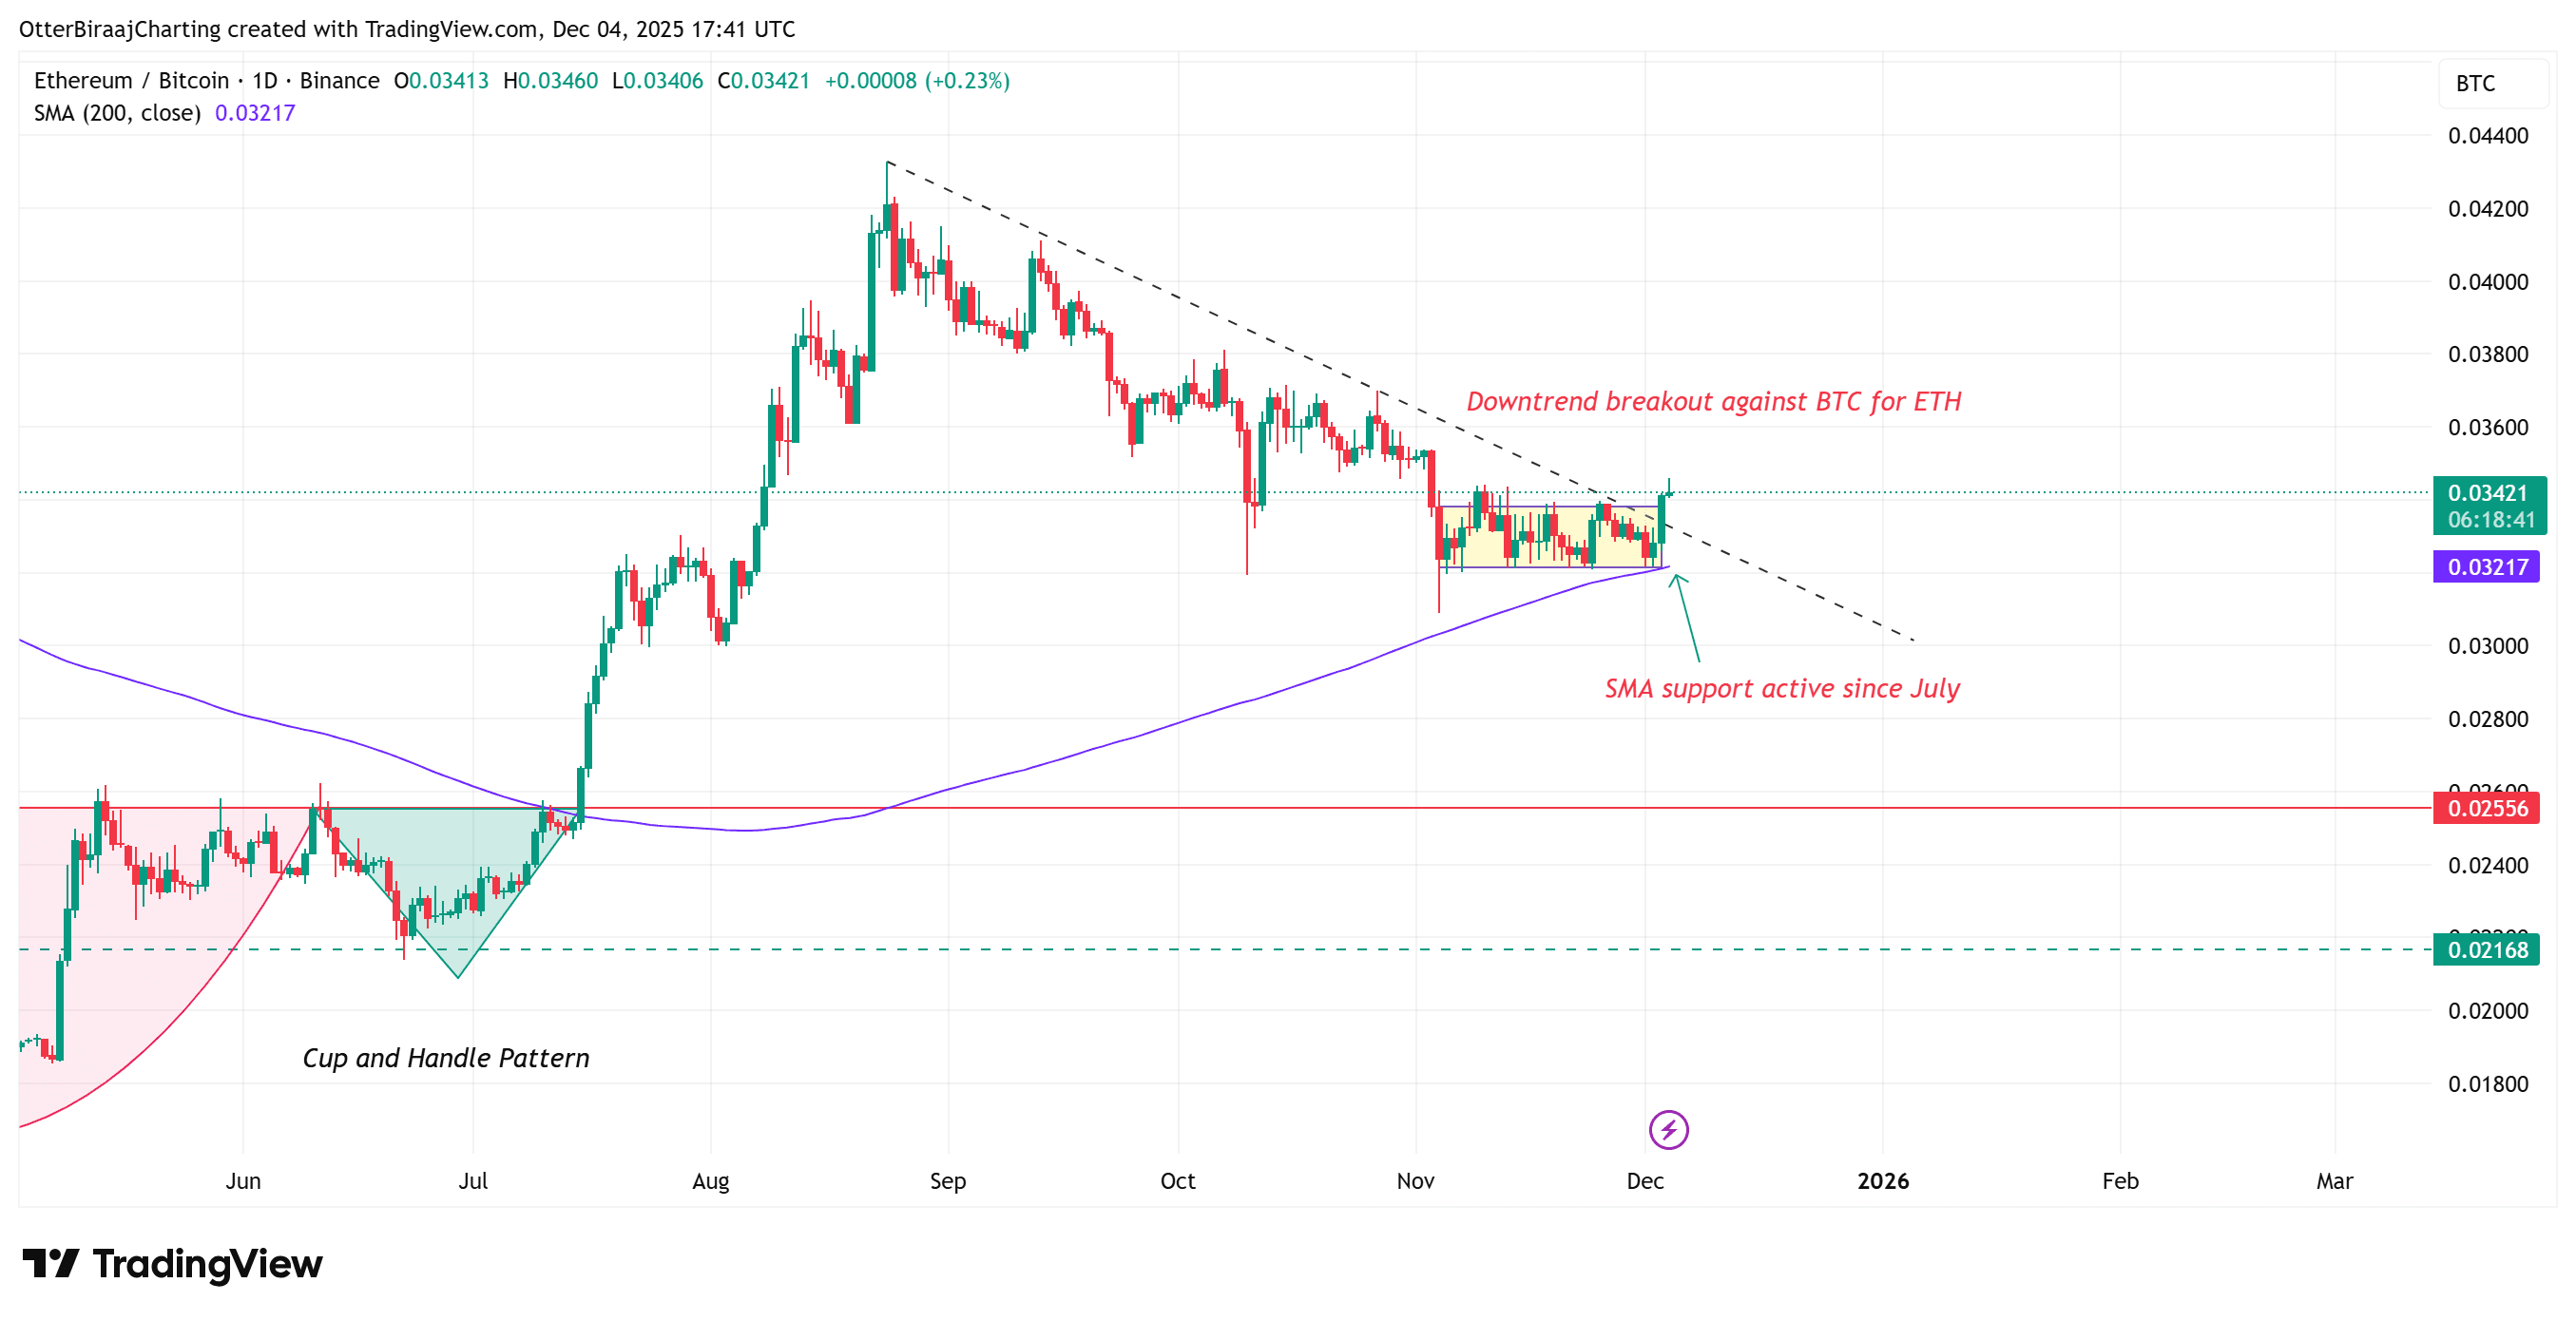
If Bitcoin remains stable above $94,000 and can close above $96,000, selling pressure on altcoins will significantly decrease. At that point, ETH will be well-positioned to continue expanding its uptrend by retesting the swing high of $3,650, and if momentum continues to be sustained, the next target will be the $3,900 expansion zone - which is an increase of about 20% from the current price, where large liquidity clusters are concentrated.