Bitcoin hovered between $105,000 and $110,000 in October 2025, with the market focused on whether the "4-year halving bull" pattern observed over the past 15 years is still valid
This article analyzes when the bull market will end from three dimensions: historical cycle deconstruction, current market diagnosis, and core variable analysis

01. Historical Review: The Truth and Deconstruction of the 4-Year Cycle
1. Cornerstone of the Cycle: Bull and Bear Cycles under the Halving Mechanism
Since its inception in 2009, Bitcoin has formed a strong binding 4-year cycle closely related to the 'halving event'—the mining rewards are halved every four years (block rewards decrease from 50BTC to 25BTC, 12.5BTC, 6.25BTC, and after the fourth halving in 2024, it will be 3.125BTC), causing prices to soar due to supply contraction, followed by a deep bear market, creating a complete cycle.
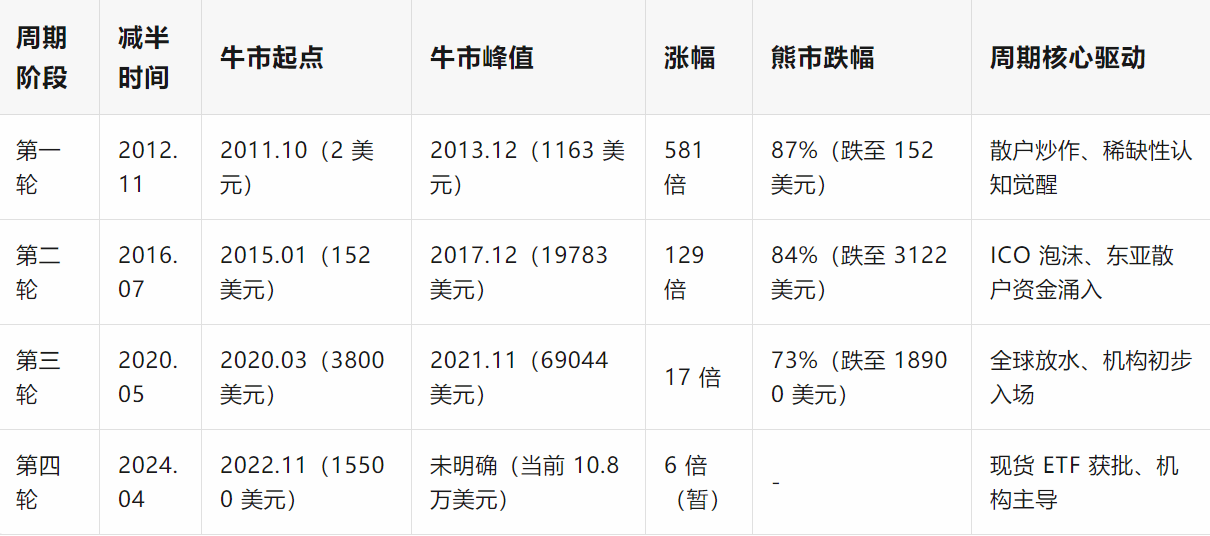
Data shows that the previous three cycles exhibited the pattern of 'peaking 12-18 months after halving': the peak was reached 13 months after the halving in 2012, 17 months after the halving in 2016, and 18 months after the halving in 2020.
If this pattern is projected, after the halving in April 2024, the bull market peak should appear between May and October 2025, but by the end of October, Bitcoin has not shown clear peak signals, instead entering a high-level sideways phase, indicating a qualitative change in cycle logic.
2. Signs of cycle malfunction: Narrowing gains and structural changes
Compared with the previous three bull markets, the current cycle has shown significant divergence:
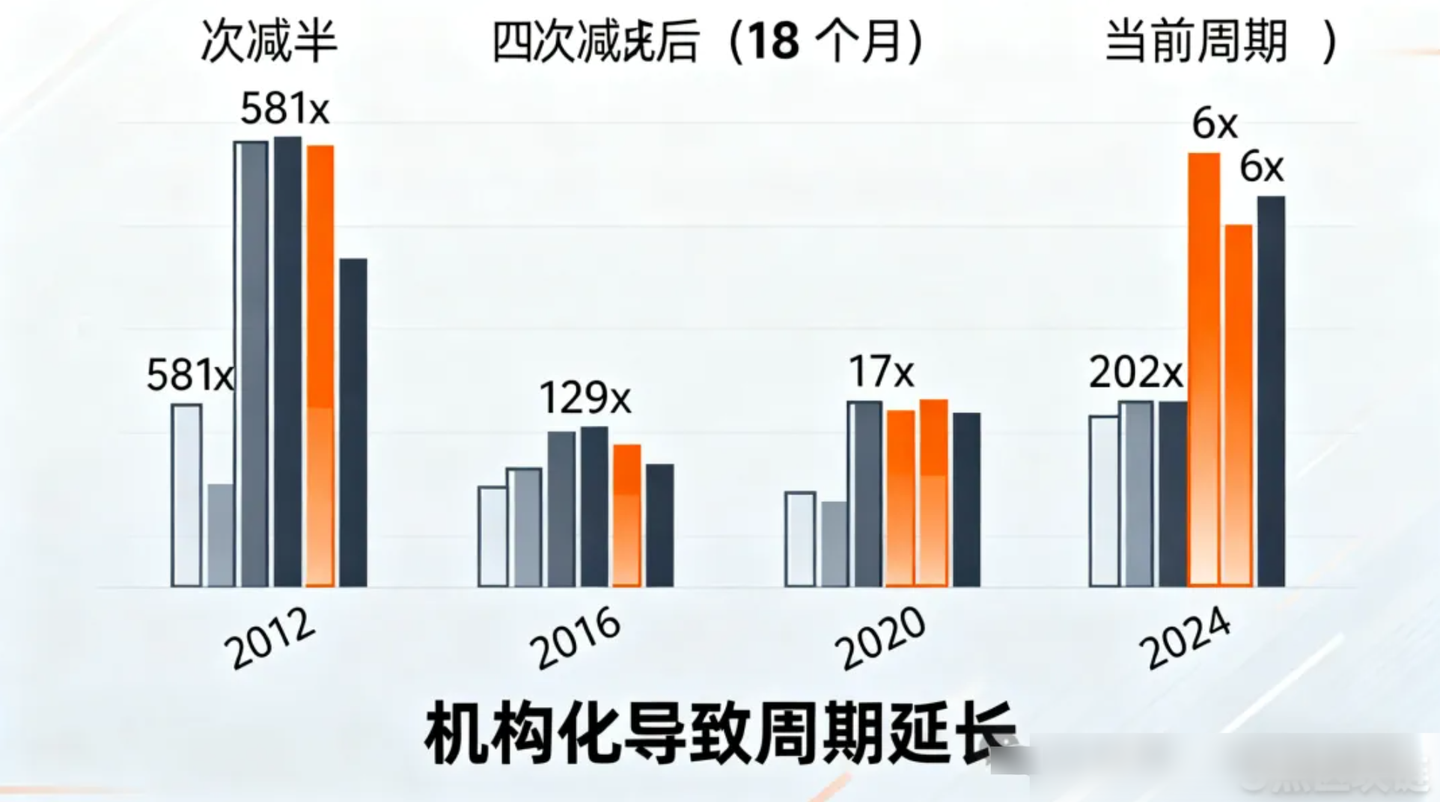
Significant shrinkage of gains: The gains of the previous three bull markets reached 581 times, 129 times, and 17 times, while the current market has only increased 6 times since the bottom at the end of 2022, and the gain in the 18 months after halving is only 18%, far below the average gain of over 100 times after the previous halvings.
Peak delay: According to historical rhythm, by October 2025 it should have entered the early stage of a bear market, but currently remains above the high level of $100,000.
Mild pullbacks: In the previous three bull markets, at least two pullbacks of more than 30% occurred, while this time, since breaking through $60,000 in January 2024, the maximum pullback was only 22% (from $112,000 to $87,000 in June 2025), and it quickly regained lost ground.
Behind these changes is a fundamental shift in the dominant force of the market from 'retail clusters' to 'institutional capital'.
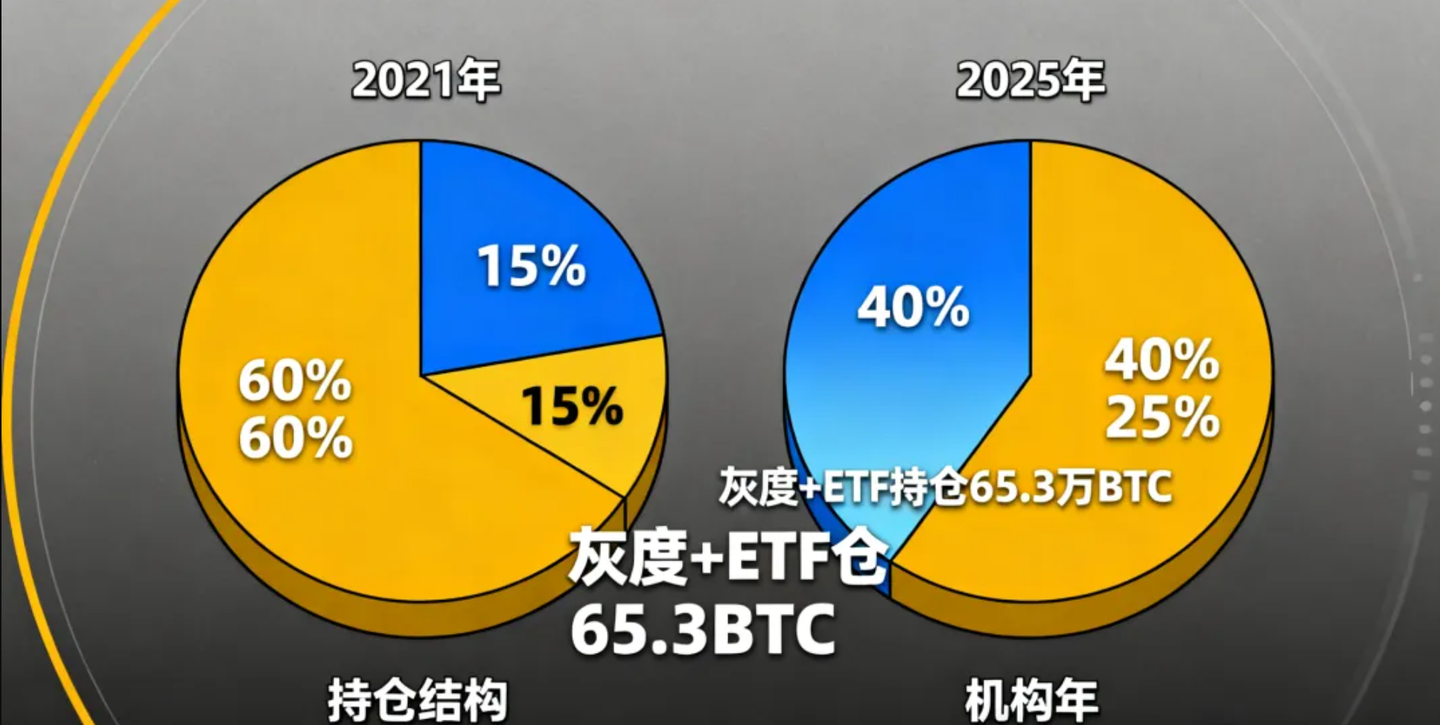
In the previous three bull markets, East Asian retail investors contributed over 70% of trading volume, while currently North American institutions hold a total of Bitcoin amount that has reached 35% of circulation. The scale of spot ETF holdings has exceeded $80 billion, accounting for 3.2% of Bitcoin's total market value, and institutional long-term allocation demand has smoothed short-term volatility, extending the bull market cycle.
02, Current market diagnosis: Bull-bear game under high-level sideways
1. Technical aspects: Key supports and risk signals coexist
Bitcoin's current technical structure shows characteristics of 'long bull structure + short-term pressure':
Core support level remains strong: the 50-week moving average (approximately $102,800) has continuously provided effective support since Q1 2023, and the weekly closing price has never fallen below this moving average, becoming the 'lifeline' for the continuation of the bull market; the range of $98,000 - $100,000, combined with the previous oscillation platform and the 200-day moving average, forms multiple supports. Analyst Colin believes this area is the 'reasonable bottom for this bull market'
Short-term risk signals emerging: The weekly chart forms an 'ascending wedge' pattern, which is a typical bearish reversal signal—the previous two occurrences of this pattern were in January 2018 and November 2021, both of which triggered declines of more than 30%. The current wedge convergence range is $105,000 - $112,000, and the probability of downward breakout increases after an invalid breakthrough.
Volume contraction warning: The average daily trading volume in October decreased by 28% compared to September, and by 42% compared to the peak in April 2025. The divergence between price and volume shows insufficient buying momentum, and the market enters a 'passive holding' phase.
Comprehensive technical indicators suggest that Bitcoin is in the 'consolidation phase at the end of the bull market': the long-term upward channel (the trend of rising lows formed since November 2022) has not been broken, but short-term pullback pressure is increasing. A key turning point may occur in mid-November—if the $100,000 support level breaks, it may trigger a deep pullback of 15%-35% (target range $85,000 - $90,000); if the support holds and breaks above $112,000, a final sprint to $130,000 - $150,000 may be initiated.
2. Capital aspects: Institutional holdings and liquidity-driven logic
The current market capital flow shows three major characteristics, revealing that the bull market has not ended:
Institutions continue to increase their holdings: Grayscale Bitcoin Trust (GBTC) increased its holdings by 12,000 BTC in October, bringing the total holdings to 653,000 BTC; the proportion of North American pension accounts allocated to Bitcoin has increased from 0.5% in 2023 to 2.3% in 2025, with long-term capital entering the market offsetting short-term selling pressure.
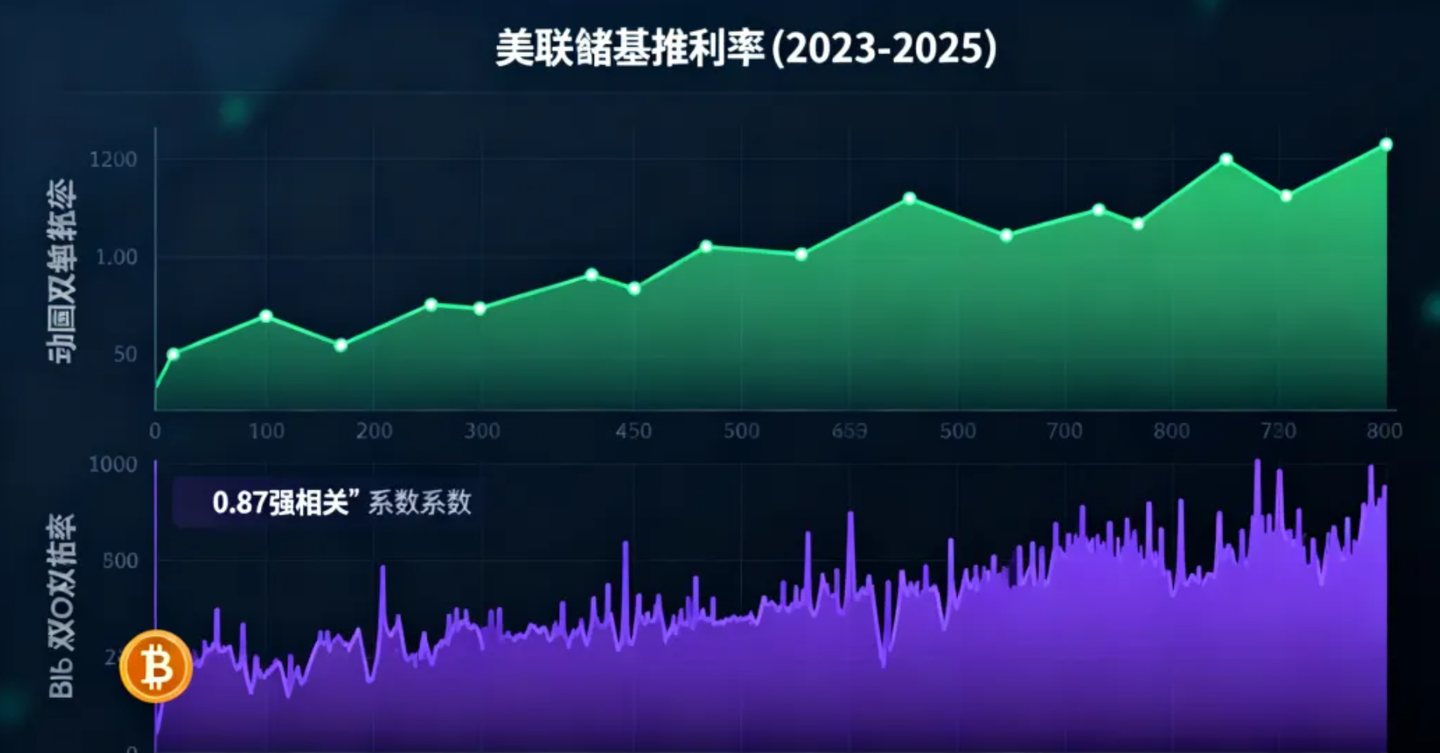
Global liquidity easing support: The Federal Reserve began a rate-cutting cycle in March 2025, cumulatively cutting rates by 75 basis points, with the dollar index falling to a low of 92; the Bank of Japan maintains a negative interest rate policy, and the People's Bank of China has released liquidity through targeted reserve requirement ratio reductions. The global funding environment is easing, providing support for risk assets. Analyst 'Crypto Master' points out that the current Bitcoin trend has a correlation of 0.87 with global M2 growth rate, far exceeding the correlation with halving events (0.32).
Derivatives market sentiment is neutral: Bitcoin futures open interest reaches $28 billion, at historical median; perpetual contract funding rates remain in the range of 0.01%-0.03%, neither extremely bullish (>0.05%) nor extremely bearish (<-0.05%), indicating little market divergence, and no bubbles have appeared.

Capital data indicates that institutional capital's 'allocation demand' has replaced retail's 'trading demand', becoming the dominant force in the market.
This shift brings Bitcoin closer to the 'digital gold' attribute from a 'high-volatility speculative product', significantly lengthening the bull market cycle and also resulting in milder pullbacks.
03, Cycle reconstruction: 4 years becomes 5 years? Bull market end time deduction
1. Core variables: Three key factors breaking the cycle
The reason the traditional 4-year cycle may fail is primarily due to the structural changes of the three major variables:
Variable one: Institutional restructuring of market ecology: In the previous three bull markets, retail investors accounted for over 60%, exacerbating volatility through chasing and killing. Currently, institutions account for over 40%, mainly with long-term positions (the average holding period of ETF positions is 14 months), greatly enhancing capital stability. Senior trader Bob Loukas points out, 'The change in participant structure has reduced the cycle's elasticity, and the bear market may delay until Q2 2026, with the pullback magnitude possibly narrowing to 50%-60%, rather than the historical 80%'
Variable two: Global economic cycle extension: Governments around the world have extended economic cycles through debt extensions and quantitative easing. The U.S. business cycle has extended from the historical average of 3.5 years to the current 5.2 years, and liquidity stays longer in the financial system. This causes Bitcoin's 'liquidity-driven cycle' to extend in sync, and the bull market is no longer limited to the 18-month window after halving.
Variable three: Regulatory framework maturing: The U.S. SEC approves spot ETFs, the EU MiCA legislation is implemented, and Singapore's cryptocurrency regulatory framework is improved. Global cryptocurrency regulation has shifted from 'prohibition and suppression' to 'normative development', reducing the black swan risk caused by policy uncertainty. In 2025, the frequency of global cryptocurrency regulatory policy issuance decreased by 60% compared to 2021, and market expectations have become more stable.

Based on these variables, some analysts have proposed the '5-Year Cycle Theory': the Bitcoin cycle has extended from 4 years to 5 years, with the next peak expected in Q2 2026 (24 months after the fourth halving). The end of the bull market is expected to be pushed back to Q3 2026, about 12 months later than the traditional cycle.
2. Two scenarios: the time and path of the bull market's end
Considering the current market conditions, the end of the Bitcoin bull market may present two scenarios:
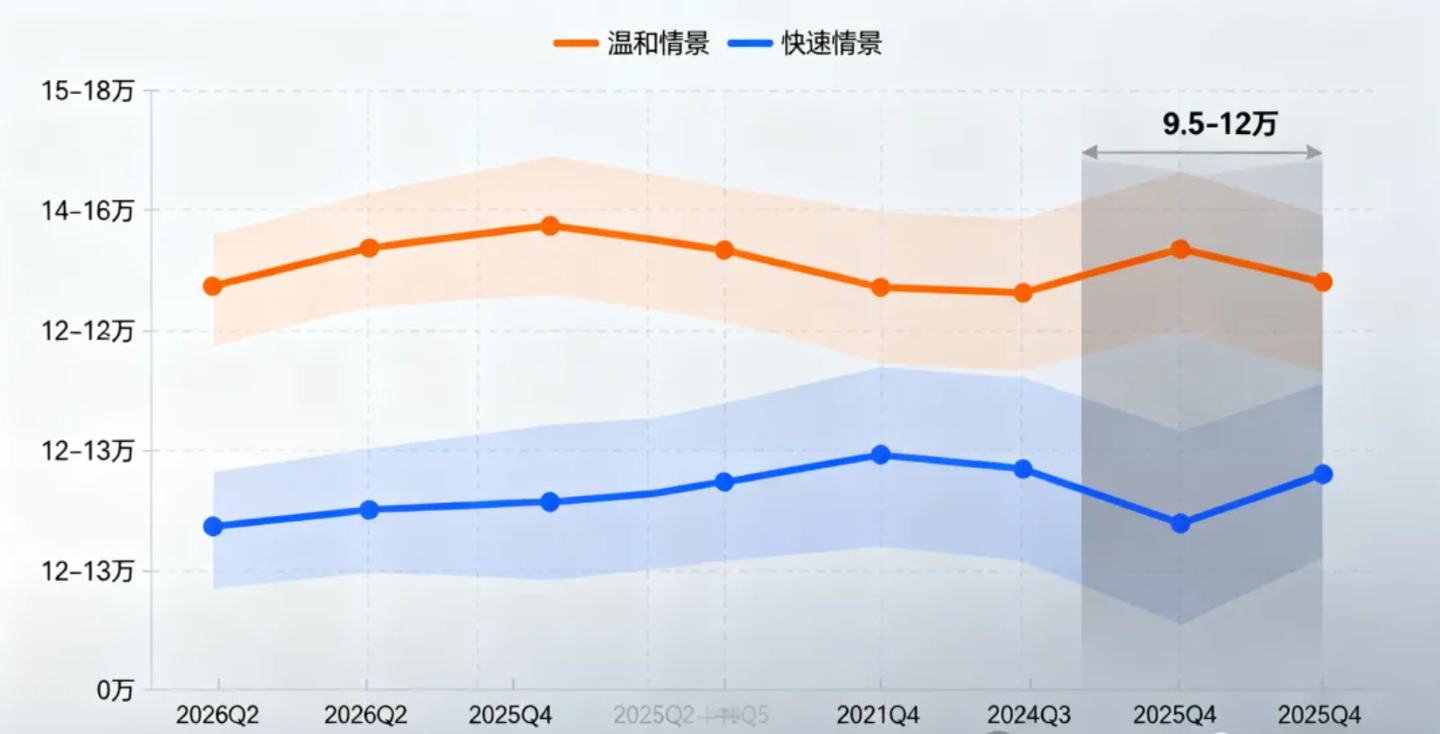
Scenario one: Moderate ending (probability 60%)
End time: Q2-Q3 2026, corresponding to Bitcoin price peak of $150,000 - $180,000
Key trigger points: The Federal Reserve restarts interest rate hikes (inflation rebounds to over 4%), institutional ETF fund net inflows turn negative, Bitcoin's share of total cryptocurrency market cap drops below 40%
End of 2025 market trend: November pulls back to $95,000 - $100,000, December oscillates back up to $110,000 - $120,000, with an annual increase of about 80% (compared to $60,000 at the end of 2024)
Logical support: Global liquidity easing continues until Q1 2026, institutional allocation demand is not yet saturated, and the technical upward channel remains intact.
Scenario two: Rapid end (probability 40%)
End time: End of Q4 2025 - early Q1 2026, corresponding to Bitcoin price peak of $120,000 - $130,000
Key trigger points: Technical upward wedge breakdown, tightening of regulatory policies (such as U.S. restrictions on ETF holdings), global financial market turmoil (stock market crashes triggering liquidity crunch)
End of 2025 market trend: November breaks below the $100,000 support level, triggering a chain of stop-losses, December falls to $80,000 - $90,000, with an annual increase of about 50%
Logical support: Historically, the probability of a pullback after the 'ascending wedge' pattern breakdown is 80%. Current insufficient volume makes it hard to support a breakthrough, and year-end liquidity return pressure increases.
The core divergence between the two scenarios lies in whether 'global liquidity will tighten in advance' and whether 'institutions will continue to increase their holdings'.
If the Federal Reserve maintains its rate cut expectations in December 2025, and ETF net inflows remain above $1 billion per month, the moderate ending scenario will become mainstream; conversely, if inflation data exceeds expectations or black swan events occur, the rapid ending scenario may be triggered.
04, Outlook for the market at the end of 2025: Key games in the next two months
1. November: Turning point window, support level determines direction
November will become the 'watershed' for the 2025 market, with two major events to focus on:
Technical turning point: In mid-November, the 50-day moving average (currently $105,000) and the 200-day moving average (currently $98,000) may form a 'death cross'. Historical data shows that after the four death crosses in Bitcoin's history, the average pullback within one month was 3.2%, but none triggered a long-term bear market, often serving as a 'local bottom confirmation signal'.
Macroeconomic data guidance: The Federal Reserve's interest rate meeting in November (November 6) and U.S. CPI data (November 13) will determine liquidity trends. If the CPI falls below 3% year-on-year, the Federal Reserve may signal 'continued rate cuts', driving Bitcoin's rebound; if the CPI exceeds 3.5%, rising interest rate expectations will suppress risk assets.
In addition, the 'lunar phase cycle' in mid-November is also worth noting—analyst LP_NXT's research shows that the first quarter moon on October 29, 2025, usually corresponds to the start of an upward trend, continuing until the full moon in mid-November. This resonates with the technical 'local bottom' expectation and may trigger a short-term rebound.

2. December: Year-end capital game, high probability of oscillating finish
The December market will enter a dual game of 'funds returning + layout for next year', with the market characteristics possibly being:
Increased volatility: Hedge funds locking in profits at year-end and retail investors cashing out may trigger short-term violent fluctuations, but institutional funds may take the opportunity to increase their holdings at low levels, limiting the extent of the pullback.
Range oscillation: The expected range is $90,000 - $120,000. If November holds the $100,000 support, December is expected to rebound to $115,000 - $120,000; if November breaks down, December may test $85,000 - $90,000 support.
Sector rotation: During Bitcoin's high-level oscillation, altcoins may present structural opportunities, especially projects combined with AI and RWA (real-world assets), which may attract capital diversion.
For investors, the core strategy in December is 'defensive counterattack': control the holding ratio at 50%-60%, set a stop-loss line at $90,000 (corresponding to the weekly break below the 50-week moving average), while paying attention to ETF capital flows—if the net inflow exceeds $500 million in a single day, moderate accumulation may be warranted; if there are three consecutive days of net outflow, decisive reduction is necessary.
05, Conclusion: The cycle is not dead, it has only been reconstructed
Bitcoin's 15-year 4-year bull market cycle has not disappeared but has been reconstructed by three major trends: institutionalization, globalization, and regulatory maturity.
The traditional pattern of 'peaking 18 months after halving, followed by an 80% pullback' is no longer applicable in the current market environment. The bull market cycle is likely extended to 5 years, with the end time pushed back to mid-2026.
For the remaining two months of 2025, the market is likely to exhibit a 'first suppression then rise, oscillating finish' pattern: November faces technical pullback pressure, possibly testing $95,000 - $100,000 support; December may oscillate upward under liquidity support, ending the year with a gain of 50%-80%.
Investors do not need to overly worry about 'when the bull market will end', but should focus on core indicators: whether the 50-week moving average holds, whether ETF funds continue to flow in, and whether global liquidity turns.
The investment logic of Bitcoin has shifted from 'betting on cycles' to 'looking at value'—when it becomes part of institutional asset allocation, and when its volatility is deeply tied to the global macroeconomy, its bull-bear transitions will no longer be a simple '4-year cycle', but a more complex resonance of 'capital cycle + technological cycle + macro cycle'.
For long-term investors, the current period is still a layout window for 'crossing the cycle', but it is necessary to abandon the retail mindset of 'getting rich overnight' and respond to volatility rationally from the perspective of asset allocation.
The bull market will eventually end, but Bitcoin's evolution has never stopped.
This 'new cycle' led by institutions may signal a complete transformation of the cryptocurrency market from 'barbaric growth' to 'mature regulation', which is far more meaningful than precisely predicting the end time of the bull market.
