Liquidity often dominates each cyclical rotation of the cryptocurrency market. In the long run, adoption may determine the narrative of the cryptocurrency industry, but it is the direction of capital flow that truly drives price changes.
In the past few months, the momentum of this capital inflow has明显放缓. Through three main channels – stablecoins, ETFs, and Digital Asset Treasuries (DAT) – the capital flow into the ecosystem has weakened synchronously, which has shifted the cryptocurrency market from an expansion phase to a phase supported by existing funds.
While technology adoption is certainly important, liquidity is the true key driving the cyclical rotation of the market. This is not just a matter of market depth, but also a matter of fund availability. When global money supply expands or real interest rates decline, excess liquidity will inevitably seek risk assets, and cryptocurrency has historically (especially during the 2021 cycle) been one of the largest beneficiaries.
In previous cycles, liquidity mainly entered digital assets through the issuance of stablecoins, which is the core fiat entry point. As the market matures, three main liquidity funnels have gradually formed, determining the paths for new capital to enter the crypto market:
Digital Asset Treasuries (DATs): tokenized funds and yield structures that connect traditional assets with on-chain liquidity.
Stablecoins: the on-chain form of fiat liquidity, serving as the foundational collateral for leverage and trading activities.
ETFs: provide traditional financial institutions and passive funds with access to BTC and ETH.
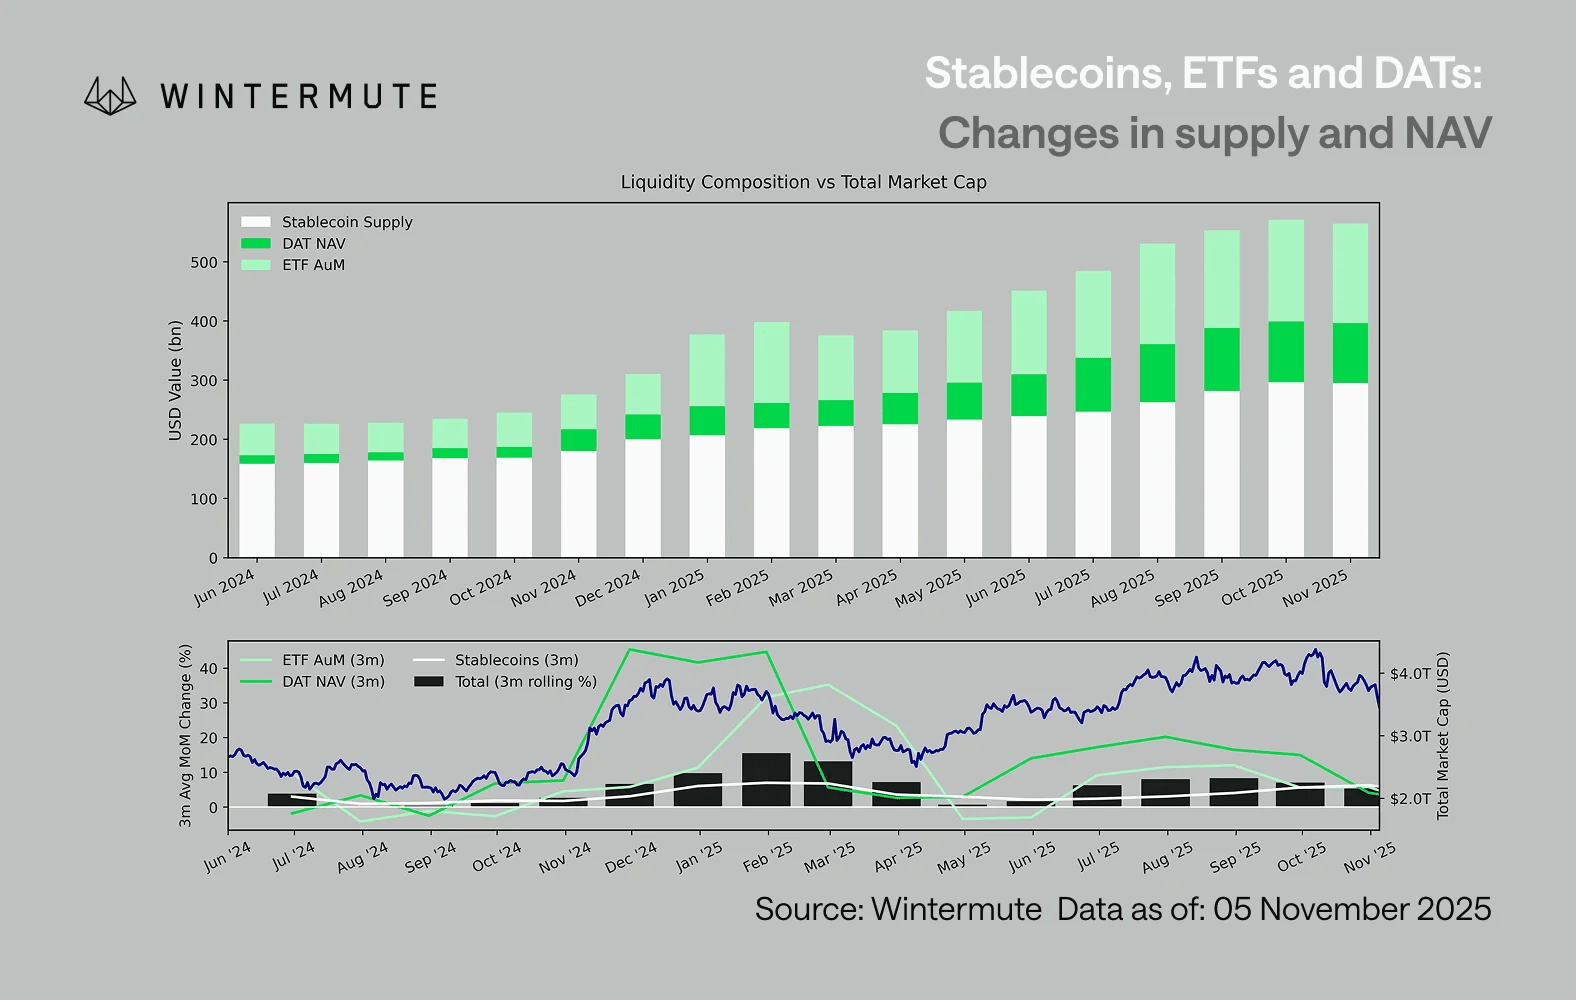
Combining the assets under management (AUM) of ETFs, the net asset value (NAV) of DAT, and the number of issued stablecoins can serve as a reasonable indicator of the total capital inflow into digital assets.
The chart below shows the changes in these components over the past 18 months. The bottom chart indicates that the changes in this total are highly correlated with the overall market capitalization of digital assets—when funds flow in faster, prices tend to rise as well.
Which path has seen a slowdown in inflows?
A key piece of information reflected in the chart is that the inflow momentum of DAT and ETFs has significantly weakened. These two paths performed strongly in Q4 2024 and Q1 2025 and briefly rebounded in early summer, but the momentum has since gradually dissipated. Liquidity (M2) is no longer flowing into the crypto ecosystem as naturally as it did at the beginning of the year. Since early 2024, the total size of DAT and ETFs has grown from approximately $40 billion to $270 billion, while the supply of stablecoins has doubled from about $140 billion to $290 billion. This shows structural growth but also a clear 'platform period.'
It is important to observe the slowing pace of different paths, as each path reflects different sources of liquidity: stablecoins reflect the inherent risk appetite of the crypto market; DAT reflects institutional demand for yield-bearing assets; ETFs map the allocation trends of traditional financial capital; the simultaneous slowdown of all three indicates that new capital deployment is generally decelerating, rather than merely rotating between products.
Stock game market
Liquidity has not disappeared; it is just circulating within the system rather than expanding continuously.
From a broader macro perspective, overall economic liquidity (M2) outside the crypto market has also not stagnated. Although higher SOFR rates will constrain liquidity in the short term—making cash yields more attractive and keeping funds in the treasury market—the world is still in a loose cycle, and the U.S. quantitative tightening (QT) has officially ended. The structural backdrop remains supportive, but currently, liquidity is flowing more towards other forms of risk expression, such as the stock market.
Due to the decrease in external capital inflows, market dynamics have become closed. Funds more often rotate between major coins and altcoins, creating a situation of internal competition (PVP). This explains why rebound trends are always short-lived and why market breadth continues to narrow even when total assets under management remain stable. Currently, the surge in market volatility is mainly due to a chain reaction of liquidations, rather than being driven by persistent trends.
Looking ahead, if any liquidity path experiences a substantial recovery—whether through the reissuance of stablecoins, renewed enthusiasm for ETFs, or a rebound in DAT size—it would indicate that macro liquidity is flowing back into the digital asset space.
Before that, the crypto market will still be in a 'self-sustaining' phase, with funds circulating internally rather than compounding growth.


