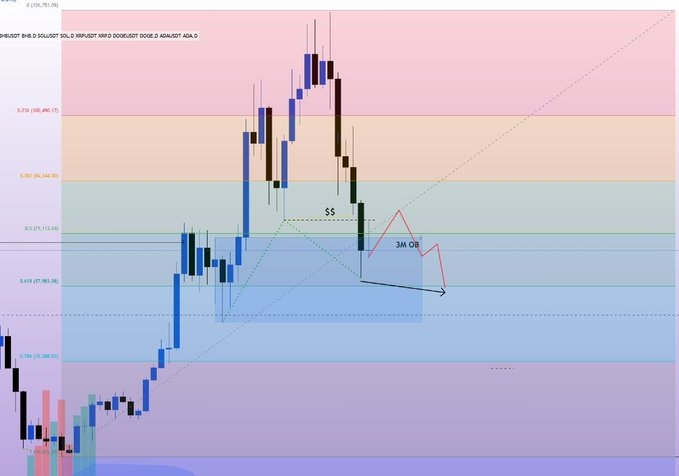
📊 Bitcoin Analysis – Monthly Frame
Focus on the picture and follow me to the end 👇
What we have in front of us on this chart is a huge trading range.
▫️ Bottom of the range: $15,000
▫️ Top of the range: around $126,000
The price is currently trading around the 50% level and close to the golden level 0.618
The strongest scenario that we might see, and if a very strong entry signal occurs 👇
"This scenario could happen, and if it does, it will be very positive for the market"
📉 A final drop occurs that creates:
▪️ A new bottom on the monthly frame
▪️ A Bullish Divergence occurs between the current bottom and the new bottom
At the same time…
📊 USDT.D will set a new historical high
And here…
🚨 The real explosion starts after it
🔥 Most likely, we will see a very strong upward wave in crypto as a whole
$BTC
Focus on the picture and follow me to the end 👇
What we have in front of us on this chart is a huge trading range.
▫️ Bottom of the range: $15,000
▫️ Top of the range: around $126,000
The price is currently trading around the 50% level and close to the golden level 0.618
The strongest scenario that we might see, and if a very strong entry signal occurs 👇
"This scenario could happen, and if it does, it will be very positive for the market"
📉 A final drop occurs that creates:
▪️ A new bottom on the monthly frame
▪️ A Bullish Divergence occurs between the current bottom and the new bottom
At the same time…
📊 USDT.D will set a new historical high
And here…
🚨 The real explosion starts after it
🔥 Most likely, we will see a very strong upward wave in crypto as a whole
$BTC