
This analysis is based on data available as of today (September 2025). The cryptocurrency market is extremely volatile, and making predictions is not sufficiently accurate and very thankless. Always conduct your own research before making any trading decisions.
=========
General overview
As of early September 2025, Solana (SOL) shows strong market performance and holds one of the leading positions in market capitalization.
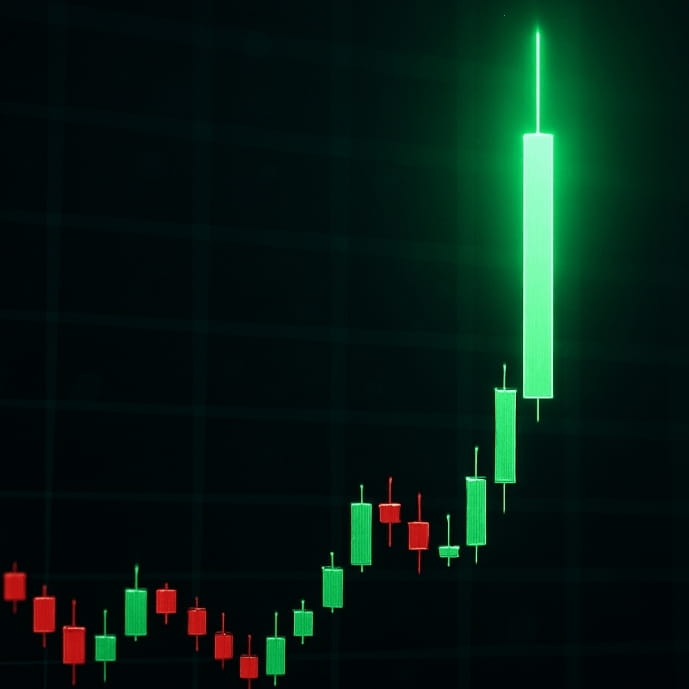
The asset is in a "bullish" trend phase, confirmed by stable price growth over the last few months. Positive sentiment around the project, high interest in its ecosystem, and discussions of possible ETFs on Solana create a favorable backdrop for further growth.
=========
Key indicators and their interpretation
Moving Averages:
Most moving averages, including the 50-day and 200-day, show a "bullish" signal. This means that the current price of SOL is significantly above its averages over long periods. Such a situation is usually interpreted as a strong upward trend.
========
Oscillators:
Relative Strength Index (RSI):
The RSI is in the neutral zone, indicating neither overbought nor oversold conditions for the asset. This leaves room for further growth without the risk of a sharp correction associated with excessive market euphoria.
MACD (Moving Average Convergence Divergence):
MACD signals can be mixed. While the long-term trend remains "bullish", short-term signals may indicate a decrease in momentum and a possible price consolidation in the near future.
Stochastic RSI:
This indicator may show "overbought" conditions, which could potentially herald a short-term correction before the upward movement resumes.
==========
Support and resistance levels
Resistance levels:
The nearest strong resistance is in the range of $201-$211. A successful breakout of this level could act as a catalyst for growth towards the next targets.
The following key resistance levels are around $220-$230 and $250.
The absolute historical maximum of SOL (around $294.85) remains a major long-term target for the bulls.
=========
Support levels:
Key psychological support is at $200. Maintaining the price above this level is critical for sustaining the upward trend.
The following strong support levels are located in the range of $190-$195.
If the price drops below, the next significant support will be the zone of $174-$180.
=========
Forecast and scenarios
Short-term (week):
In the coming days, price consolidation around $200 is likely. Small fluctuations are possible as the market digests the recent growth. If the price can firmly establish itself above $200, the next target will be $211.
Medium-term (month):
If the upward trend continues, the price of Solana may test resistance levels up to $250. However, if negative news or a general market downturn leads to a correction, the price could return to support levels around $180.
Long-term:
Long-term forecasts for Solana remain optimistic. Considering the development of the ecosystem, increased interest from institutional investors, and potential ETF approval, SOL has every chance to update its historical highs.
=========
Risk factors
Regulatory pressure:
Potential legislative changes could negatively impact the price.
Market volatility:
The entire cryptocurrency market remains highly volatile. Sharp movements in Bitcoin's price can lead to corrections in Solana's price.
Network failures:
While the stability of the Solana network has significantly improved, any serious operational failures could undermine investor confidence.
===========
❗️
This is not financial advice. Always conduct your own research and consider all risks before investing.