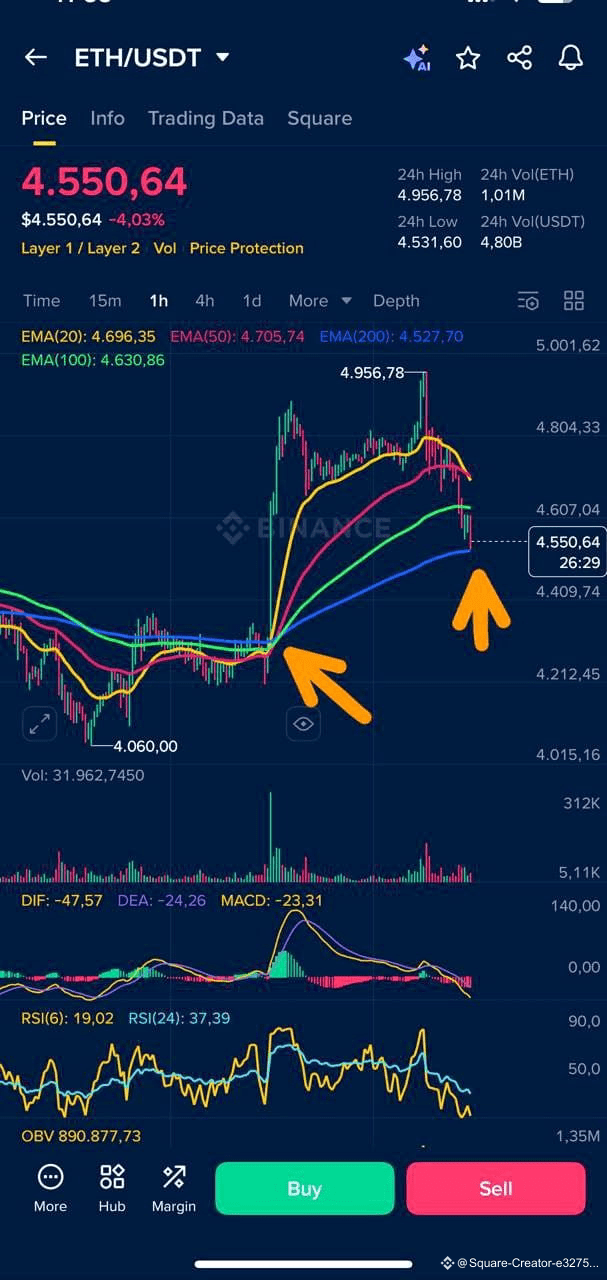
The loaded chart for Ethereum (ETH/USDT) highlights an important event in its price movement. The yellow arrow on the left indicates what appears to be the beginning of a strong upward trend. Here, the price began to accelerate upward.
After this sharp rise, the price experienced a noticeable decline or correction, as indicated by the yellow arrow on the right. This correction shows a drop from its recent highs.
What do the indicators show?
* Moving Averages: The chart displays several moving averages (EMA 20, 50, 100, 200). The sharp upward trend began when the price crossed these lines. The recent decline has led to a drop in price, and it is now trading below the faster moving averages (such as EMA 20 and 50), which often indicates a change in short-term momentum.
* MACD and RSI: The bottom part of the chart shows MACD and RSI. Both indicators were in a strong upward state during the price increase, and they are now showing downward momentum, supporting the idea of the recent price correction.
After this sharp rise, the price experienced a noticeable decline or correction, as indicated by the yellow arrow on the right. This correction shows a drop from its recent highs.
What do the indicators show?
* Moving Averages: The chart displays several moving averages (EMA 20, 50, 100, 200). The sharp upward trend began when the price crossed these lines. The recent decline has led to a drop in price, and it is now trading below the faster moving averages (such as EMA 20 and 50), which often indicates a change in short-term momentum.
* MACD and RSI: The bottom part of the chart shows MACD and RSI. Both indicators were in a strong upward state during the price increase, and they are now showing downward momentum, supporting the idea of the recent price correction.