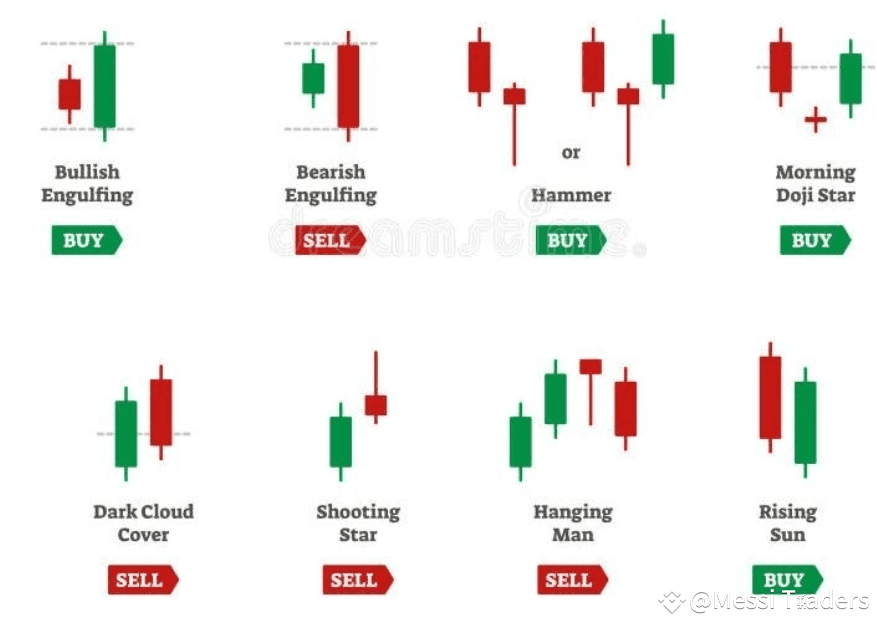
Candlestick patterns help traders identify potential price movements and decide when to buy or sell.
---
Bullish Candlestick Patterns (Buying Signals)
These patterns suggest a possible price increase and indicate a buying opportunity.
1. Strong Bullish Candle
A big green candle that completely covers the previous red candle.
Shows strong buying momentum and possible trend reversal.
2. Hammer
A small candle body with a long lower wick.
Appears after a downward trend, signaling a possible price recovery.
3. Morning Star Doji
A three-candle pattern: one red candle, a small Doji in the middle, followed by a big green candle.
Indicates a shift from a downward trend to an upward trend.
4. Rising Sun
A red candle followed by a strong green candle that closes above the middle of the red candle.
Suggests increasing buying strength and a potential price rise.
---
Bearish Candlestick Patterns (Selling Signals)
These patterns indicate a potential price drop and signal a selling opportunity.
1. Strong Bearish Candle
A large red candle that fully covers the previous green candle.
Suggests strong selling pressure and a trend reversal.
2. Dark Cloud Formation
A red candle that opens higher than the previous green candle but closes below its middle point.
Signals a possible bearish reversal.
3. Shooting Star
A small candle body with a long upper wick.
Appears after an upward trend, showing weak buying strength.
4. Hanging Man
A small candle body with a long lower wick, appearing at the top of an uptrend.
Suggests a possible price drop.
Key Insights:
Buying signals emerge when certain bullish candlestick patterns indicate strong upward momentum.
Selling signals occur when bearish patterns suggest a potential downward movement.
For greater accuracy, always validate signals using volume trends and market analysis.