

The long holiday has passed in the blink of an eye. During the holiday, Bitcoin has been fluctuating between 27200-28200, without much fluctuation, and the short-term will once again face a direction choice.
The biggest factor causing the sideways fluctuation was shared in the community on October 2nd. It is because 28500 is the support level that broke down after the previous sideways fluctuation from the high of 318000. In turn, it becomes a heavy pressure for this round of rise. Under the stimulation of sudden improvement in the capital market or major favorable factors, it takes a long time to digest the high chasing and locked-in positions above, and exchange time for space to continue to break upward. Therefore, the current position strategy is to keep the medium and long-term positions (at least 30%) unchanged, and increase the position after the medium and short-term buying points appear.
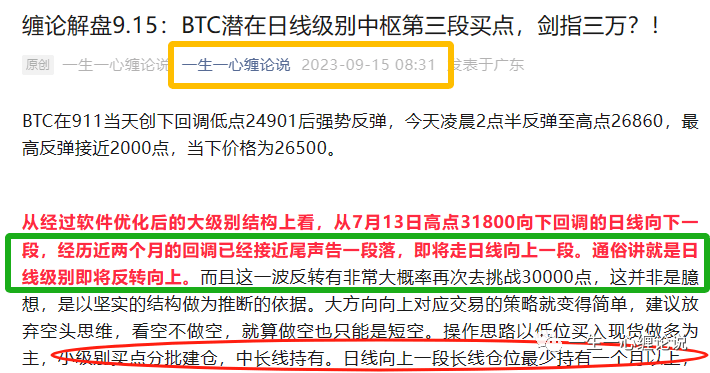
From the perspective of the big structure of the big cake, as this account has made the only deduction that the daily level reversal trend is to go up on the daily level before the market came out on September 15. The current daily level is growing upward and there is no sign of ending. Once it passes the 28,500 level, the next target will be the 30,000 point level. Let's wait and see.
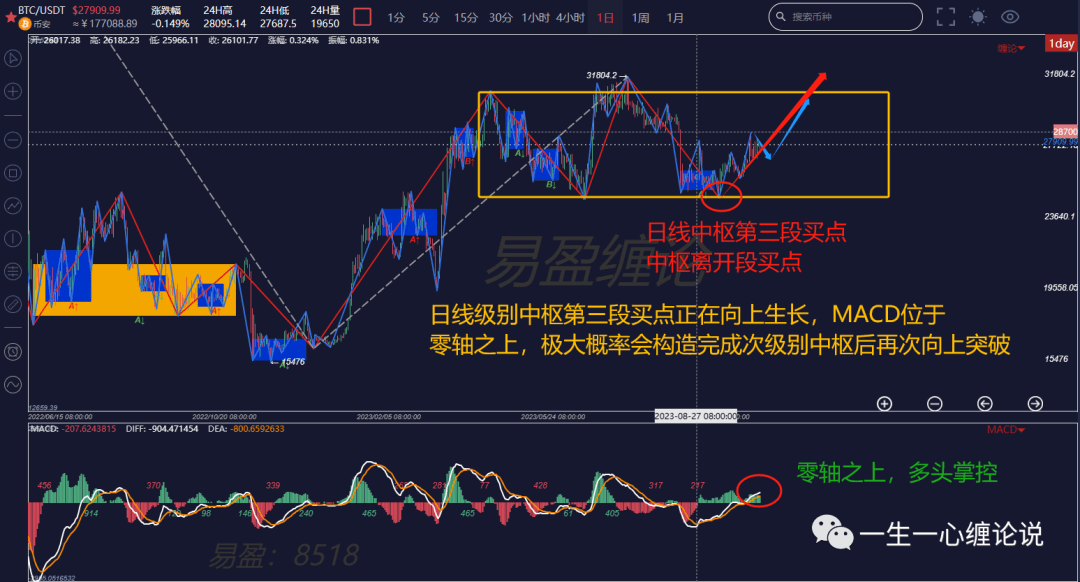
Let's look at the daily chart first. The current running is the upward section of the third buying point of the daily central axis. At present, the upward section has only gone up and down three times, and MACD has also stood on the zero axis. The secondary level is constructing a pen central axis. Once the pen central axis is constructed, it will break upward again. It is difficult to accurately judge whether it can break a new high, but the upward target must at least challenge the upper edge of the central axis, which is around 30,500 points.
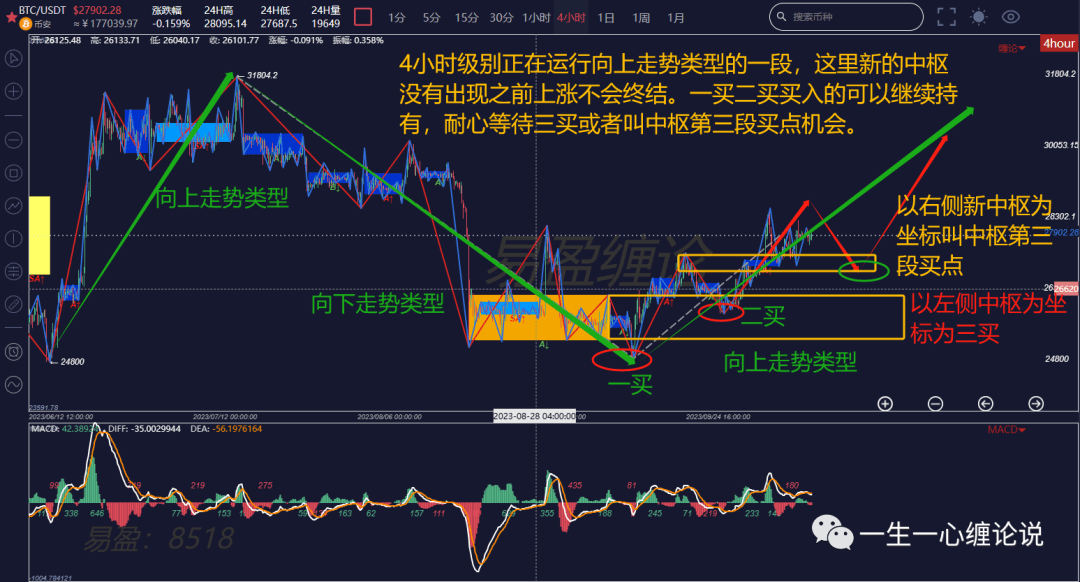
Looking at the 4-hour chart of the sub-level corresponding to the daily level, the 4-hour level is running an upward trend type that starts from the first buy 24901. The biggest expectation at present is whether the downward callback after the current upward movement ends will not enter the left yellow center to form the third buy (two perspectives are shown in the figure). The 4-hour three buy is the key buying point for the bulls to strengthen. Therefore, the mid-line operation idea is to patiently wait for the buying point opportunity of a 4-hour downward callback.
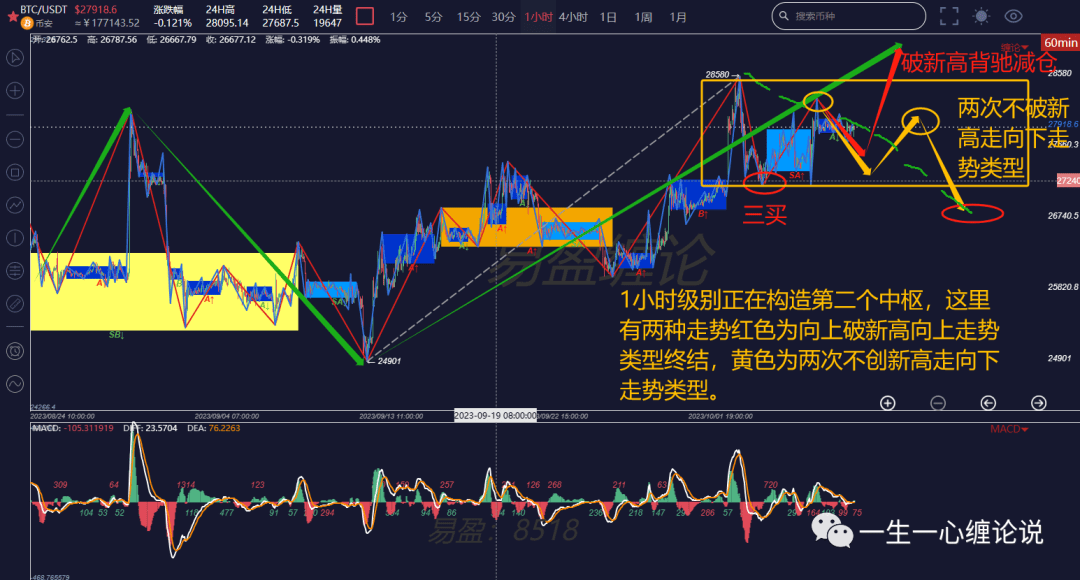
Looking at the short-term hourly chart, there are two most likely trends at the hourly level as shown in the figure: the red trend is the upward trend type after the second central axis of the 1-hour upward structure is completed and then breaks through 28580 again; the yellow trend is the downward trend type that breaks through 27175 twice without setting a new high. The buying point opportunity for the medium and long term lies in the batch intervention after the buying point appears in the 1-hour downward trend type.
The above analysis is for reference only and does not constitute any investment advice!