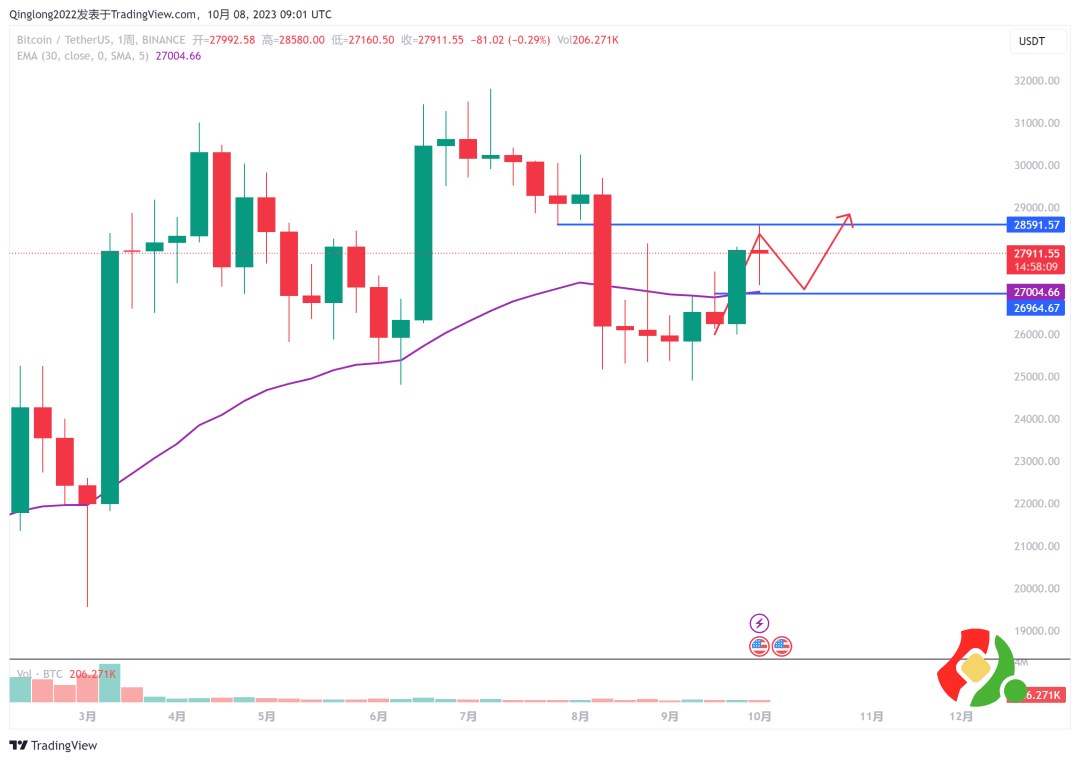
1. BTC market analysis
1. Weekly chart, Bitcoin showed a bullish pattern of one Yang through three last week, corresponding to one Yin through three on August 14, which seems to have recovered the previous decline. The word "seems" is used because the starting point of the decline is above 29,000 points, and the high point of this rebound is 28,500U, which is not surprising. It happens to be the horizontal trend line pressure level. Now the price of the currency is consolidating below 28,000, which is the position of the 200-week moving average. At this moment, it is very easy to have a divergence between long and short positions. Some people are bullish and some are bearish. The clues can be seen from the short cross star on the daily chart. Another logic supporting our bullishness is the golden cross of the KDJ indicator and the "shrinking head" of the MACD above the zero axis, indicating that the power of the bears is fading and the power of the bulls is gradually recovering. (27,000 points is the defense of the bulls and cannot be broken)
2. On the daily chart, Bitcoin goes back and forth between the 5-day moving average and the 10-day moving average. The overall closing price was below the 5-day moving average only for one day, but it was quickly recovered the next day. The volume performance was average. It was bullish in the short term but not very strong. It really tests the patience of every operator. The strong support level below is 27000U, and the pressure level above is 28000U, which is MA200. In the spot class, the entry price of Bitcoin is 27500U. You can continue to hold it. Pay attention to the large-volume breakthrough of 28000 points.
2. ETH market analysis
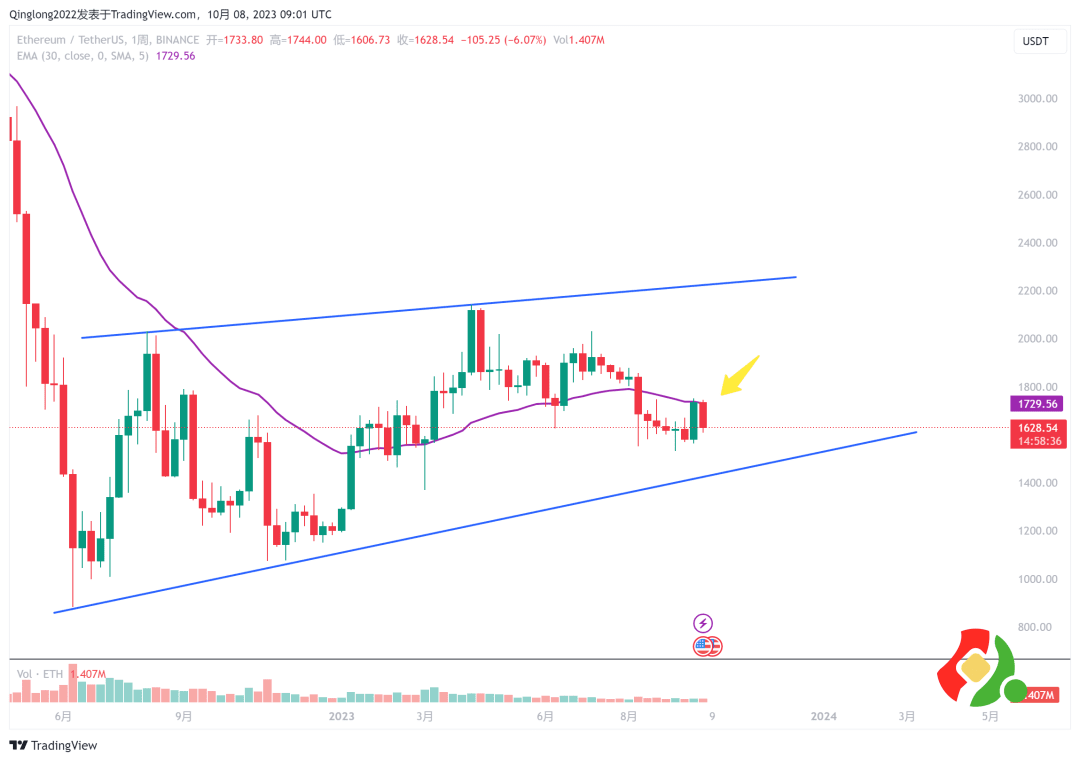
The price trend of ETH is relatively weaker than that of Bitcoin. It encountered suppression from the lifeline of the weekly chart when it attacked 1730 points, and began to fall back to the current price of 1639U. Bitcoin broke through three points with one yang line, but ETH did not complete the breakthrough. There was a divergence between the two. If the two directions are consistent, it can further increase the confidence in the bullish trend. As the support of ETH's daily chart, everyone can pay attention to 1609U. If it falls below, the support level of 1580U will be seen. The upward pressure level is 1641U, and the strong pressure is still 1745 dollars.
3. Review of spot strategies
1. LOOM has quadrupled from the bottom to now. It is a currency that has started to rise unnoticed, from 0.11 to 0.19U. It seems that this coin is a highly controlled coin, and the top ten holders account for 85%.
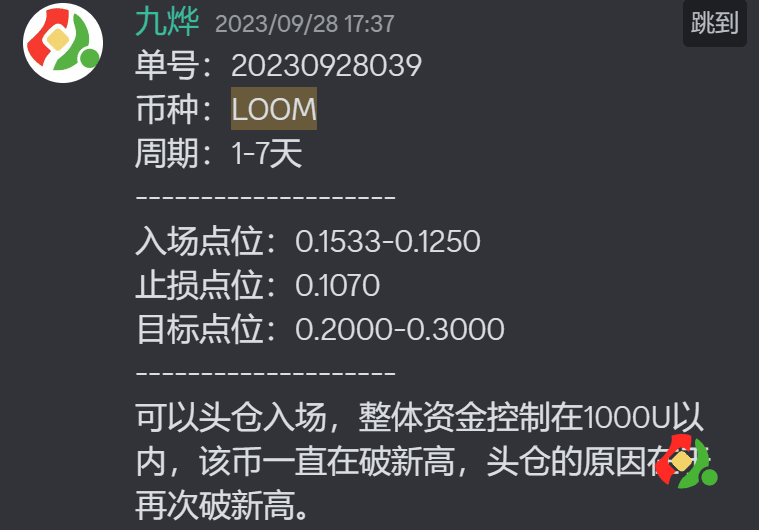
However, it is not recommended to chase high prices. We are still optimistic about it in the future. You can also join the spot class to pay attention to more potential currencies. We are currently raising funds for the "Hundred Times Coin Plan" and it is the right time to join.
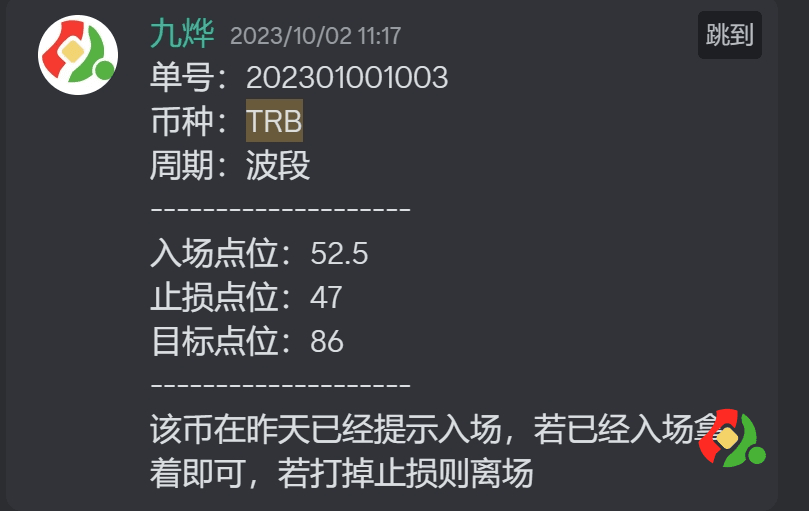
2. TRB hit a high of 67U and then retreated 39% to 41U, then rebounded. The current price is 51.35U. If it breaks through the previous high, the target will be 86U. TRB trading strategies are also given in the spot class.