ETH Forecast: What's Next??? 🚀🚀🚀
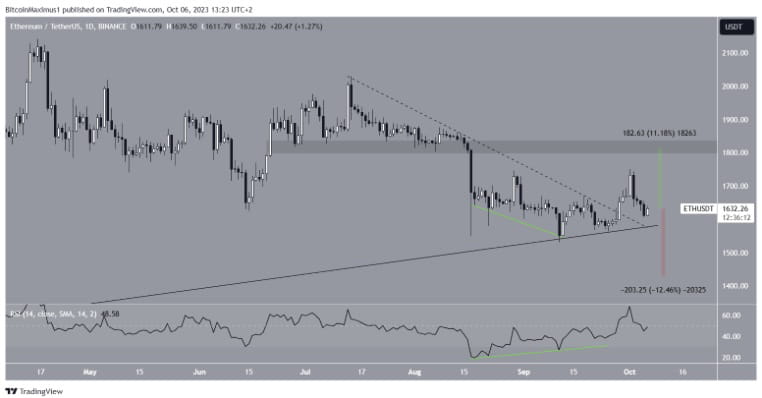
A closer look at the price dynamics shows that the price rebound was preceded by the formation of a bullish divergence (green line) on the RSI index.
A bullish divergence occurs when a decline in price is followed by an increase in momentum. This often leads to trend reversals.
If the rally continues, ETH could reach the next resistance at $1,820, which would represent an 11% gain from current values.
However, a close below the long-term ascending support line invalidates the bullish pattern. In this case, the price of Ethereum could fall by 12% to the long-term support at $1430.
#Crypto2023 #binance #Ethereum #Trading #BTC $ETH
A closer look at the price dynamics shows that the price rebound was preceded by the formation of a bullish divergence (green line) on the RSI index.
A bullish divergence occurs when a decline in price is followed by an increase in momentum. This often leads to trend reversals.
If the rally continues, ETH could reach the next resistance at $1,820, which would represent an 11% gain from current values.
However, a close below the long-term ascending support line invalidates the bullish pattern. In this case, the price of Ethereum could fall by 12% to the long-term support at $1430.
#Crypto2023 #binance #Ethereum #Trading #BTC $ETH