


10. Evolution of stablecoin market value on the Ethereum main chain
However, the development of the stablecoin market capitalization on the Ethereum main chain could indicate the end of the liquidity drying up period. This indicator is equivalent to the "(global) money supply M2" in traditional finance. When new funds enter the chain, it is usually correlated with price increases, either directly into Ether or into the DeFi ecosystem.
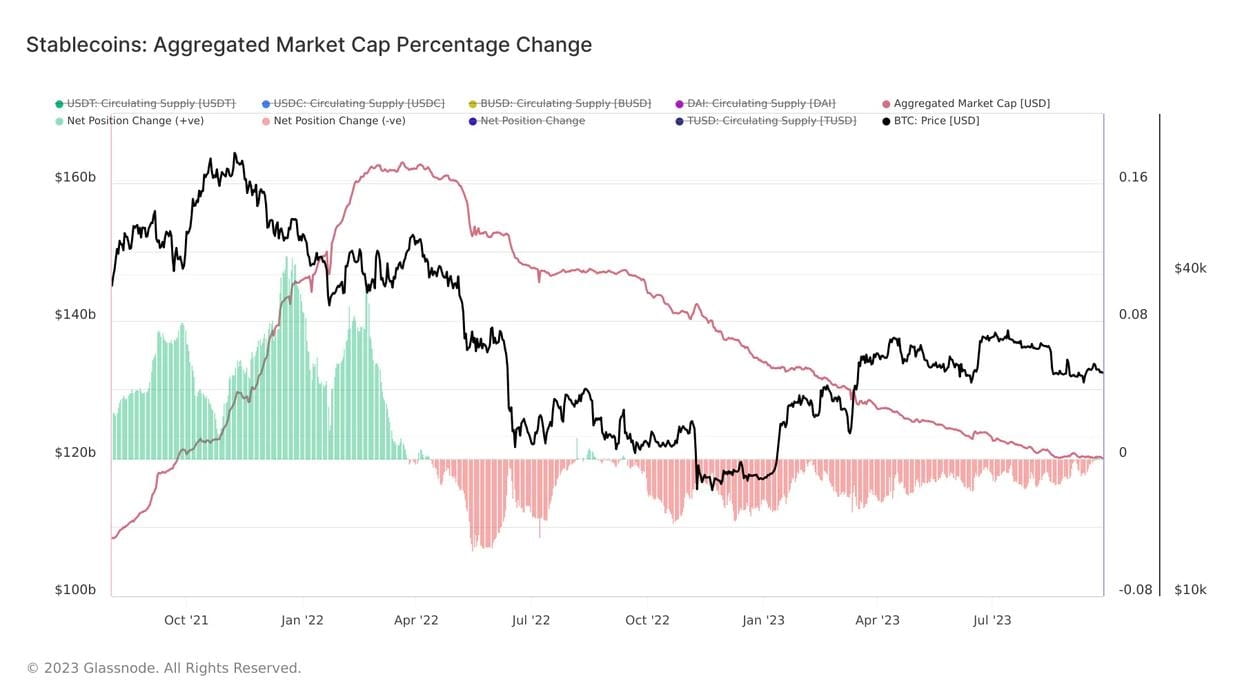 The market capitalization of stablecoins on the Ethereum mainchain and capital inflows and outflows over time.
For the first time since the merger, Ethereum’s stablecoin outflows appear to have formed a trough and stabilized. This suggests that funds are no longer withdrawing from the crypto space, but sitting on the sidelines waiting to re-enter. The likely reason for this is new investor interest from trends and new investment products on Ethereum. The next chart will cover this in more detail.
11. DeFi: These are the new trends
One of the emerging trends in the cryptocurrency space is so-called real-world assets on Ethereum. This refers to tokenized forms of real estate, securities, and bonds that are now traded on the blockchain and create real crypto use cases.
For example, thanks to protocols such as Ondo Finance, government bonds can be purchased on Ethereum, which has recently led to an increasing demand in the RWA space. This figure has now grown to $3 billion.
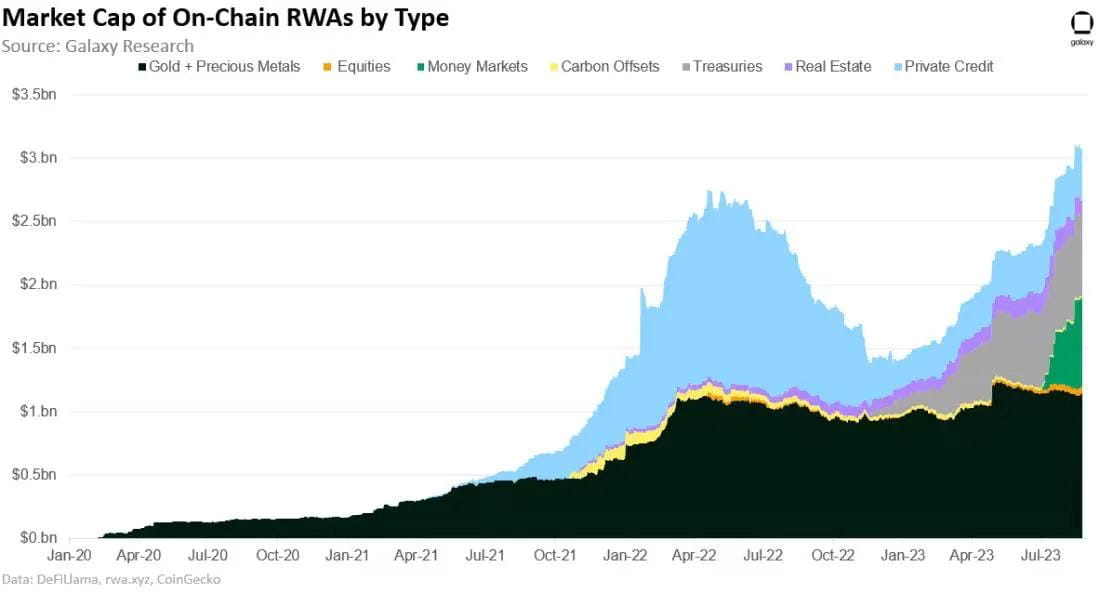
Market capitalization of real world assets (RWA) over time.
In addition, due to the innovation of the Maker (DAI) protocol and the rapid growth of stUSDT, the on-chain interest rates of stablecoins are competitive again. There may be a shift from the heavily speculation-driven DeFi field to the RWA field on Ethereum. Is the blockchain becoming more mature?
12. Ranking by protocol revenue
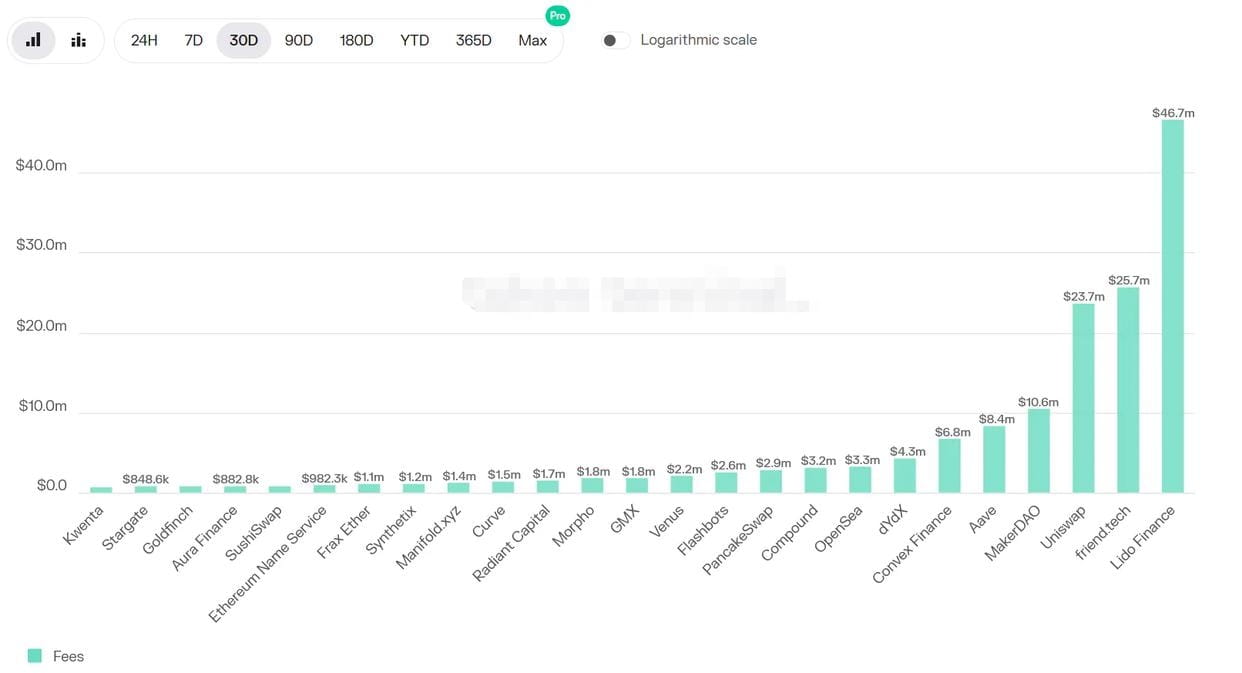
Dapps that are in demand will bring higher revenue. Ethereum’s decentralized applications remain one of the most popular applications in the field. With nearly $46 million in assets, Lido Finance is the most profitable dapp on Ethereum. Surprisingly, Lido is followed by the new social application Friend.Tec, which has generated $25.7 million in revenue in a month and even announced the most profitable application among all applications ($12 million). It is followed by Uniswap DEX with $23.7 million.
13. Ethereum Layer-2: Total Value Locked Stagnated
The rapidly growing Layer 2 ecosystem Ethereum is currently one of the blockchain’s biggest USPs. Projects such as Arbitrum, Optimism, and ZKSync have gained huge popularity since their merger last year. During this period, their TVL grew to $10.51 billion today, but have now reached a temporary plateau. Nonetheless, further growth is expected in the future due to the booming development of scaling technologies.
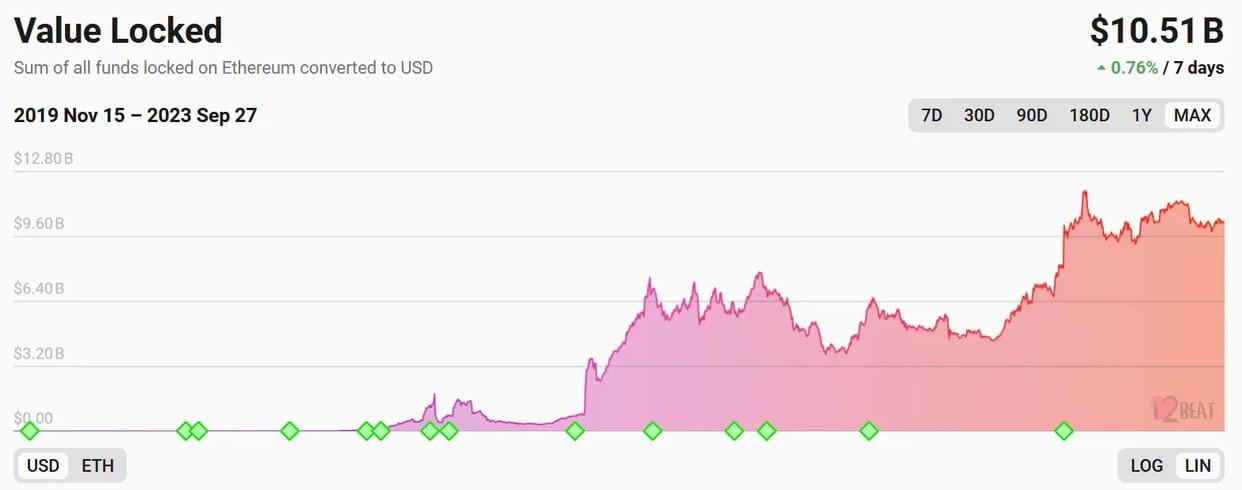
Total capitalization of Ethereum’s layer 2 network.
14. Expansion Factor: ETH Layer-2 is Getting Faster
Another exciting metric that illustrates the progress of Ethereum’s scaling technology is the expansion factor of the layer 2 network. As shown in the figure below, layer 2 scaling solutions now process about 5.65 more transactions per second (red) than the Ethereum main chain (blue). A year ago, L2 networks processed fewer transactions per second than the Ethereum main chain. It is expected that this metric may continue to rise in the coming months and throughout 2024.
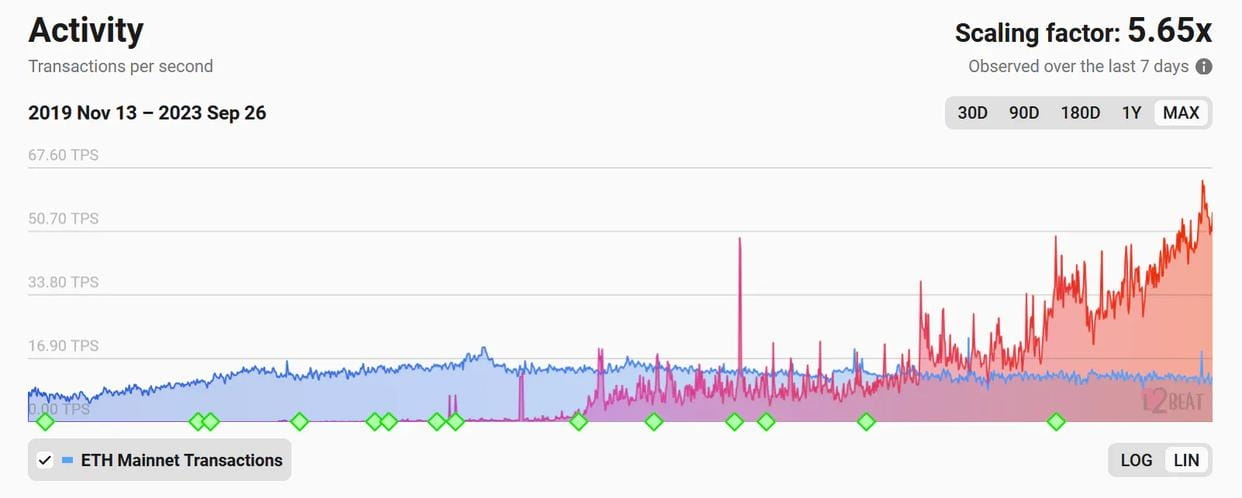
Ethereum's scaling factor over time.
15. Layer 2 Total ETH Revenue: Room for Improvement
Layer 2 networks pay fees to the Ethereum mainchain when they submit transactions for settlement. In short, the more activity there is on the Layer 2 networks, the more Ethereum can theoretically benefit from Layer 2 networks. However, there is still growth potential here.
Although a large portion of Ethereum transactions are processed through Layer 2 networks since the merger, they only contribute 5.2% of the total revenue of the Ethereum main chain. Last year, Layer 2 networks sent about $104 million (yellow) to the Ethereum main chain to utilize its security structure. This is in relation to the nearly $2 billion in total revenue on the Ethereum main chain (green).
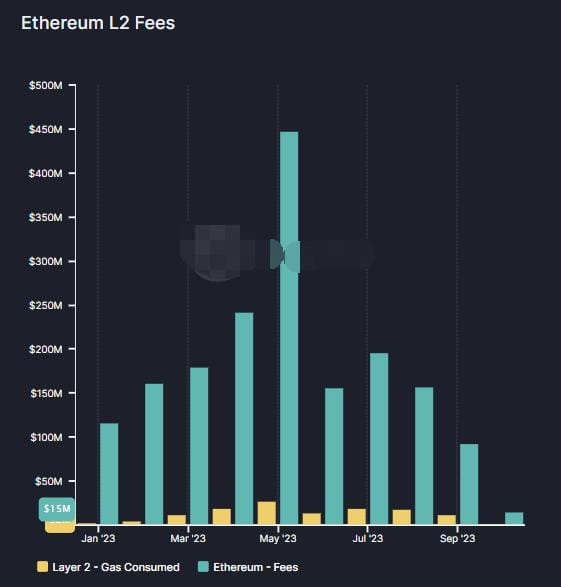
By comparison: a year ago, payments from Layer 2 networks to the main chain were only $400,000 to $100,000 per day. Today, those amounts are between $300,000 and $500,000.
16. Second level: These are trends
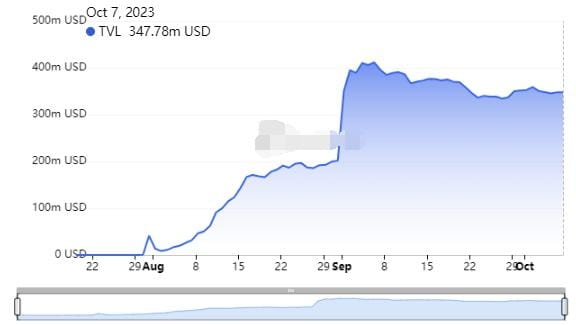
With over half of the Layer 2 TVL, Arbitrum continues to dominate the space without a doubt. However, despite its dominance, Optimism’s scaling technology is becoming increasingly popular and is now favored by many Layer 2 projects. Also included: Coinbase’s BASE chain. It has probably seen the fastest growth of all L2s in recent weeks, thanks to the hype surrounding social app Friend.Tech. It’s easy to imagine Binance’s new Layer-2 opBNB (also built on Optimism) seeing similar growth.
17. ETH developer activity during the summer slump
The merger was largely an achievement of Ethereum’s talented and accomplished developer community. It remains by far the most active community in crypto, and by far the most updated community on GitHub’s code management cloud. Still, they haven’t escaped the overall decline in crypto, with developer activity steadily declining since then. This is despite many advances in the layer 2 space.
18. Google Trends: Search interest stagnates
Aside from price, there is perhaps no metric that illustrates the crypto bear market better than the Google Trends graph for search queries. The September 2022 consolidation may mark the last point at which Ethereum recorded similar public interest compared to the 2021 bull run. Since then, the value has been declining or stagnant. But every so-called quiet phase in the crypto market also carries a certain amount of potential.
19. Ethereum is still in the accumulation zone
Finally, we refer to the long-term holders NUPL chart. This stands for Net Unrealized Profit Loss and basically shows what percentage of Ethereum long-term holders are currently in positive or negative territory. High percentages are marked in blue. Red shows us periods of capitulation, which usually marks the bottom of a bear market.
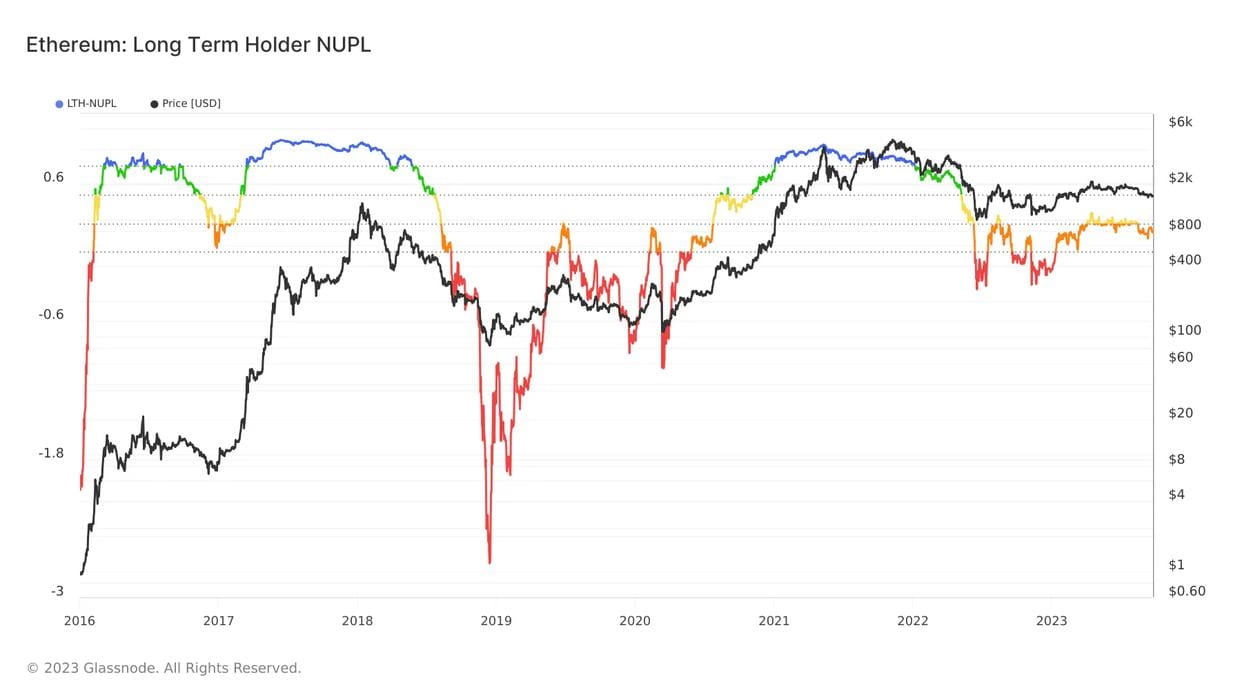
It can be seen that Ethereum is currently in a "hope-fear phase" (orange) following the optimism of holders during the summer (yellow). From a historical perspective, ETH is once again in an accumulation phase. The FTX disaster a year ago seems to have passed the low point, but many holders are still afraid to hide.
20. Conclusion and Outlook
There’s no doubt about it: things have become a lot quieter in the crypto space. Even the industry’s second-largest blockchain couldn’t consistently reverse the trend last year. But the Ethereum network isn’t standing still. ETH staking and Layer 2 chains are booming, new trends are emerging, and examples of real-world assets show that Ethereum is starting to mature as an ecosystem. It’s no surprise, then, that large institutions like Fidelity, VanEck, and UBS have become increasingly active in the Ethereum ecosystem lately. The trend seems clear: away from wild speculation and towards real use cases and sustainable usage of the network. What’s built today will bear fruit tomorrow.
Nevertheless, Ethereum still faces some obstacles. Further market sell-offs may be associated with a decline in on-chain activity, further exacerbating the recent inflationary trend of token economics. In addition, although the current decentralization of Stake is advancing, Lido's strong dominance in the Stake field still needs to be viewed with caution.
Ultimately, Ethereum needs to find ways to gain more benefits from its burgeoning Layer 2 space to avoid being cannibalized by it. Implementing it may take some time — but it should be on Ethereum’s side.