

In the volatile world of cryptocurrencies, the price of Ripple (XRP/USD) stands out, with daily trading volume now exceeding $500 million. Despite recent bearish sentiment, XRP’s surge has sparked speculation: Is XRP on the verge of a rebound?
Let’s dive into the data and technical indicators to uncover the XRP price prediction.
XRP Price Update
Ripple’s XRP has been in the spotlight lately, and the latest data suggests its investors may be seeing light at the end of the tunnel. As of Oct. 7, XRP was priced at $0.52255.
This relatively modest figure masks a noteworthy surge in 24-hour trading volume, which has surpassed the $500 million mark, reaching $574,496,492 to be specific. This movement resulted in a 0.50% increase in its value over the same time frame.
According to CoinMarketCap, XRP is currently ranked fifth with a market cap of approximately $27.9 billion.
The cryptocurrency has a circulating supply of 53.39 billion XRP coins, and its maximum supply is capped at 100 billion.
For those who closely follow cryptocurrency market trends, be sure to check out our recent article on Bitcoin price prediction. Get the latest insights on BTC’s potential trajectory.
XRP Price Prediction
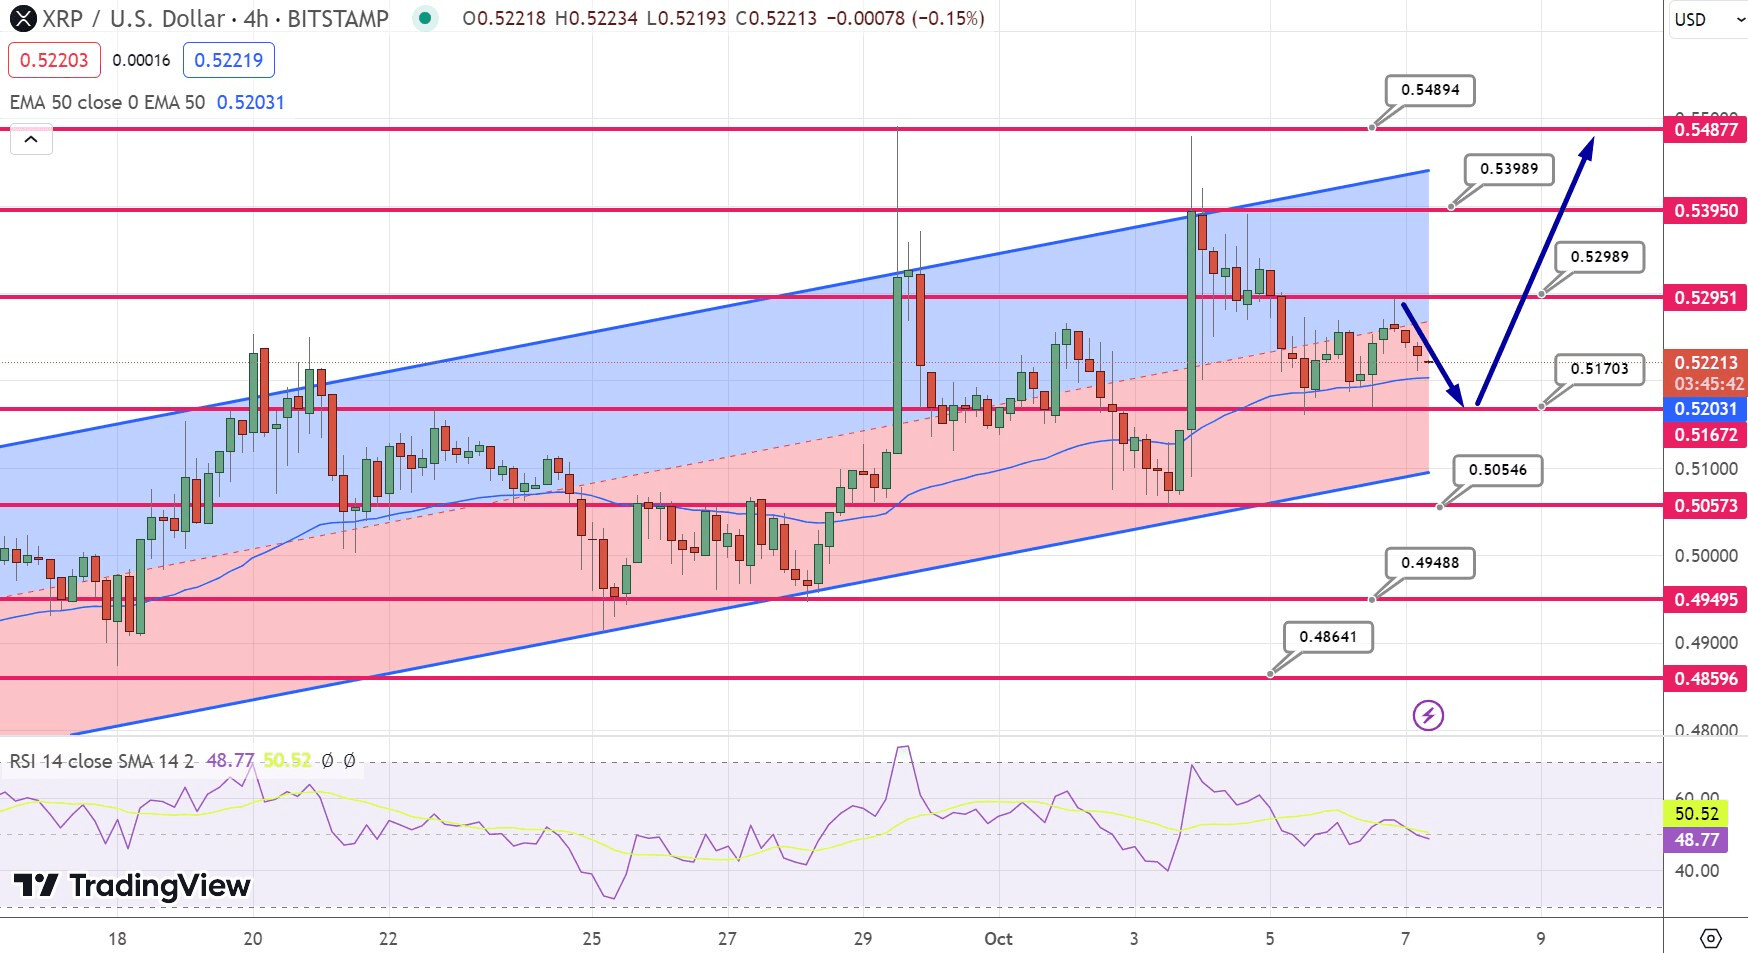
From a technical perspective, the pivot point for XRP/USD is currently $0.5170 based on the 4-hour time frame.
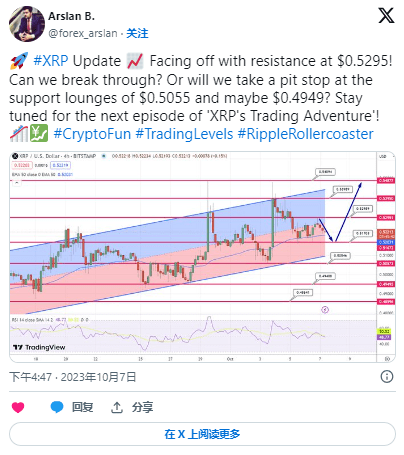
Key Trading Levels: The current resistance is $0.5295, with further resistance at $0.5399 and $0.5489. On the other hand, XRP has an immediate support at $0.5055, followed by additional support at $0.4949 and $0.4864.
Key Technical Indicators: Digging deeper into the technical indicators, the Relative Strength Index (RSI) is currently sitting at 48. RSI values below 50 typically indicate bearish sentiment, while values above 50 indicate bullish momentum.
In the case of XRP, the RSI is slightly tilted towards bearish sentiment but is very close to the midpoint and could tilt in either direction.
50 EMA Suggests Buying: XRP’s 50-day exponential moving average (EMA) is $0.5200. The asset’s price is hovering around this level, which makes it a key point to observe.
If the price stays above the 50 EMA, it is likely to indicate a short-term bullish trend, while a break below it is likely to indicate a bearish stance.
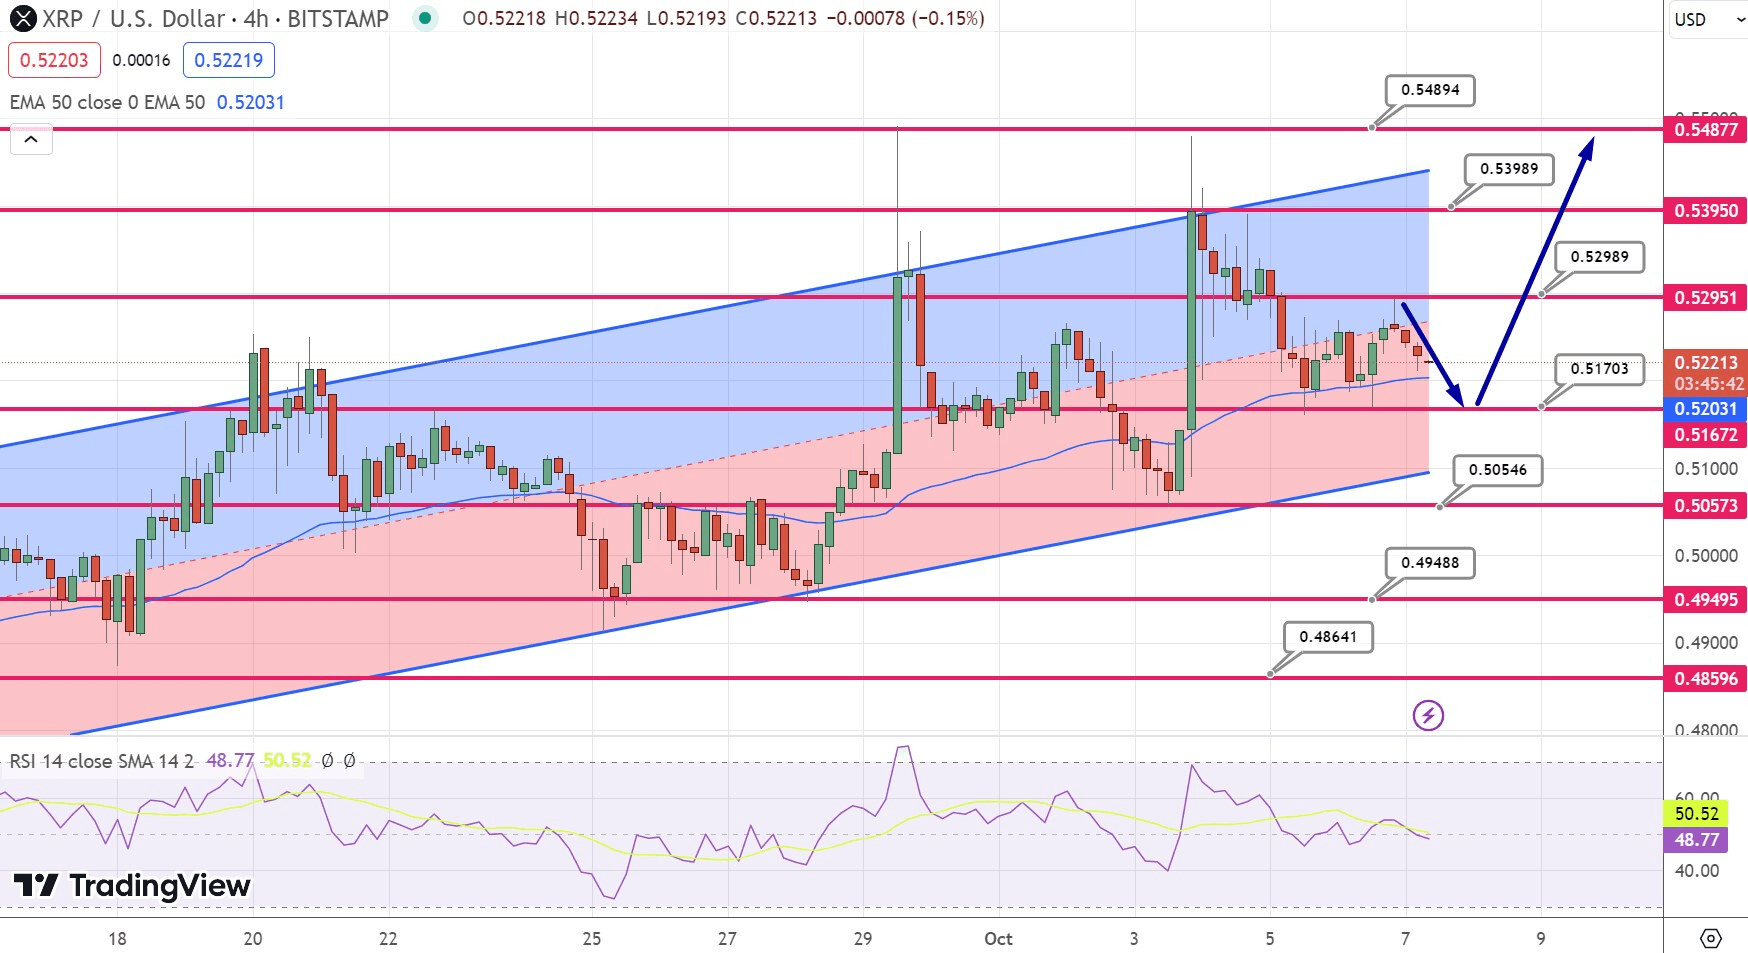
Looking at the chart pattern, XRP has drawn an ascending channel on the 4-hour timeframe, which is a positive sign for potential buyers.
The channel indicates sustained bullish sentiment and this view is further reinforced by the 50 EMA (blue), which supports the chances of a bullish trend continuation at the $0.5200 level. However, any bearish crossover below this moving average could pave the way for a selling trend.
In conclusion, while the short-term future of XRP seems to depend on the crucial $0.5200 mark, above this price point the overall sentiment tends to be bullish.
With ongoing developments and technical indicators, traders and investors can expect XRP to test its $0.5400 or $0.5485 resistance levels in the coming days.
As always, careful observation and strategic decision-making are key in these volatile cryptocurrency markets.