📍#LINK Chart update 2
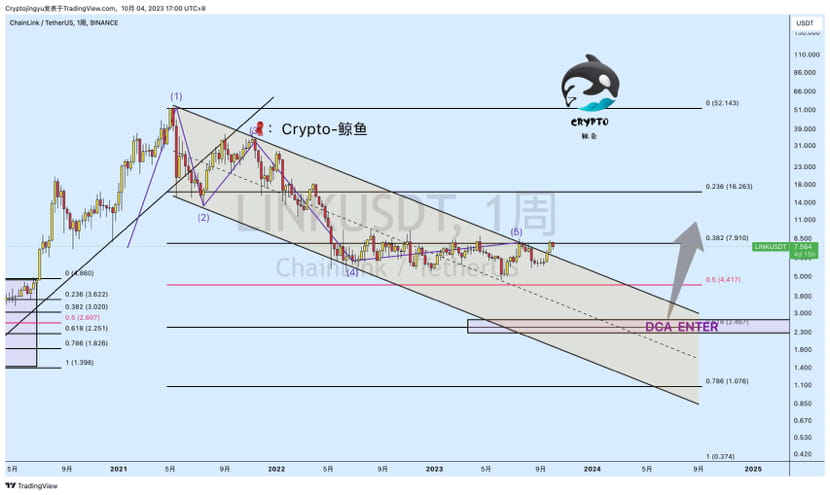
Drawing this chart on September 13th still makes no sense in the short term. Unless the weekly close is higher than 8. It has been consolidating in the FIB0.382-0.5 area for a year now. The radical point is that the weekly close is higher than 8. The perfect DCA entry is still at FIB0.618, choose bullish near 2.6. Don't go in now, you can't get in now or get down. What do you think?
Drawing this chart on September 13th still makes no sense in the short term. Unless the weekly close is higher than 8. It has been consolidating in the FIB0.382-0.5 area for a year now. The radical point is that the weekly close is higher than 8. The perfect DCA entry is still at FIB0.618, choose bullish near 2.6. Don't go in now, you can't get in now or get down. What do you think?