
#xrprealitycheck
xrprealitycheck
11.9M views
11,838 Discussing
Hot
Latest

·
--
Bearish
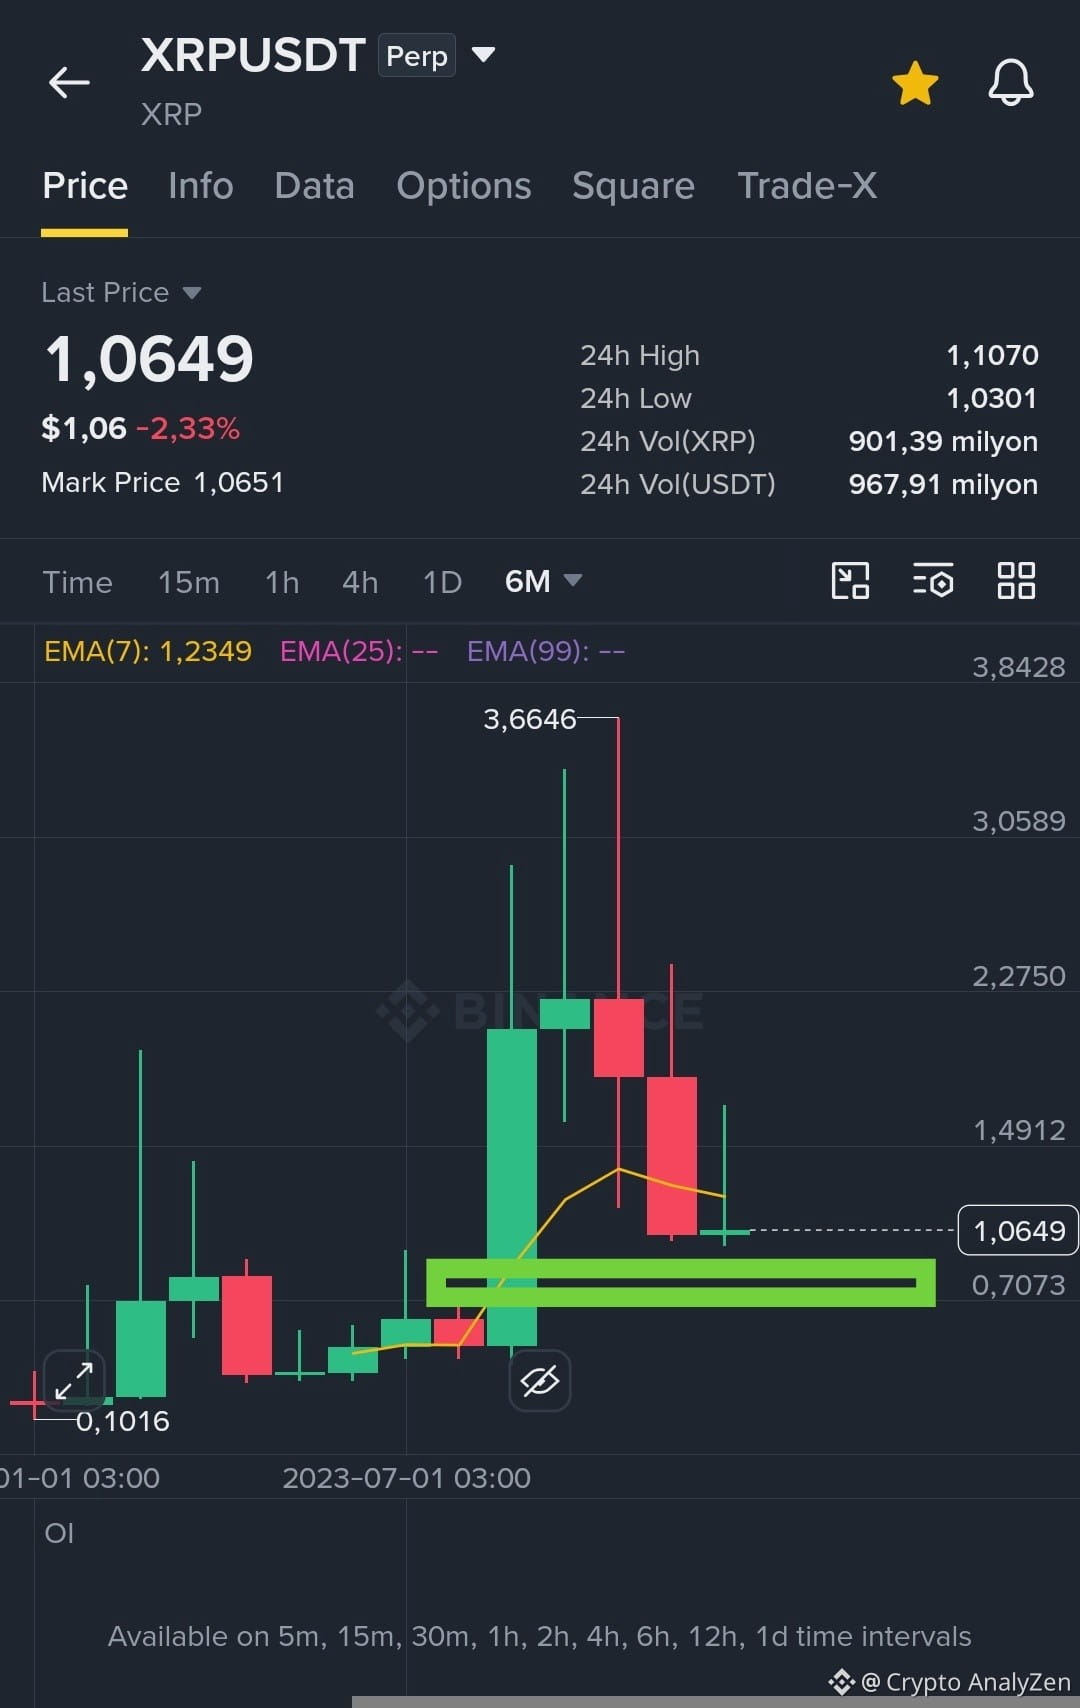
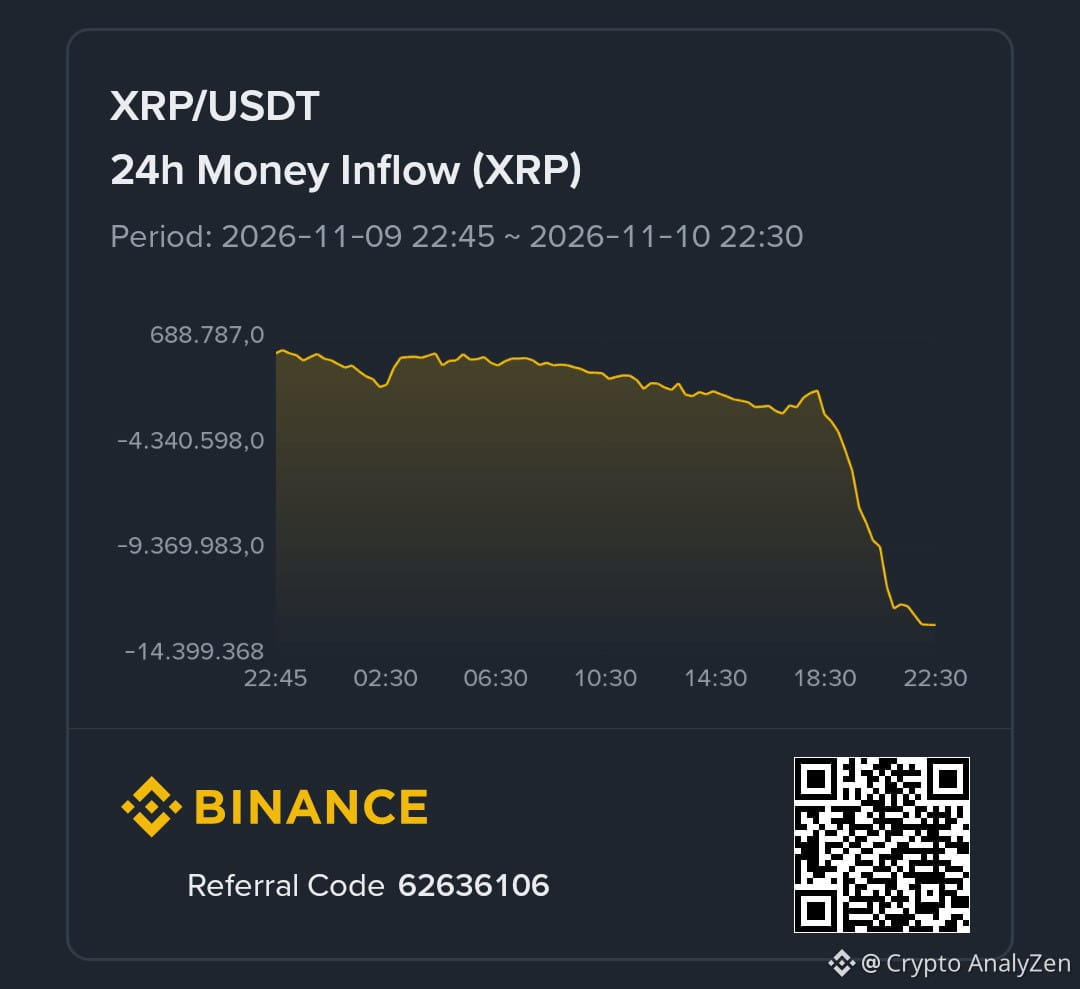
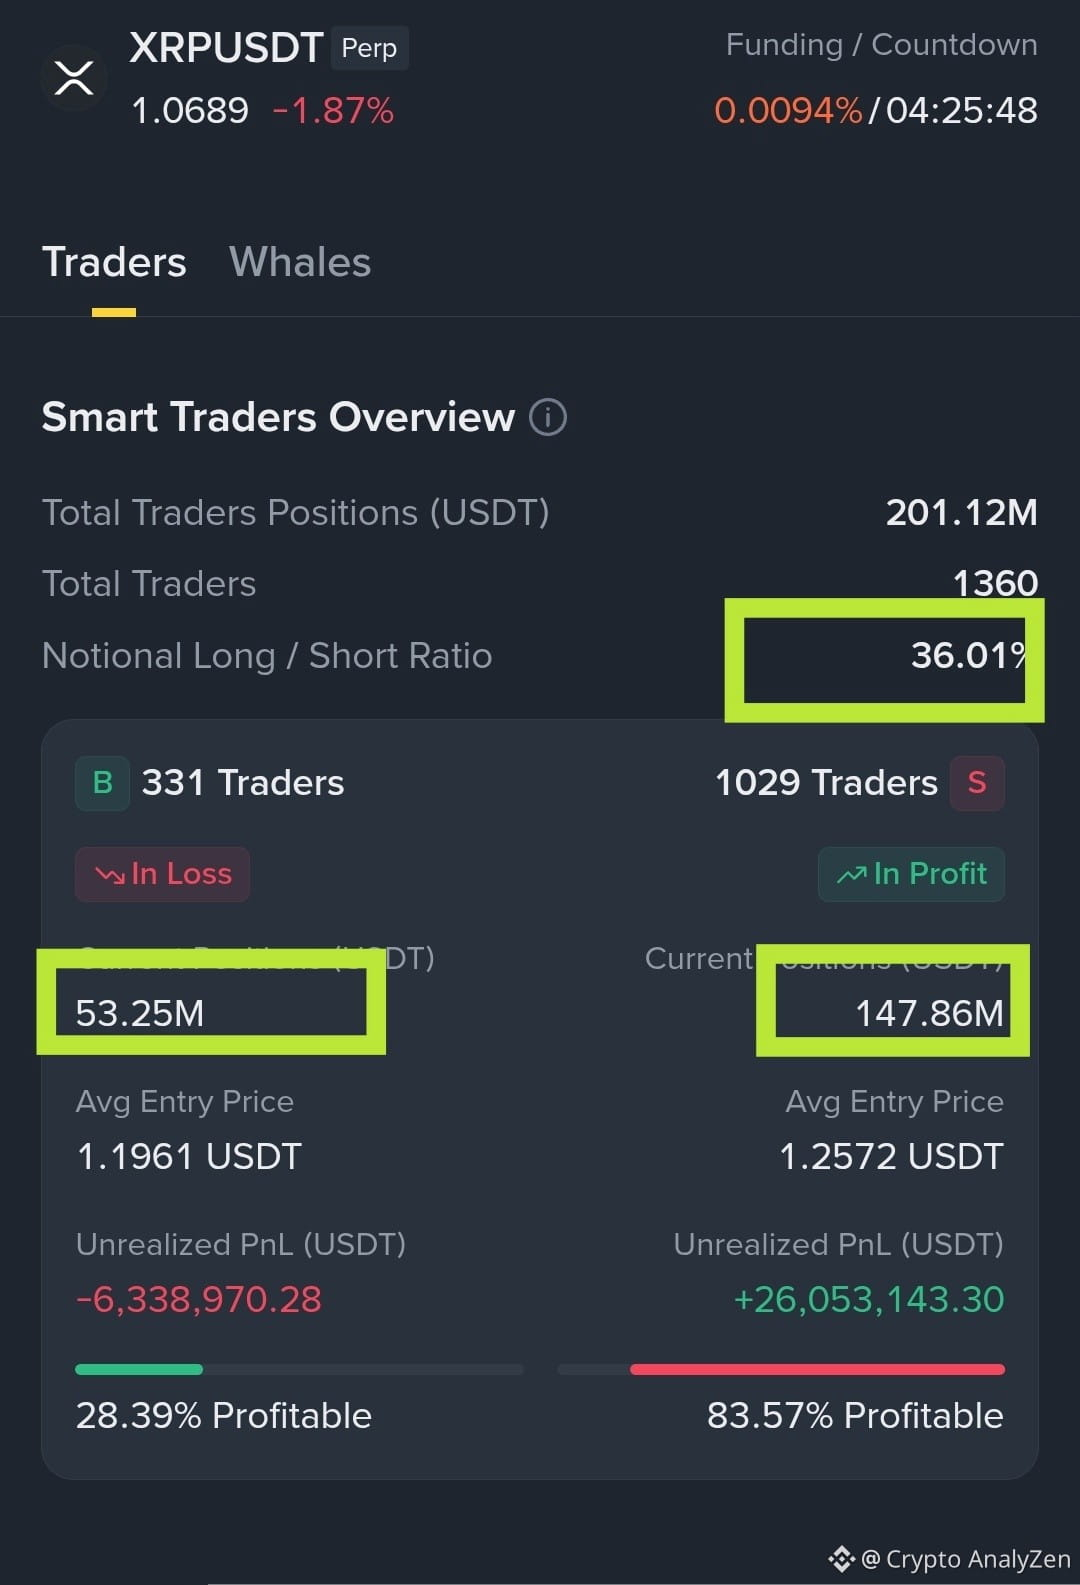
$XRP - Why should expect a complete collapse - 0.73???
Smart Money - Longs have begun to increase and shorts to decrease, which will drag the price much lower before we see a 100% long/short ratio.
Spot - Judge for yourself, the big money dumped everything today.
6-month chart - the most tempting liquidation level is below 0.94.
#XRPRealityCheck #Xrp🔥🔥
{future}(XRPUSDT)
$XRP - Why should expect a complete collapse - 0.73???
Smart Money - Longs have begun to increase and shorts to decrease, which will drag the price much lower before we see a 100% long/short ratio.
Spot - Judge for yourself, the big money dumped everything today.
6-month chart - the most tempting liquidation level is below 0.94.
#XRPRealityCheck #Xrp🔥🔥
Smart Money - Longs have begun to increase and shorts to decrease, which will drag the price much lower before we see a 100% long/short ratio.
Spot - Judge for yourself, the big money dumped everything today.
6-month chart - the most tempting liquidation level is below 0.94.
#XRPRealityCheck #Xrp🔥🔥
1
558

$XRP is struggling to hold its ground, and the bearish momentum is still alive.
$1.07–$1.12 is the critical support zone; losing it could deepen the pain.
A reclaim of $1.13 could bring some relief, but bulls need real strength.
#XRPRealityCheck
{spot}(XRPUSDT)
$XRP is struggling to hold its ground, and the bearish momentum is still alive.
$1.07–$1.12 is the critical support zone; losing it could deepen the pain.
A reclaim of $1.13 could bring some relief, but bulls need real strength.
#XRPRealityCheck
$1.07–$1.12 is the critical support zone; losing it could deepen the pain.
A reclaim of $1.13 could bring some relief, but bulls need real strength.
#XRPRealityCheck
2
1k

·
--
Bearish
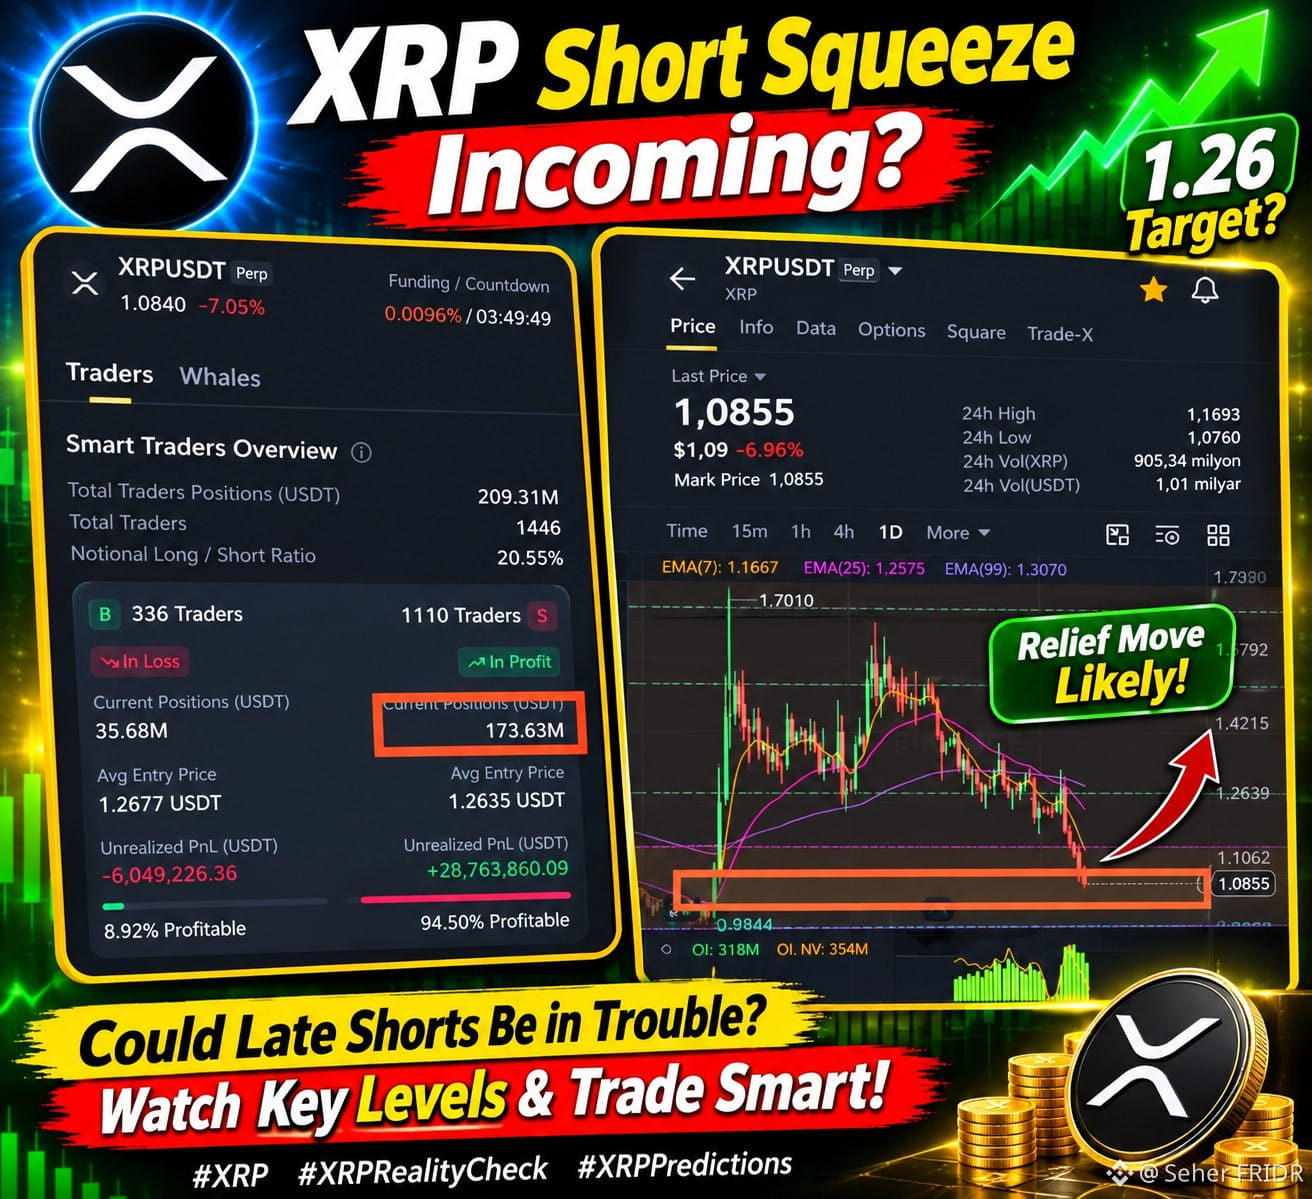
$XRP — SHORT SQUEEZE INCOMING? 👀
Smart Money short volume is rising sharply as XRP reaches the key zone we've been watching for weeks.
Could late shorts be setting themselves up for trouble?
I'm watching $1.26 as a potential relief rally target. A sharp bounce could put pressure on overleveraged short positions.
Will the bulls surprise everyone?
Watch the levels and manage risk carefully.
#XRP #XRPRealityCheck #XRPPredictions
{spot}(XRPUSDT)
$XRP — SHORT SQUEEZE INCOMING? 👀
Smart Money short volume is rising sharply as XRP reaches the key zone we've been watching for weeks.
Could late shorts be setting themselves up for trouble?
I'm watching $1.26 as a potential relief rally target. A sharp bounce could put pressure on overleveraged short positions.
Will the bulls surprise everyone?
Watch the levels and manage risk carefully.
#XRP #XRPRealityCheck #XRPPredictions
Smart Money short volume is rising sharply as XRP reaches the key zone we've been watching for weeks.
Could late shorts be setting themselves up for trouble?
I'm watching $1.26 as a potential relief rally target. A sharp bounce could put pressure on overleveraged short positions.
Will the bulls surprise everyone?
Watch the levels and manage risk carefully.
#XRP #XRPRealityCheck #XRPPredictions
804

·
--
Bullish
The use of $XRP network features for institutional investors has grown nearly 80x in 1 year. Accounts that numbered only a handful in September 2025 had surpassed 500 as of October 21, 2026. Adoption is spreading across issuer-controlled tokens, on-chain credentials, and permissioned trading venues 😈
#XRPRealityCheck #CPITestsDecemberRateOutlook #XRPHACKED #xrpetf
$XRP
{spot}(XRPUSDT)
#NvidiaInvestigatesAfterHuang’sAffairApology
The use of $XRP network features for institutional investors has grown nearly 80x in 1 year. Accounts that numbered only a handful in September 2025 had surpassed 500 as of October 21, 2026. Adoption is spreading across issuer-controlled tokens, on-chain credentials, and permissioned trading venues 😈
#XRPRealityCheck #CPITestsDecemberRateOutlook #XRPHACKED #xrpetf
$XRP
#NvidiaInvestigatesAfterHuang’sAffairApology
#XRPRealityCheck #CPITestsDecemberRateOutlook #XRPHACKED #xrpetf
$XRP
#NvidiaInvestigatesAfterHuang’sAffairApology
77

·
--
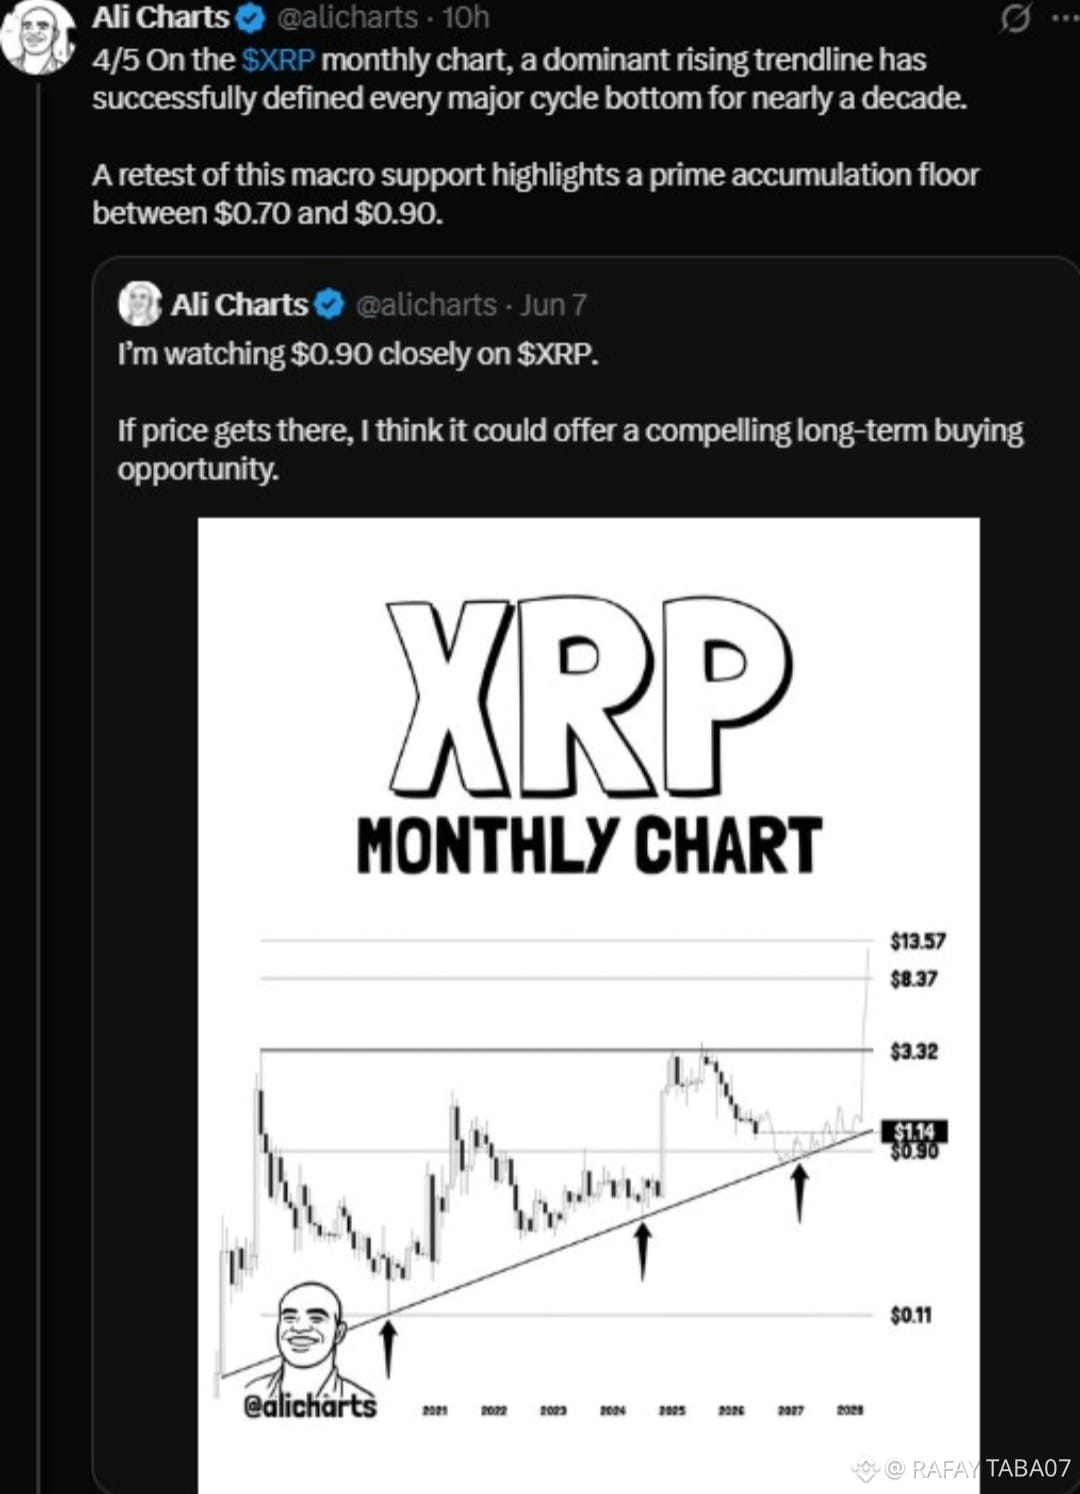
$XRP dipped to $1.07, its lowest since August, and the $1 support is just 9.9% away. It is also the weakest of the top five coins, the only one below its long-term trend line. Does $1 hold? 👇
#xrp #XRPRealityCheck #Xrp🔥🔥 #BinanceSquareTalks
{spot}(XRPUSDT)
$XRP dipped to $1.07, its lowest since August, and the $1 support is just 9.9% away. It is also the weakest of the top five coins, the only one below its long-term trend line. Does $1 hold? 👇
#xrp #XRPRealityCheck #Xrp🔥🔥 #BinanceSquareTalks
#xrp #XRPRealityCheck #Xrp🔥🔥 #BinanceSquareTalks
241

$XRP
Why there and not just under 1.077: the 1.077 low is a single print, and with ATR at 6.2% of price a stop 0.3% beneath it would sit inside normal daily noise. 1.028 is placed below the floor of the S2 band (1.030–1.055), so it is only hit if the first demand shelf under the low fails entirely — which is the actual thesis being tested.
PlacementLevelRisk from 1.080ATR multiplesStructural (below S2)1.0280.052 (4.8%)0.77 ATRVolatility (1 ATR)1.01250.0675 (6.3%)1.00 ATRTight (just under S1)1.0650.015 (1.4%)0.22 ATR
#XRPRealityCheck #ChinaCACListsFiveIssuesAffectingBlockchainFilings #BTC突破7万大关 #BitcoinFiveWeeklyLosses #BTC走势分析
The trade-off is explicit: 0.77 ATR is a tight stop for this instrument, so it raises the chance of being stopped on noise that never invalidates the setup. Widening to 1 ATR costs 6.3% instead of 4.8% and cuts the reward ratios to roughly 1.2R / 1.9R / 3.7R against 1.158 / 1.205 / 1.327, against 1.5R / 2.4R / 4.8R at 1.028.
{spot}(XRPUSDT)
$XRP
Why there and not just under 1.077: the 1.077 low is a single print, and with ATR at 6.2% of price a stop 0.3% beneath it would sit inside normal daily noise. 1.028 is placed below the floor of the S2 band (1.030–1.055), so it is only hit if the first demand shelf under the low fails entirely — which is the actual thesis being tested.
PlacementLevelRisk from 1.080ATR multiplesStructural (below S2)1.0280.052 (4.8%)0.77 ATRVolatility (1 ATR)1.01250.0675 (6.3%)1.00 ATRTight (just under S1)1.0650.015 (1.4%)0.22 ATR
#XRPRealityCheck #ChinaCACListsFiveIssuesAffectingBlockchainFilings #BTC突破7万大关 #BitcoinFiveWeeklyLosses #BTC走势分析
The trade-off is explicit: 0.77 ATR is a tight stop for this instrument, so it raises the chance of being stopped on noise that never invalidates the setup. Widening to 1 ATR costs 6.3% instead of 4.8% and cuts the reward ratios to roughly 1.2R / 1.9R / 3.7R against 1.158 / 1.205 / 1.327, against 1.5R / 2.4R / 4.8R at 1.028.
Why there and not just under 1.077: the 1.077 low is a single print, and with ATR at 6.2% of price a stop 0.3% beneath it would sit inside normal daily noise. 1.028 is placed below the floor of the S2 band (1.030–1.055), so it is only hit if the first demand shelf under the low fails entirely — which is the actual thesis being tested.
PlacementLevelRisk from 1.080ATR multiplesStructural (below S2)1.0280.052 (4.8%)0.77 ATRVolatility (1 ATR)1.01250.0675 (6.3%)1.00 ATRTight (just under S1)1.0650.015 (1.4%)0.22 ATR
#XRPRealityCheck #ChinaCACListsFiveIssuesAffectingBlockchainFilings #BTC突破7万大关 #BitcoinFiveWeeklyLosses #BTC走势分析
The trade-off is explicit: 0.77 ATR is a tight stop for this instrument, so it raises the chance of being stopped on noise that never invalidates the setup. Widening to 1 ATR costs 6.3% instead of 4.8% and cuts the reward ratios to roughly 1.2R / 1.9R / 3.7R against 1.158 / 1.205 / 1.327, against 1.5R / 2.4R / 4.8R at 1.028.
1
123
·
--
Bullish
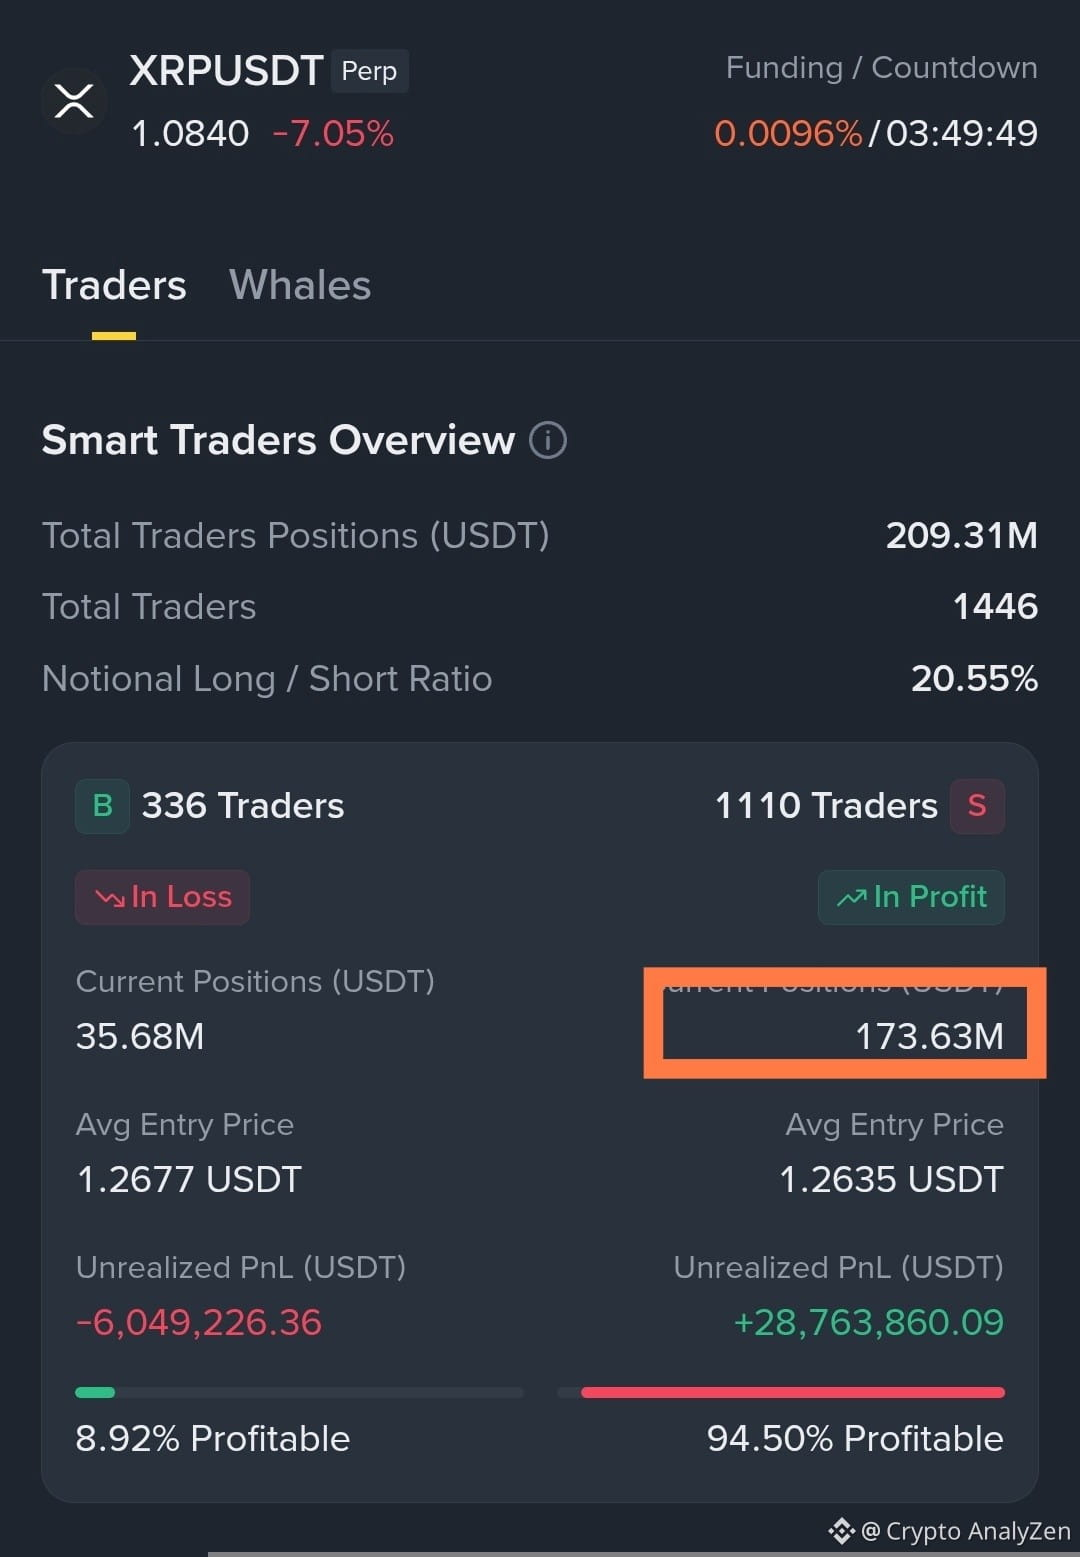
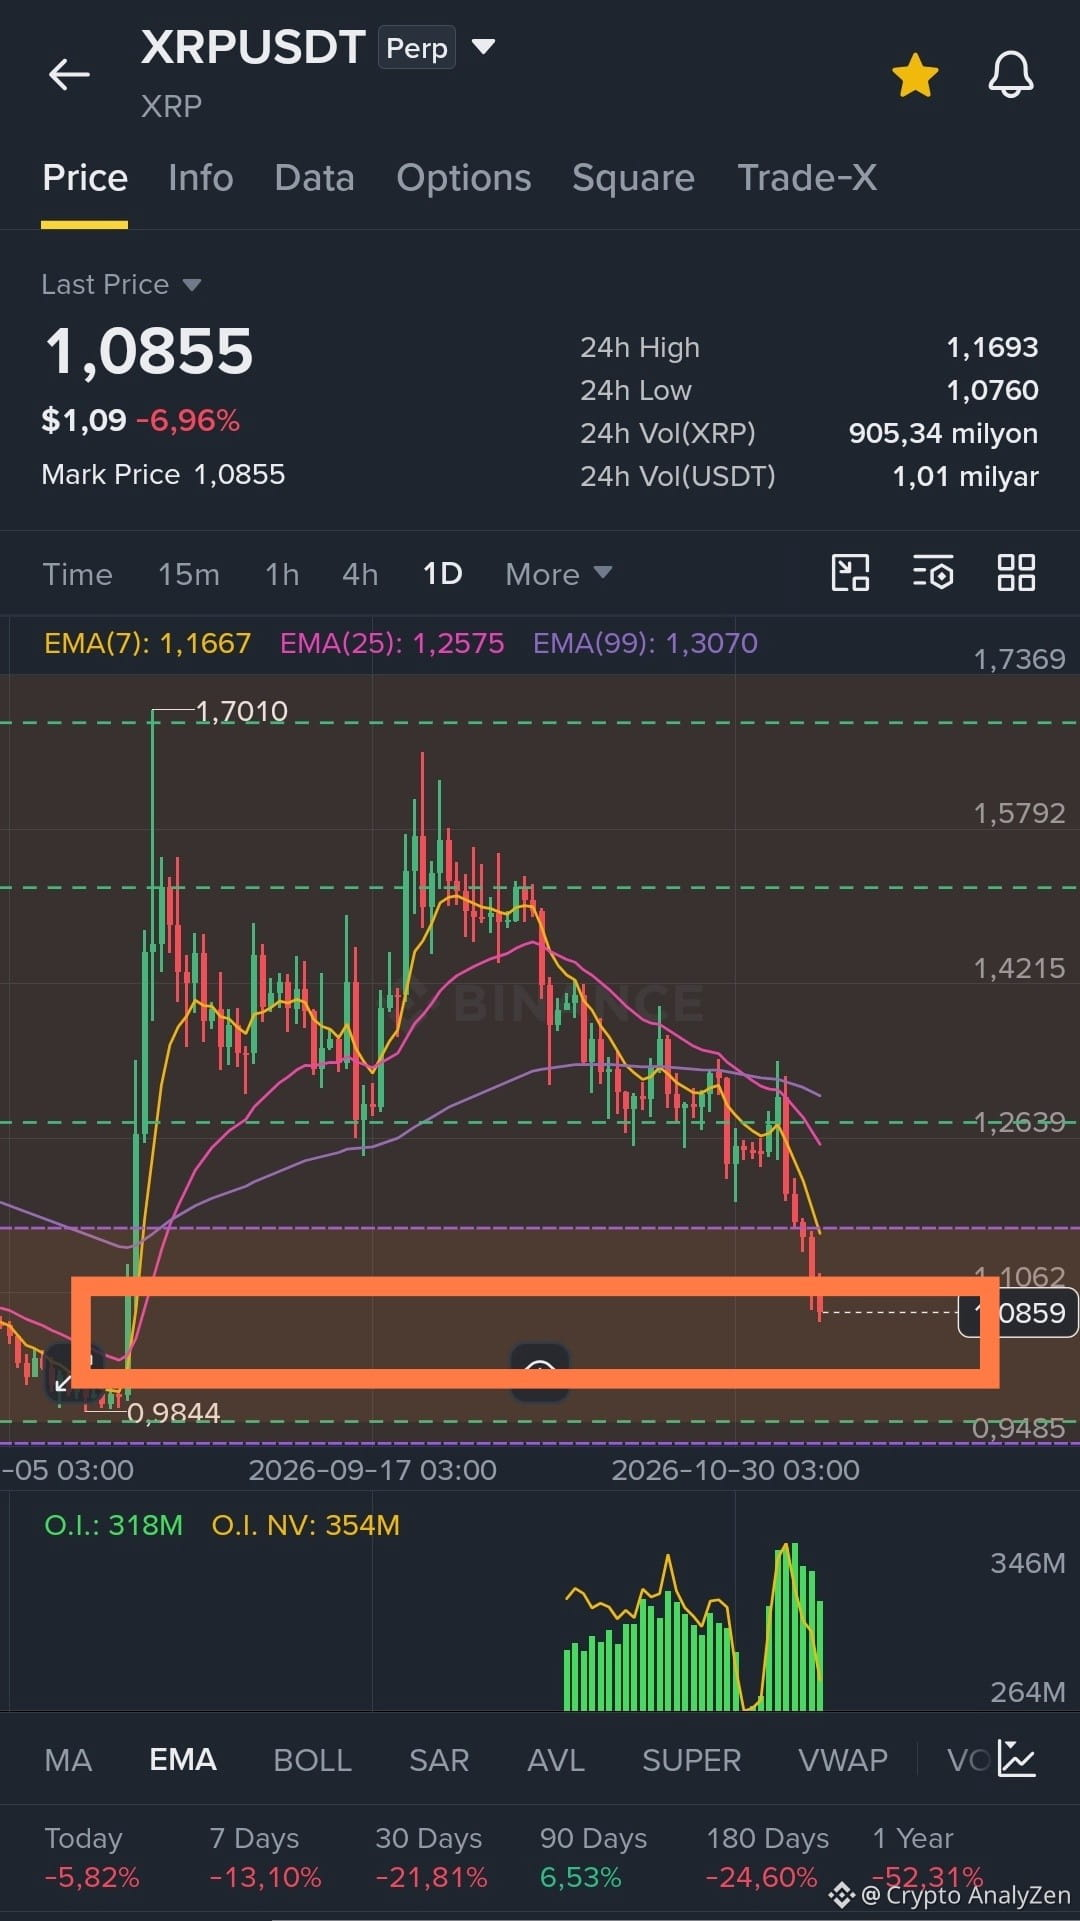
$XRP - wow, short volume on Smart Money has increased sharply ;)
So, when the price reached the coveted zone—which I've been pointing out for weeks—did everyone finally start opening shorts?
Haha, what does that mean?
I'm expecting a relief move up ;) 1.26 - the most painful level for shorts
Sharp and disastrous for late shorts ;)
#XRPRealityCheck #XRPPredictions
{future}(XRPUSDT)
$XRP - wow, short volume on Smart Money has increased sharply ;)
So, when the price reached the coveted zone—which I've been pointing out for weeks—did everyone finally start opening shorts?
Haha, what does that mean?
I'm expecting a relief move up ;) 1.26 - the most painful level for shorts
Sharp and disastrous for late shorts ;)
#XRPRealityCheck #XRPPredictions
So, when the price reached the coveted zone—which I've been pointing out for weeks—did everyone finally start opening shorts?
Haha, what does that mean?
I'm expecting a relief move up ;) 1.26 - the most painful level for shorts
Sharp and disastrous for late shorts ;)
#XRPRealityCheck #XRPPredictions
User-6279aa89:
Follow me and I’ll follow you back; let’s grow together on Binance Square; New to crypto and want to learn Trade
2
1
43
93.9k

·
--
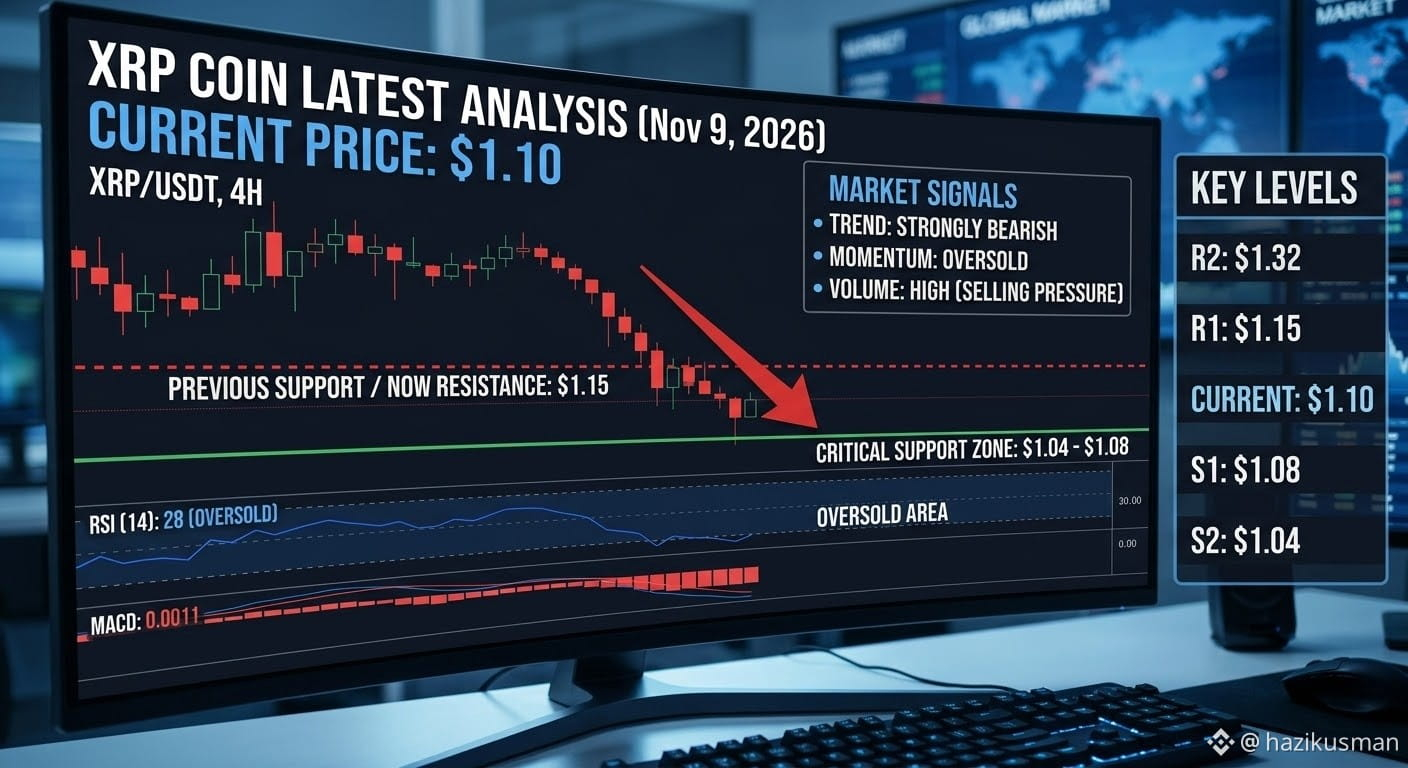
$XRP is facing significant downward momentum, trading at approximately $1.10. This follows a sustained sell-off over the last week.
Technical Outlook: Downtrend Confirmed
The latest price action shows XRP has decisively broken below previous horizontal support at $1.15, which now flips to immediate resistance. The breakdown was driven by a strong increase in selling volume, confirming the bearish trend.
Crucial Support Zone: All eyes are now on the critical support band between $1.04 and $1.08. This range was a significant launchpad in August and represents a major demand zone.
A "Long Squeeze": The recent sharp decline has been exacerbated by a "long squeeze," leading to over $1 billion in long position liquidations in the futures market.
Oversold Signals: Lower timeframe indicators, particularly the 4-hour RSI, are registering deeply oversold readings, currently sitting at 24. While a temporary technical bounce is possible, the primary daily and weekly trends remain strongly bearish.
#Earn10USDT #XRPRealityCheck #UKBanksCanNowApplyToConductCryptoAssetBusiness
$XRP is facing significant downward momentum, trading at approximately $1.10. This follows a sustained sell-off over the last week.
Technical Outlook: Downtrend Confirmed
The latest price action shows XRP has decisively broken below previous horizontal support at $1.15, which now flips to immediate resistance. The breakdown was driven by a strong increase in selling volume, confirming the bearish trend.
Crucial Support Zone: All eyes are now on the critical support band between $1.04 and $1.08. This range was a significant launchpad in August and represents a major demand zone.
A "Long Squeeze": The recent sharp decline has been exacerbated by a "long squeeze," leading to over $1 billion in long position liquidations in the futures market.
Oversold Signals: Lower timeframe indicators, particularly the 4-hour RSI, are registering deeply oversold readings, currently sitting at 24. While a temporary technical bounce is possible, the primary daily and weekly trends remain strongly bearish.
#Earn10USDT #XRPRealityCheck #UKBanksCanNowApplyToConductCryptoAssetBusiness
Technical Outlook: Downtrend Confirmed
The latest price action shows XRP has decisively broken below previous horizontal support at $1.15, which now flips to immediate resistance. The breakdown was driven by a strong increase in selling volume, confirming the bearish trend.
Crucial Support Zone: All eyes are now on the critical support band between $1.04 and $1.08. This range was a significant launchpad in August and represents a major demand zone.
A "Long Squeeze": The recent sharp decline has been exacerbated by a "long squeeze," leading to over $1 billion in long position liquidations in the futures market.
Oversold Signals: Lower timeframe indicators, particularly the 4-hour RSI, are registering deeply oversold readings, currently sitting at 24. While a temporary technical bounce is possible, the primary daily and weekly trends remain strongly bearish.
#Earn10USDT #XRPRealityCheck #UKBanksCanNowApplyToConductCryptoAssetBusiness
71

·
--
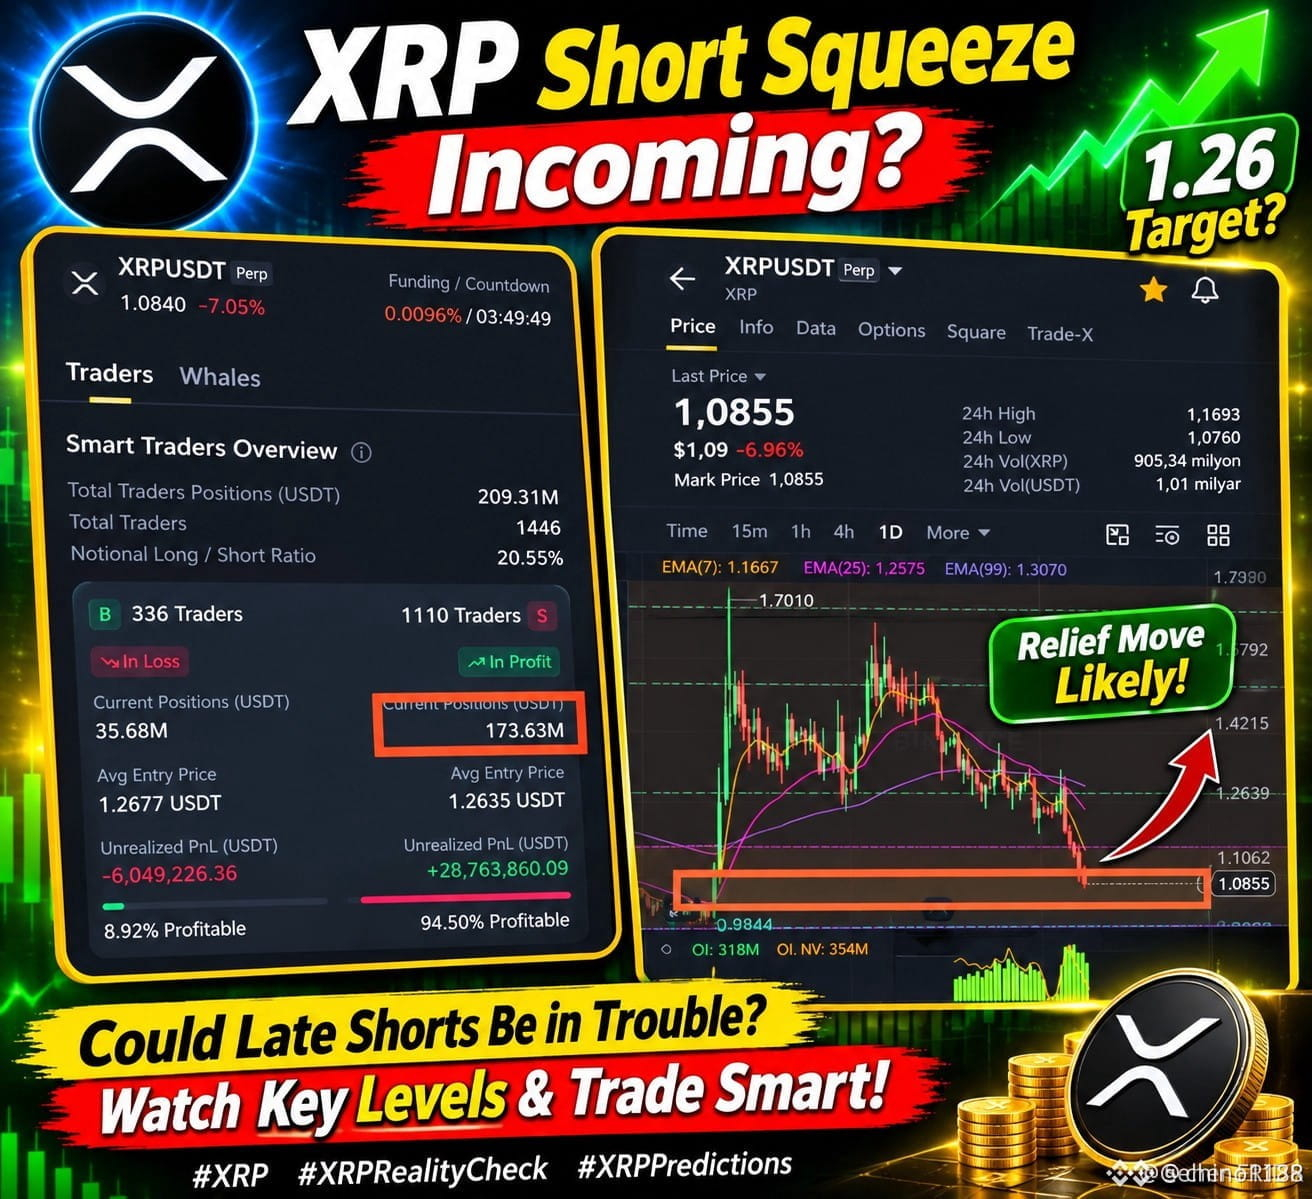
$XRP — IS A SHORT SQUEEZE COMING? 👀
Institutional investors’ short positions are rising sharply as XRP reaches the key zone we’ve been watching for weeks.
Could those who opened short positions late be getting into trouble?
I’m watching $1.26 as a possible target for a relief rally. A sharp bounce could put pressure on overleveraged short positions.
Will the bulls surprise everyone?
Watch the levels and manage risk carefully.
#XRP #XRPRealityCheck #XRPPredictions
$XRP — IS A SHORT SQUEEZE COMING? 👀
Institutional investors’ short positions are rising sharply as XRP reaches the key zone we’ve been watching for weeks.
Could those who opened short positions late be getting into trouble?
I’m watching $1.26 as a possible target for a relief rally. A sharp bounce could put pressure on overleveraged short positions.
Will the bulls surprise everyone?
Watch the levels and manage risk carefully.
#XRP #XRPRealityCheck #XRPPredictions
Institutional investors’ short positions are rising sharply as XRP reaches the key zone we’ve been watching for weeks.
Could those who opened short positions late be getting into trouble?
I’m watching $1.26 as a possible target for a relief rally. A sharp bounce could put pressure on overleveraged short positions.
Will the bulls surprise everyone?
Watch the levels and manage risk carefully.
#XRP #XRPRealityCheck #XRPPredictions
Erik Hohm cedP:
XRP sigue a BTC, si el BTC sigue cayendo tambien lo hara XRP.
1
1
579

$XRP Market outlook: XRP's short-term direction depends on whether buyers can regain momentum and overcome nearby resistance. Watch support levels for signs of weakness and resistance for signs of recovery.
XRP Price Graph & Key Levels
Indicator Level
Current price $1.11
Support $1.09
Resistance $1.14–$1.24
Trend Bearish
Technical outlook: XRP is showing bearish momentum. A move above $1.14 could indicate improving strength, while weakness below $1.09 may signal further downside. #BitcoinFiveWeeklyLosses #XRPRealityCheck #XRPHACKED #XRPPredictions #Xrp🔥🔥
$XRP Market outlook: XRP's short-term direction depends on whether buyers can regain momentum and overcome nearby resistance. Watch support levels for signs of weakness and resistance for signs of recovery.
XRP Price Graph & Key Levels
Indicator Level
Current price $1.11
Support $1.09
Resistance $1.14–$1.24
Trend Bearish
Technical outlook: XRP is showing bearish momentum. A move above $1.14 could indicate improving strength, while weakness below $1.09 may signal further downside. #BitcoinFiveWeeklyLosses #XRPRealityCheck #XRPHACKED #XRPPredictions #Xrp🔥🔥
XRP Price Graph & Key Levels
Indicator Level
Current price $1.11
Support $1.09
Resistance $1.14–$1.24
Trend Bearish
Technical outlook: XRP is showing bearish momentum. A move above $1.14 could indicate improving strength, while weakness below $1.09 may signal further downside. #BitcoinFiveWeeklyLosses #XRPRealityCheck #XRPHACKED #XRPPredictions #Xrp🔥🔥
102
·
--
Bearish
$XRP
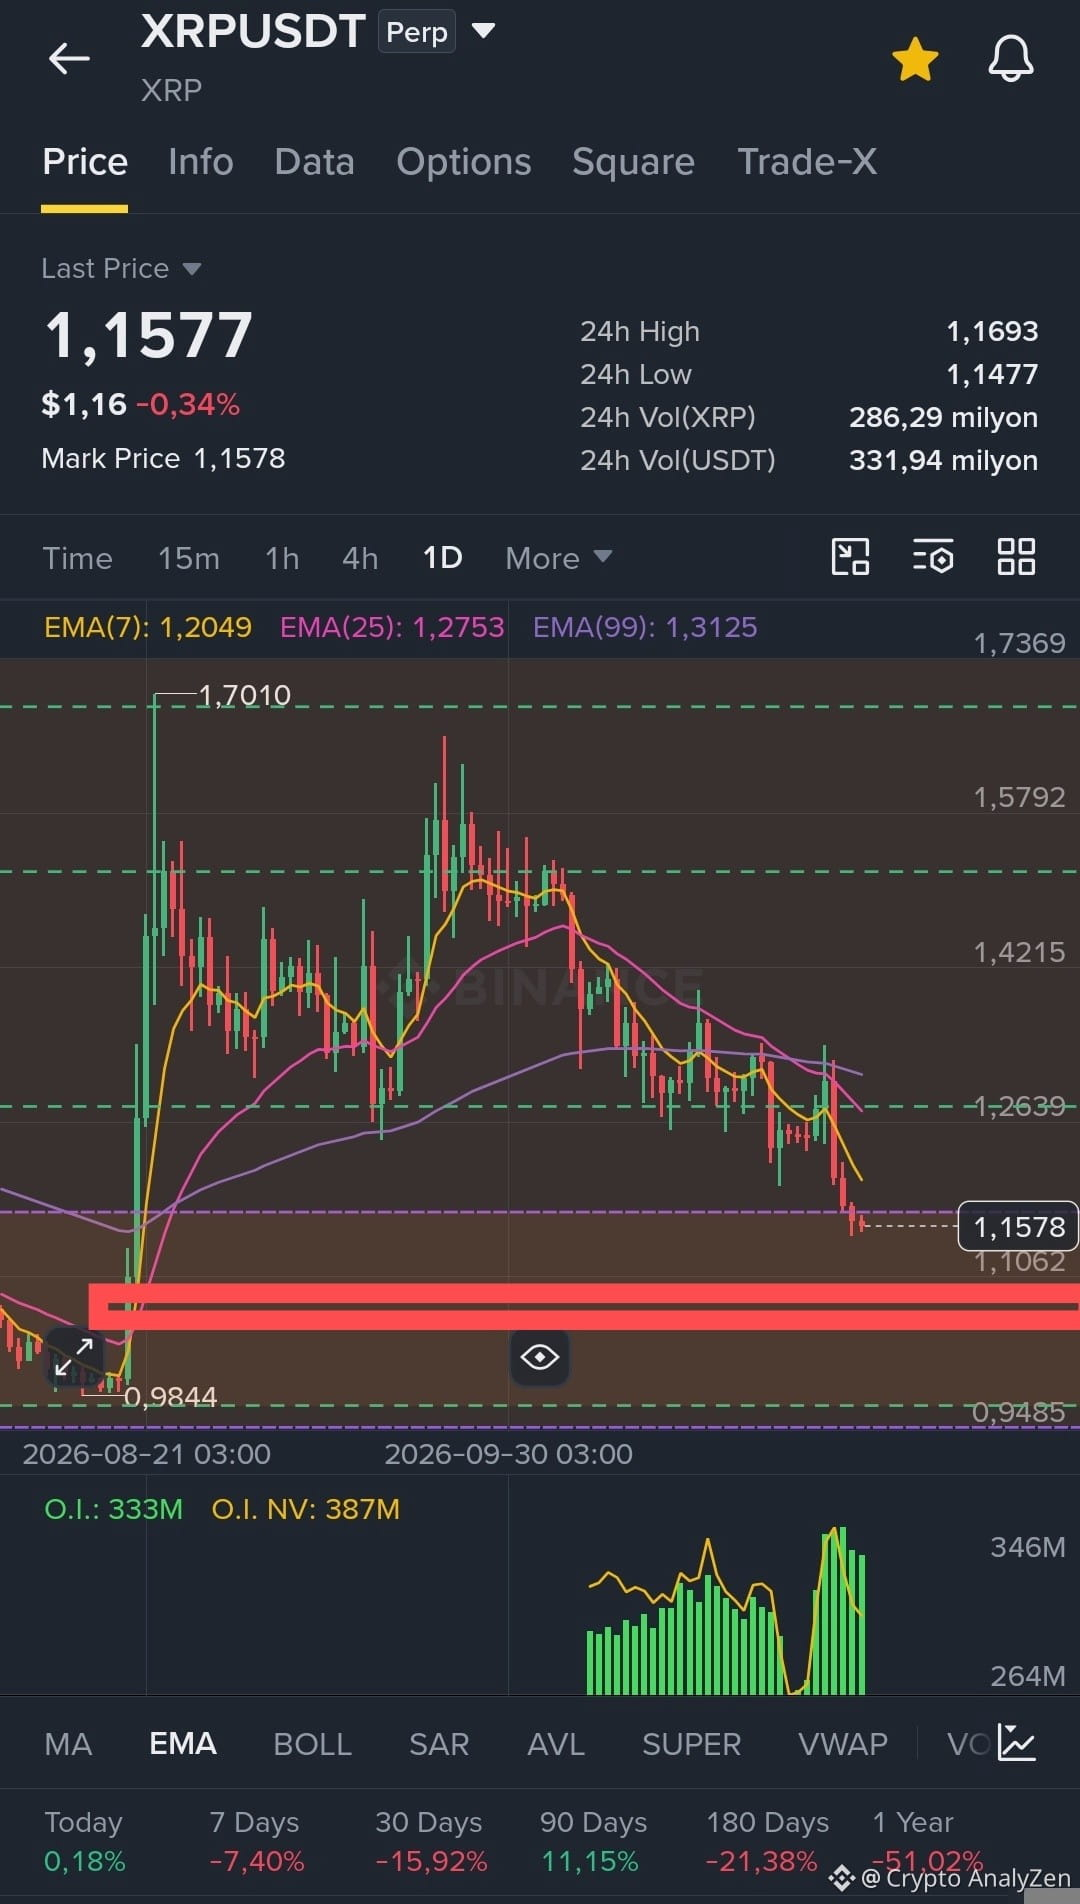
Last state -
Massive short pressure continues, but the price seems to be frozen in place
Risk of upward relief, but I don't think we'll go above 1.27
The annual gap zone remains in place with a lower limit of 0.94
#XRPPredictions #XRPRealityCheck
$XRP
Last state -
Massive short pressure continues, but the price seems to be frozen in place
Risk of upward relief, but I don't think we'll go above 1.27
The annual gap zone remains in place with a lower limit of 0.94
#XRPPredictions #XRPRealityCheck
Last state -
Massive short pressure continues, but the price seems to be frozen in place
Risk of upward relief, but I don't think we'll go above 1.27
The annual gap zone remains in place with a lower limit of 0.94
#XRPPredictions #XRPRealityCheck
4
2.3k
·
--
Bullish
to all you idiots who keep saying XRP is a scam
do yourself a favor and sell your XRP already
take that money and get yourself some health insurance, maybe they can finally do something about that stupid-ass brain of yours 😂
#XRPHACKED #XRPRealityCheck #xrpetf #XRPPredictions #XRP’
$XRP
{spot}(XRPUSDT)
to all you idiots who keep saying XRP is a scam
do yourself a favor and sell your XRP already
take that money and get yourself some health insurance, maybe they can finally do something about that stupid-ass brain of yours 😂
#XRPHACKED #XRPRealityCheck #xrpetf #XRPPredictions #XRP’
$XRP
do yourself a favor and sell your XRP already
take that money and get yourself some health insurance, maybe they can finally do something about that stupid-ass brain of yours 😂
#XRPHACKED #XRPRealityCheck #xrpetf #XRPPredictions #XRP’
$XRP

أبو مارية:
ههههههههه
2
2
1.3k
·
--
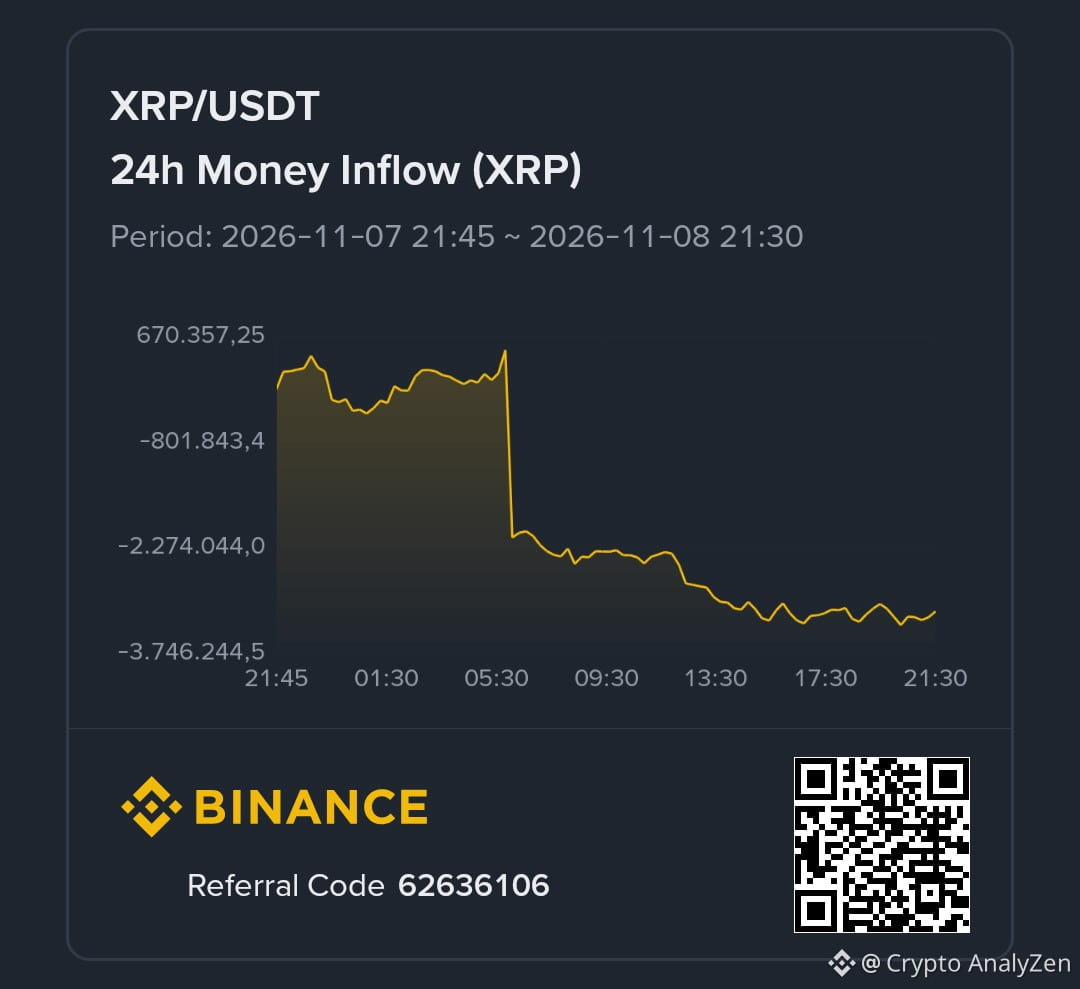
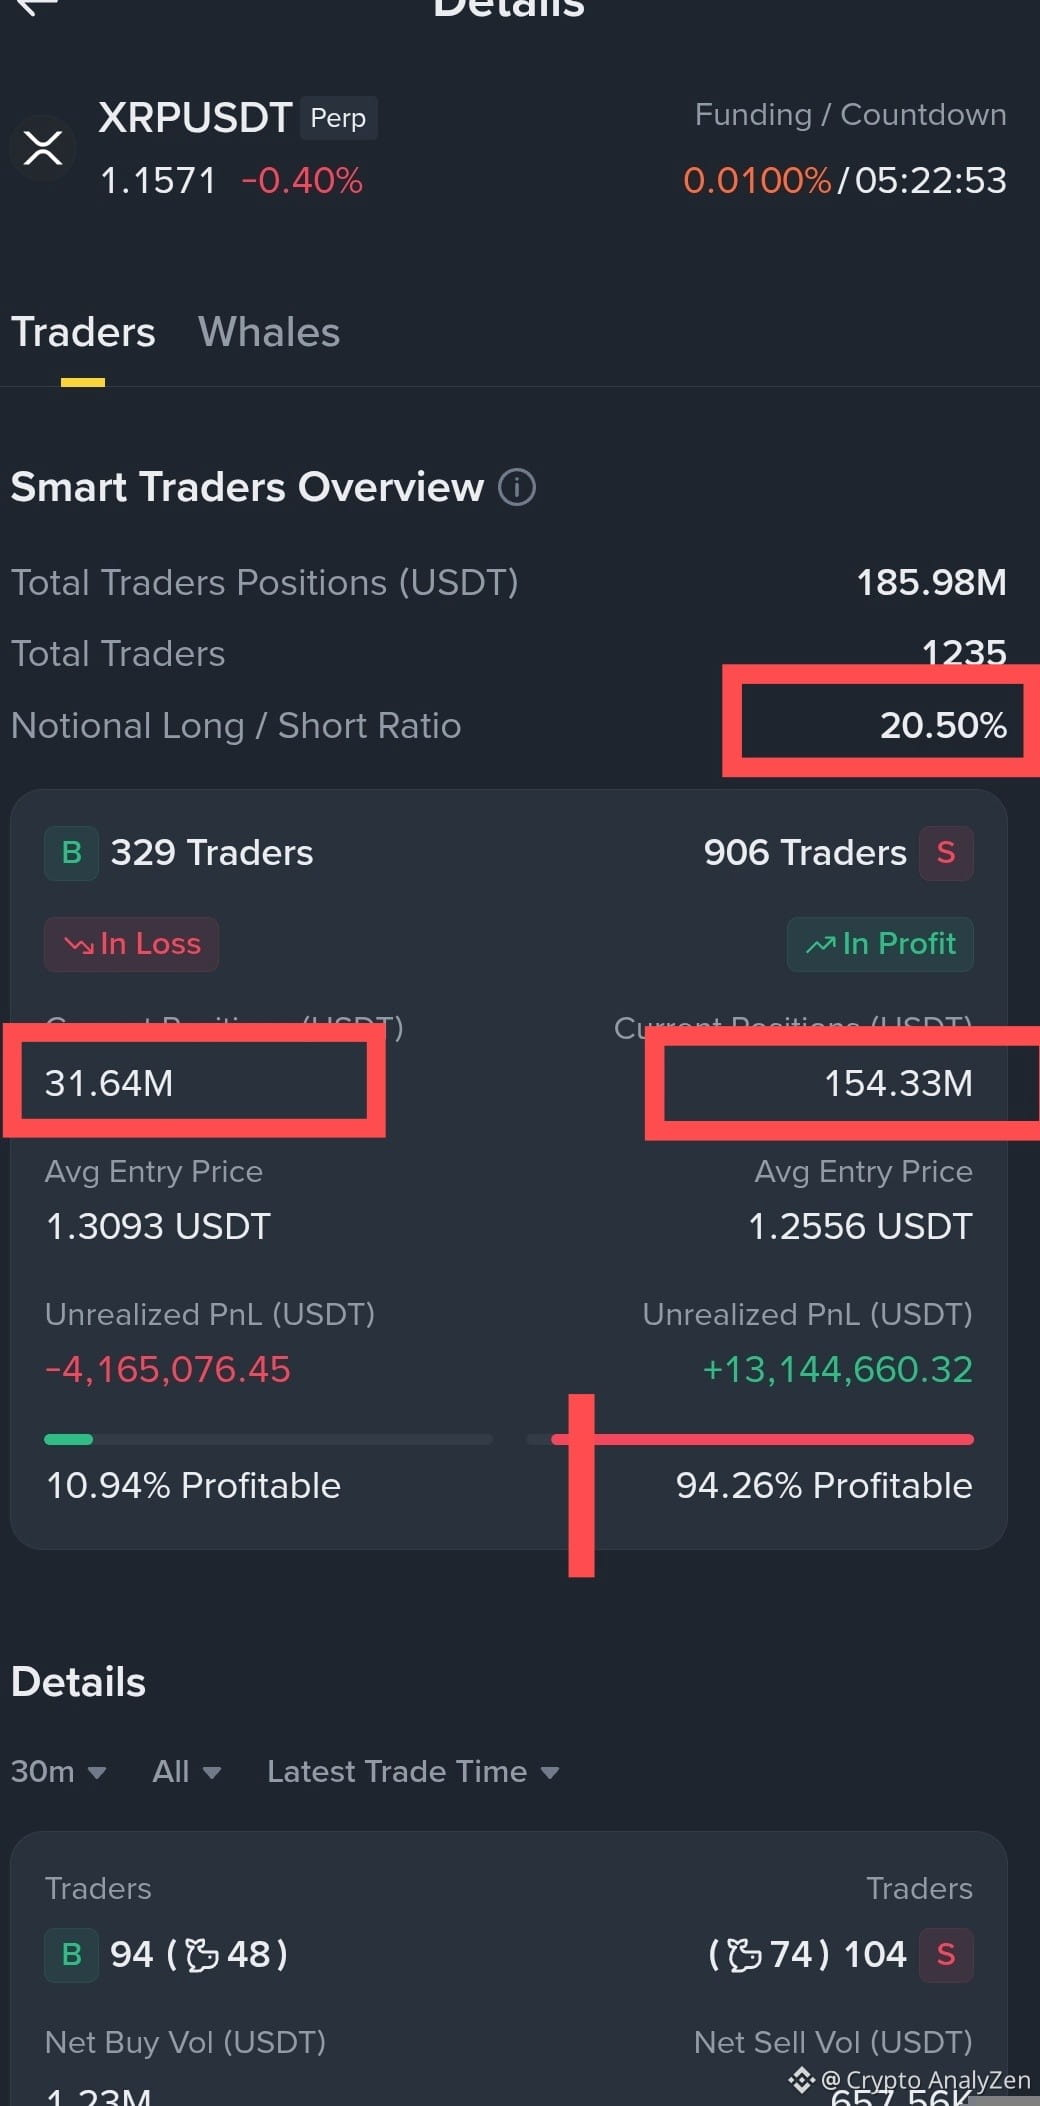
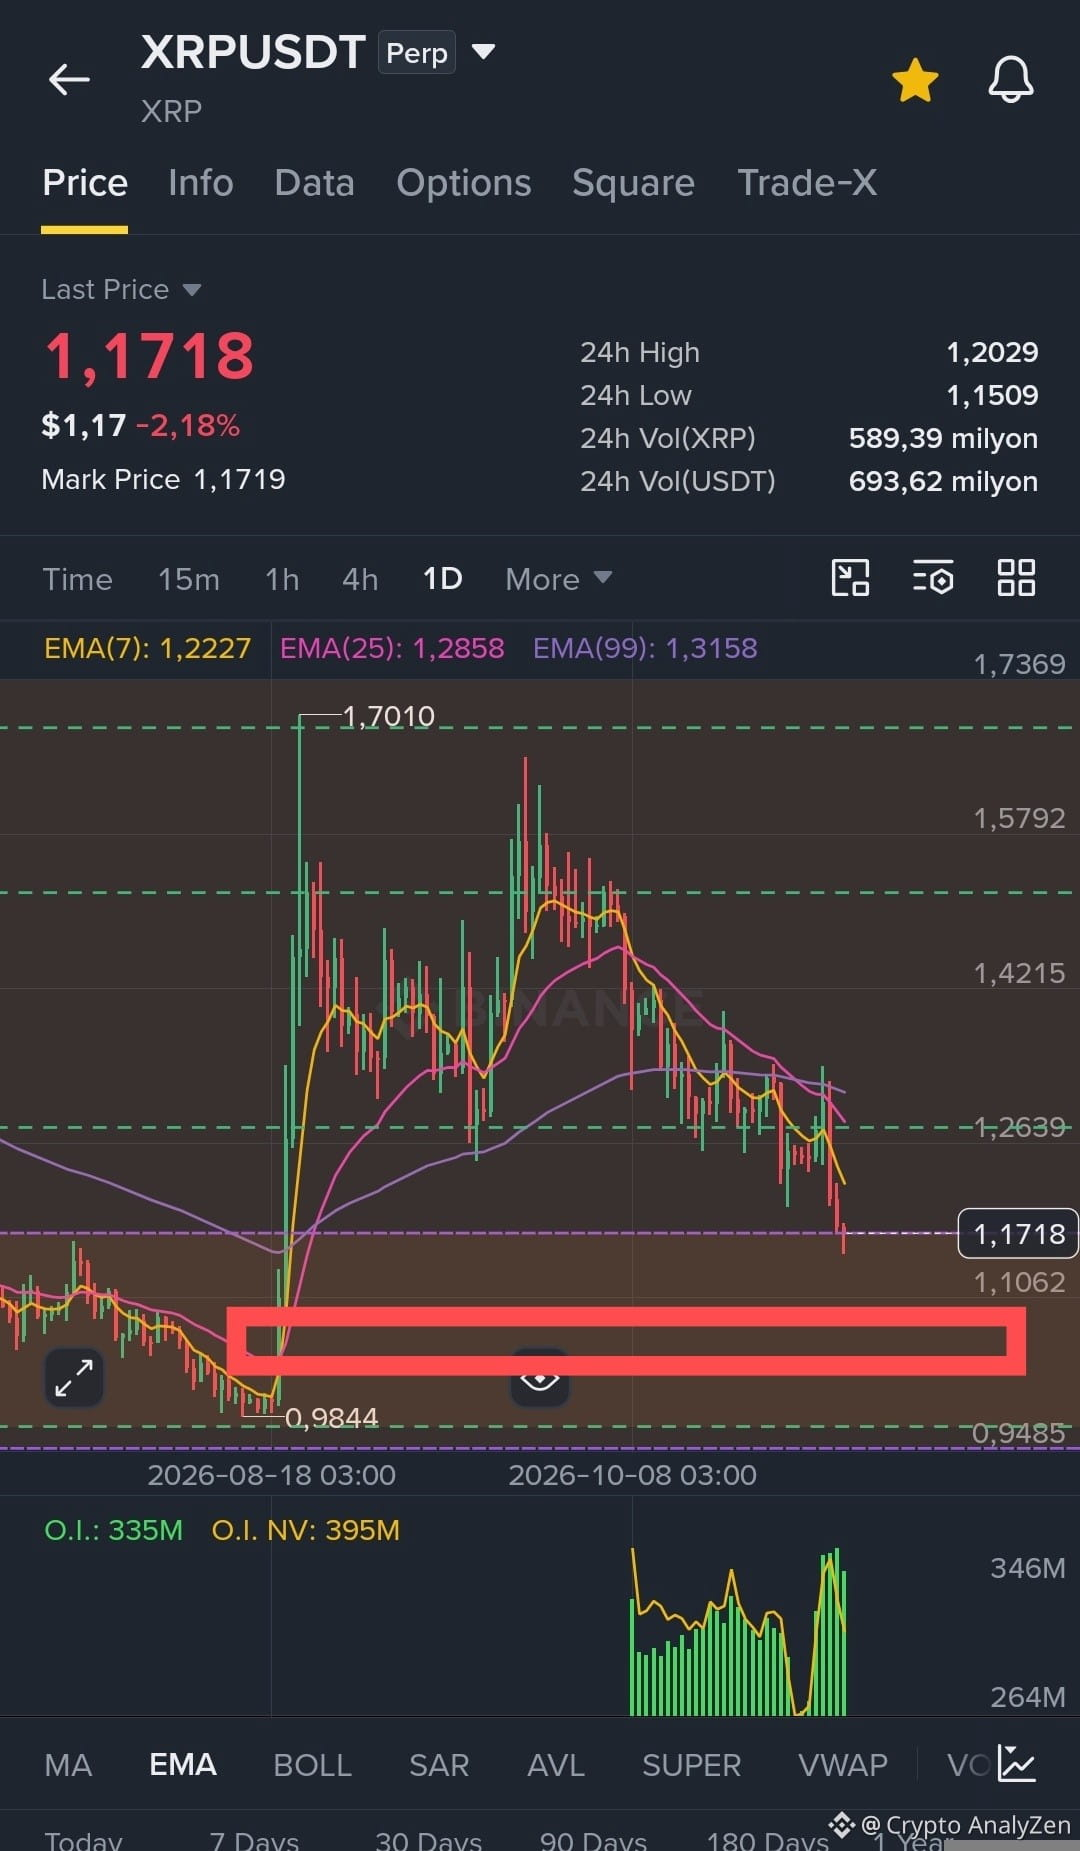
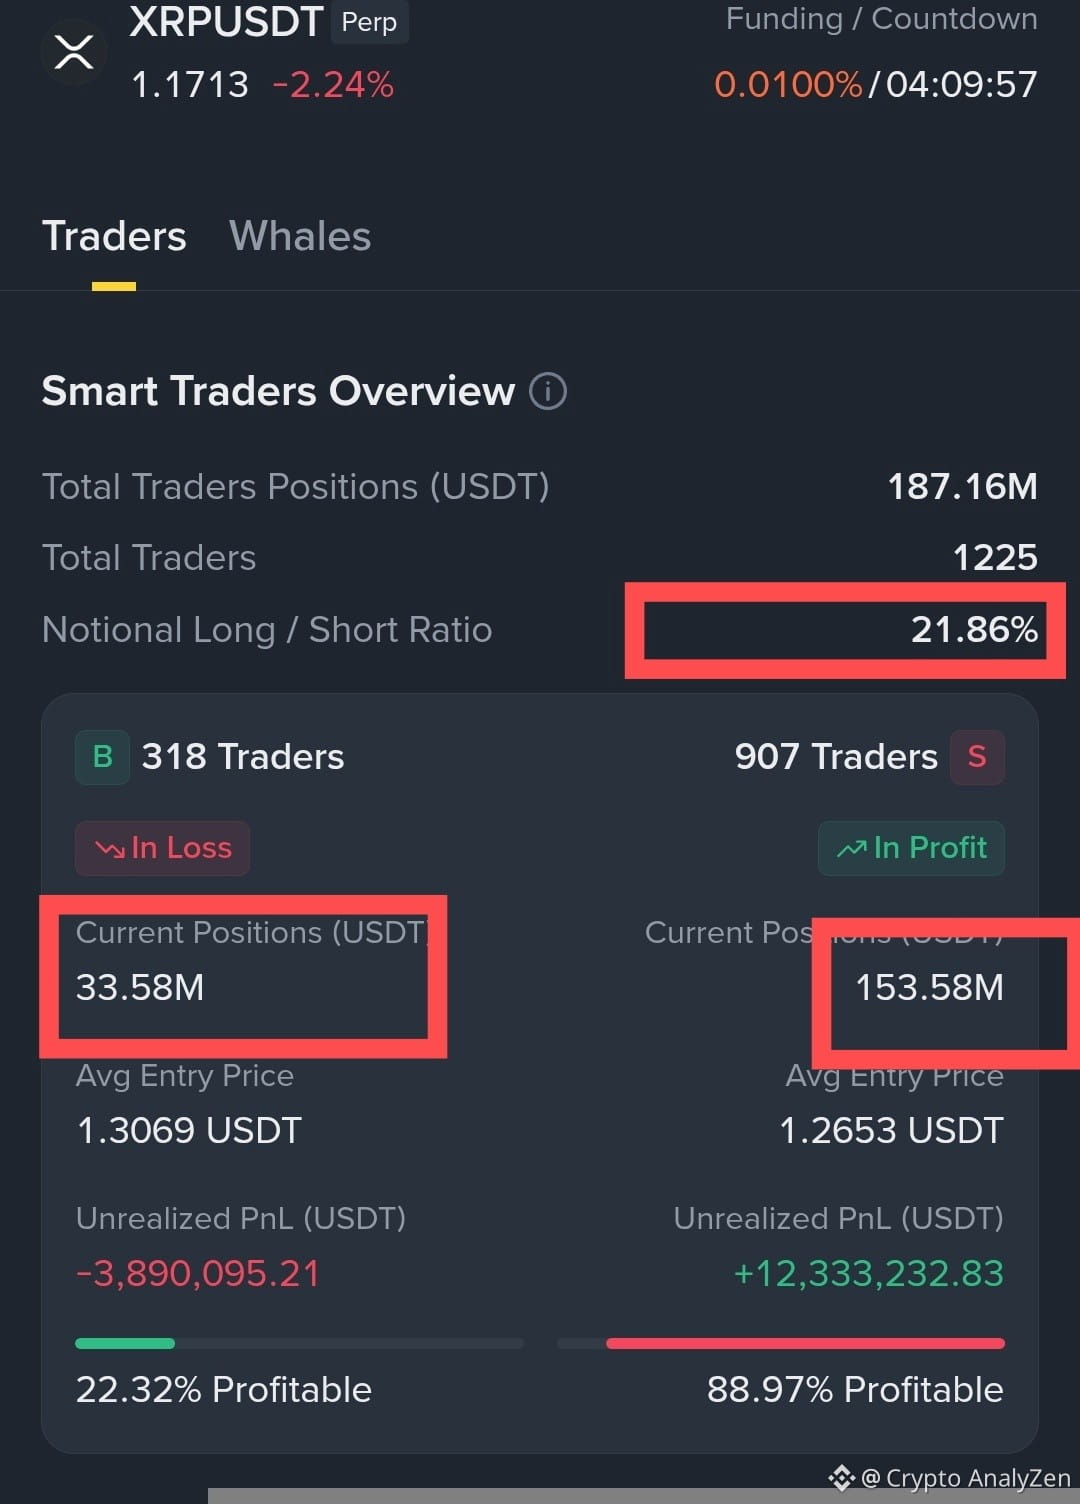
Bearish
$XRP - TOO EARLY to open longs!
There are no signs on the spot to accumulate positions.
Smart Money - shorts are 5 times larger than longs.
What does this mean?
It's likely that massive shorts are quietly and gradually closing in parts, along with new shorts being opened, which is pulling the price down, sweeping away early-opened longs.
What's the target level?
A sharp closing of such a large number of shorts could trigger an even deeper decline to 1.049.
#XRPRealityCheck #XRPPredictions
{future}(XRPUSDT)
$XRP - TOO EARLY to open longs!
There are no signs on the spot to accumulate positions.
Smart Money - shorts are 5 times larger than longs.
What does this mean?
It's likely that massive shorts are quietly and gradually closing in parts, along with new shorts being opened, which is pulling the price down, sweeping away early-opened longs.
What's the target level?
A sharp closing of such a large number of shorts could trigger an even deeper decline to 1.049.
#XRPRealityCheck #XRPPredictions
There are no signs on the spot to accumulate positions.
Smart Money - shorts are 5 times larger than longs.
What does this mean?
It's likely that massive shorts are quietly and gradually closing in parts, along with new shorts being opened, which is pulling the price down, sweeping away early-opened longs.
What's the target level?
A sharp closing of such a large number of shorts could trigger an even deeper decline to 1.049.
#XRPRealityCheck #XRPPredictions
5
3.8k

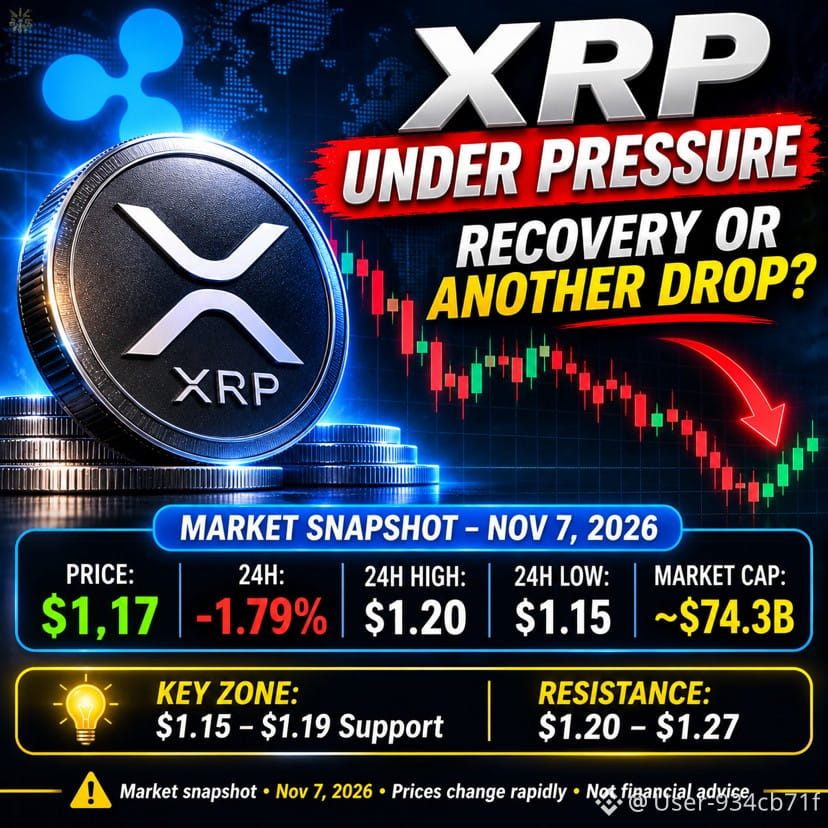
🧭The XRP market is facing another challenging session as selling pressure continues to affect the broader marketing. 🔥 What's Happening?
XRP sentiment has weakened significantly.
Binance reportedly recorded a major XRP outflow of 418.5 million tokens on November 6.
Analysts are watching the $1.19 support area closely.
Some market analysts warn that XRP could revisit the $0.99 level if selling pressure continues. #XRPRealityCheck $XRP
{spot}(XRPUSDT)
🧭The XRP market is facing another challenging session as selling pressure continues to affect the broader marketing. 🔥 What's Happening?
XRP sentiment has weakened significantly.
Binance reportedly recorded a major XRP outflow of 418.5 million tokens on November 6.
Analysts are watching the $1.19 support area closely.
Some market analysts warn that XRP could revisit the $0.99 level if selling pressure continues. #XRPRealityCheck $XRP
XRP sentiment has weakened significantly.
Binance reportedly recorded a major XRP outflow of 418.5 million tokens on November 6.
Analysts are watching the $1.19 support area closely.
Some market analysts warn that XRP could revisit the $0.99 level if selling pressure continues. #XRPRealityCheck $XRP
176

·
--
Verified

Article
XRP weekly chart analysisIn 3 points
1. Weekly technicals:
Price is below all the EMAs (EMA7 1.3095 / EMA25 1.3390 / EMA200 1.3698). That's why resistance around $1.34-1.40, with support at $1.25-1.30, remains important for a recovery. It needs to close above $1.34 to invalidate the bearish setup.
2. Regulatory - the CLARITY Act is dead for now
The House had voted 294-134 on July 17, 2025, but the Senate failed to pass it on September 15, 2026, with a 49-50 vote (60 votes were needed). As of November 3, 2026, it still isn't law. No more Q2 catalyst—we're in an agency-led regulatory phase with the SEC/CFTC.
XRP weekly chart analysis
In 3 points
1. Weekly technicals:
Price is below all the EMAs (EMA7 1.3095 / EMA25 1.3390 / EMA200 1.3698). That's why resistance around $1.34-1.40, with support at $1.25-1.30, remains important for a recovery. It needs to close above $1.34 to invalidate the bearish setup.
2. Regulatory - the CLARITY Act is dead for now
The House had voted 294-134 on July 17, 2025, but the Senate failed to pass it on September 15, 2026, with a 49-50 vote (60 votes were needed). As of November 3, 2026, it still isn't law. No more Q2 catalyst—we're in an agency-led regulatory phase with the SEC/CFTC.
1. Weekly technicals:
Price is below all the EMAs (EMA7 1.3095 / EMA25 1.3390 / EMA200 1.3698). That's why resistance around $1.34-1.40, with support at $1.25-1.30, remains important for a recovery. It needs to close above $1.34 to invalidate the bearish setup.
2. Regulatory - the CLARITY Act is dead for now
The House had voted 294-134 on July 17, 2025, but the Senate failed to pass it on September 15, 2026, with a 49-50 vote (60 votes were needed). As of November 3, 2026, it still isn't law. No more Q2 catalyst—we're in an agency-led regulatory phase with the SEC/CFTC.
GalaadCofee:
que suba porque elndpñar sube
1
1
247

·
--
$XRP is currently very bullish; the 1.29 level is a key point from which it could move even higher.
Entry : 1.295-1.290
TP1: 1.32
TP2:1.36
TP3:1.5.. running
SL: 1.28
Move stop loss to the entry point after hit 1st tp.
#XRPRealityCheck #XRPUSDT🚨 #TradingSignals #Binance
$XRP is currently very bullish; the 1.29 level is a key point from which it could move even higher.
Entry : 1.295-1.290
TP1: 1.32
TP2:1.36
TP3:1.5.. running
SL: 1.28
Move stop loss to the entry point after hit 1st tp.
#XRPRealityCheck #XRPUSDT🚨 #TradingSignals #Binance
Entry : 1.295-1.290
TP1: 1.32
TP2:1.36
TP3:1.5.. running
SL: 1.28
Move stop loss to the entry point after hit 1st tp.
#XRPRealityCheck #XRPUSDT🚨 #TradingSignals #Binance
189

$XRP 📊 XRP Latest Analysis – November 3, 2026
XRP is consolidating near $1.25 amid weak market sentiment. Technical indicators suggest bearish momentum, although increased wallet activity offers a positive long-term network signal.
Current price: Around $1.25
Support: $1.23 / $1.20
Resistance: $1.27 / $1.30
Bullish scenario: A confirmed breakout above $1.27 could open the way toward $1.30.
Bearish scenario: A breakdown below $1.23 could expose $1.20.
Market outlook: XRP needs stronger buying volume to confirm a recovery. Direction remains uncertain until a breakout.
Source:
Illustrative XRP market graphic — not a live trading chart.
Note: Prices and technical levels are approximate and can change quickly. This is market analysis, not financial advice.
#BinanceReopensWithdrawalsForMoreAssets #BinanceHourlyDepositsExceedWithdrawals #XRPRealityCheck #TODAYUPDATE #latestupdate
{future}(XRPUSDT)
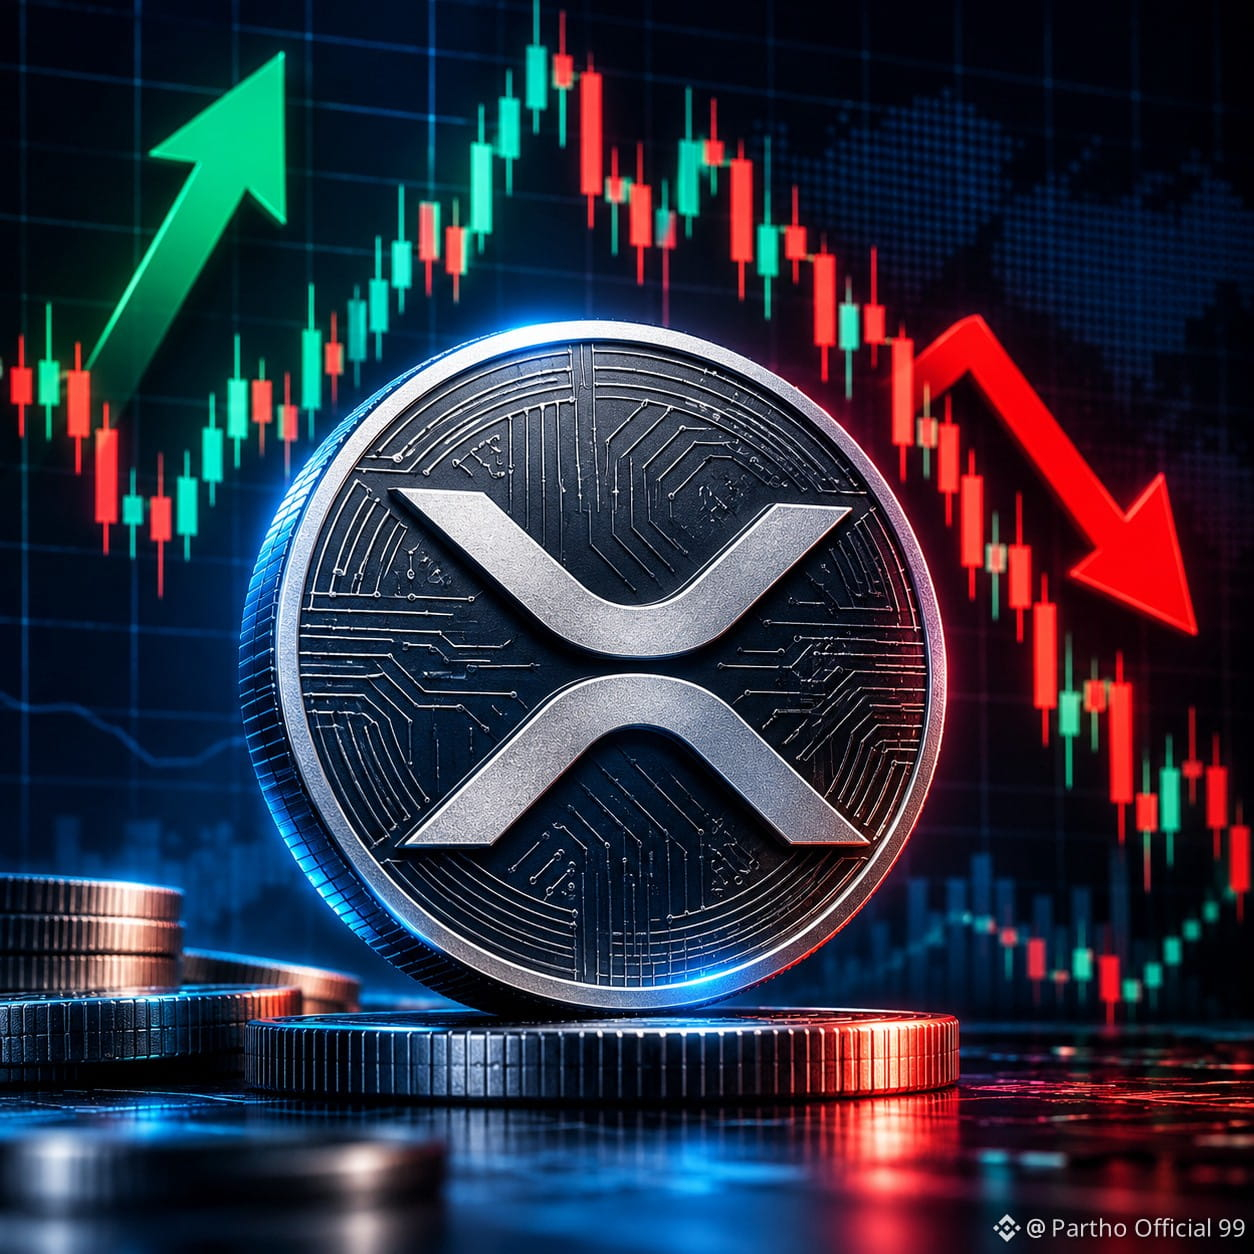
$XRP 📊 XRP Latest Analysis – November 3, 2026
XRP is consolidating near $1.25 amid weak market sentiment. Technical indicators suggest bearish momentum, although increased wallet activity offers a positive long-term network signal.
Current price: Around $1.25
Support: $1.23 / $1.20
Resistance: $1.27 / $1.30
Bullish scenario: A confirmed breakout above $1.27 could open the way toward $1.30.
Bearish scenario: A breakdown below $1.23 could expose $1.20.
Market outlook: XRP needs stronger buying volume to confirm a recovery. Direction remains uncertain until a breakout.
Source:
Illustrative XRP market graphic — not a live trading chart.
Note: Prices and technical levels are approximate and can change quickly. This is market analysis, not financial advice.
#BinanceReopensWithdrawalsForMoreAssets #BinanceHourlyDepositsExceedWithdrawals #XRPRealityCheck #TODAYUPDATE #latestupdate
XRP is consolidating near $1.25 amid weak market sentiment. Technical indicators suggest bearish momentum, although increased wallet activity offers a positive long-term network signal.
Current price: Around $1.25
Support: $1.23 / $1.20
Resistance: $1.27 / $1.30
Bullish scenario: A confirmed breakout above $1.27 could open the way toward $1.30.
Bearish scenario: A breakdown below $1.23 could expose $1.20.
Market outlook: XRP needs stronger buying volume to confirm a recovery. Direction remains uncertain until a breakout.
Source:
Illustrative XRP market graphic — not a live trading chart.
Note: Prices and technical levels are approximate and can change quickly. This is market analysis, not financial advice.
#BinanceReopensWithdrawalsForMoreAssets #BinanceHourlyDepositsExceedWithdrawals #XRPRealityCheck #TODAYUPDATE #latestupdate
207

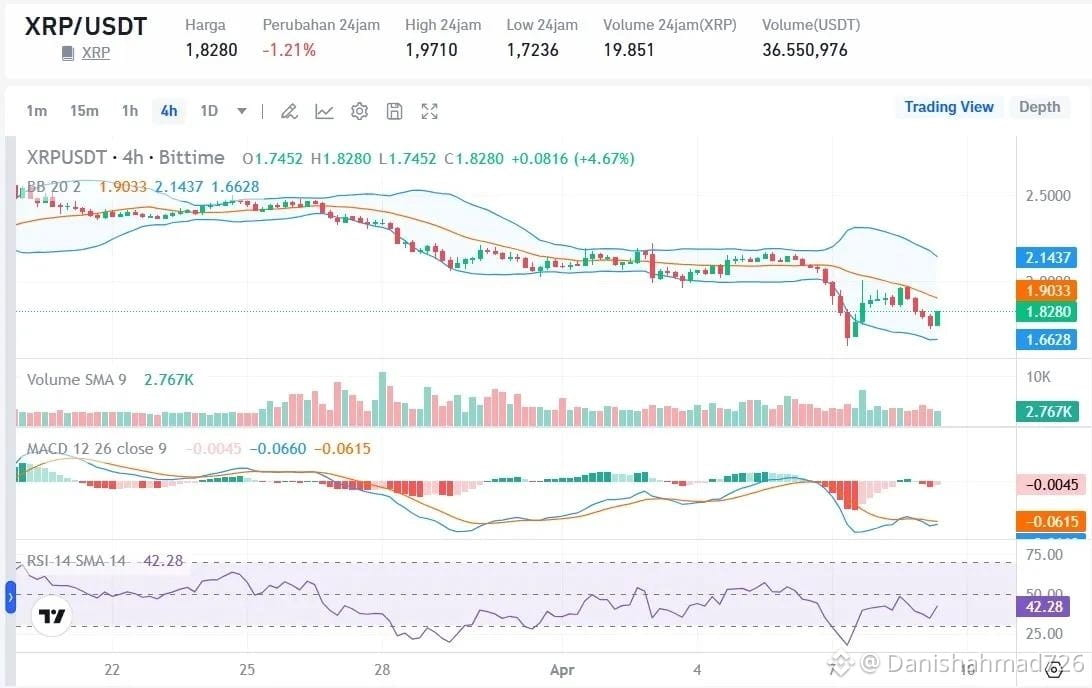
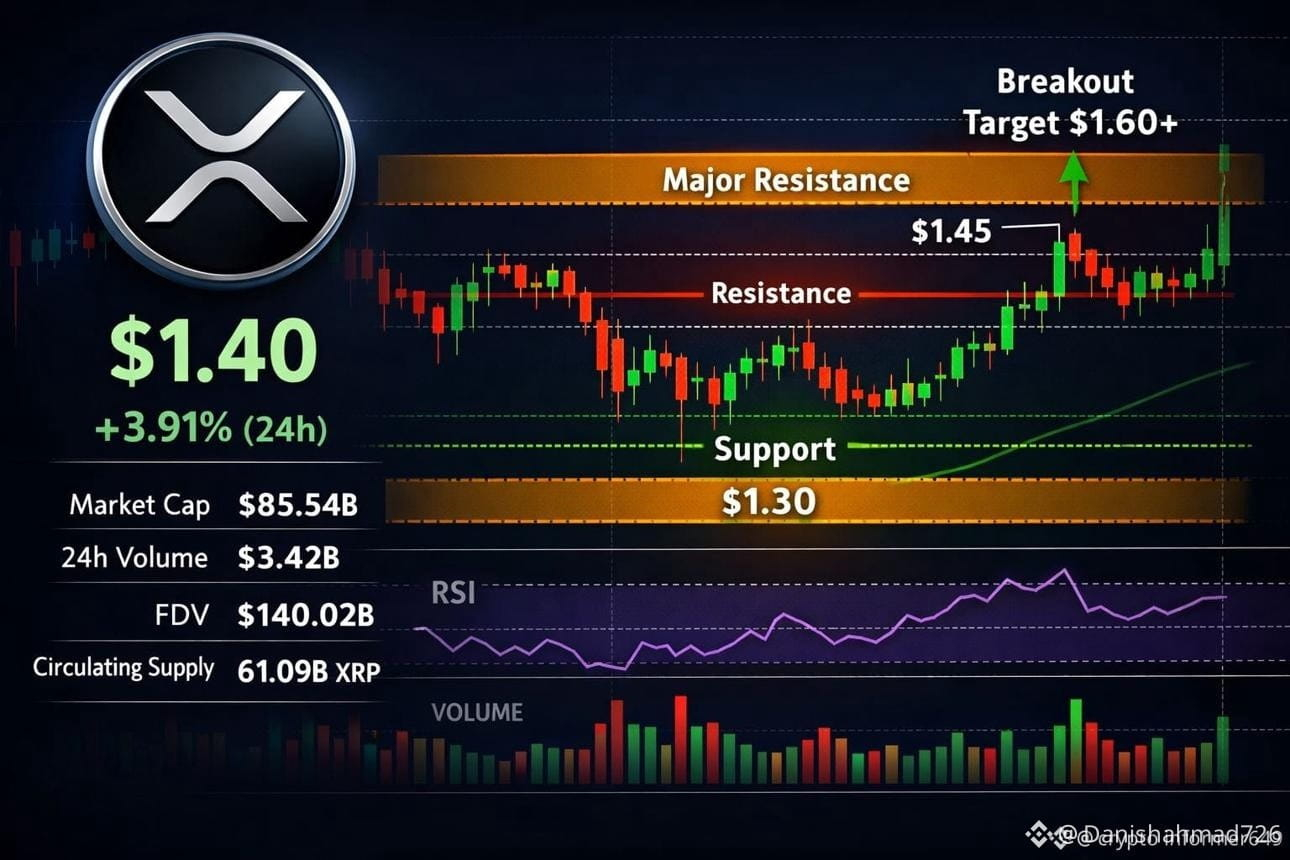
$XRP XRP has fallen approximately 0.56% over 24 hours.
The $1.20–$1.27 area is an important support zone.
RSI is around 33, indicating weak and nearly oversold momentum.
XRP is trading below several important moving averages.
October saw continued inflows into US spot XRP ETFs, but this has not yet translated into strong price recovery.
My interpretation: XRP is approaching oversold territory. A short-term bounce is possible, but the trend has not yet confirmed a reversal.
{future}(XRPUSDT)
#xrp #XRPGoal #Xrp🔥🔥 #XRPRealityCheck
$XRP XRP has fallen approximately 0.56% over 24 hours.
The $1.20–$1.27 area is an important support zone.
RSI is around 33, indicating weak and nearly oversold momentum.
XRP is trading below several important moving averages.
October saw continued inflows into US spot XRP ETFs, but this has not yet translated into strong price recovery.
My interpretation: XRP is approaching oversold territory. A short-term bounce is possible, but the trend has not yet confirmed a reversal.
#xrp #XRPGoal #Xrp🔥🔥 #XRPRealityCheck
The $1.20–$1.27 area is an important support zone.
RSI is around 33, indicating weak and nearly oversold momentum.
XRP is trading below several important moving averages.
October saw continued inflows into US spot XRP ETFs, but this has not yet translated into strong price recovery.
My interpretation: XRP is approaching oversold territory. A short-term bounce is possible, but the trend has not yet confirmed a reversal.
#xrp #XRPGoal #Xrp🔥🔥 #XRPRealityCheck
1
96
·
--
$XRP
{spot}(XRPUSDT)
#XRPRealityCheck #Xrp🔥🔥 #XRPRealityCheck #XRPGoal #XRPPredictions Latest - Oct 31, 2026
*Price:* ∼$1.24 - $1.25
- 24h Range: $1.20 - $1.27 low to high
- Down -3.5% in 24h, -5.8% in 7 days after the Binance hack selloff. eaf4
What happened:
XRP dumped to $1.20 overnight on Oct 29-30 after Binance reported a ∼$6.3B hack. Hacker still holds 233.46M XRP (∼$289M) in one wallet, untouched. Market fear is high (Fear & Greed 30). dbf9
Technical:
- Bearish short-term. Trading BELOW all major EMAs: 50-day ∼$1.35, 100-day ∼$1.33, 200-day ∼$1.37
- RSI ∼40-44, near oversold, weak trend
- Pivot: $1.26. Below it = bearish. 9011d45d
*Levels to watch:*
- *Support 1:* $1.20 (yesterday's low, must hold)
- *Support 2:* $1.14 - $1.08 if $1.20 breaks
- *Resistance 1:* $1.26 - $1.27 (broken support now resistance)
- *Resistance 2:* $1.33 - $1.37 (EMA cluster) - a close above this flips bullish to $1.50
*Short view:* Range-bound / corrective. Bulls defended $1.20, but upside is capped until $1.33 reclaimed. If $1.20 breaks, next risk $1.14
$XRP
#XRPRealityCheck #Xrp🔥🔥 #XRPRealityCheck #XRPGoal #XRPPredictions Latest - Oct 31, 2026
*Price:* ∼$1.24 - $1.25
- 24h Range: $1.20 - $1.27 low to high
- Down -3.5% in 24h, -5.8% in 7 days after the Binance hack selloff. eaf4
What happened:
XRP dumped to $1.20 overnight on Oct 29-30 after Binance reported a ∼$6.3B hack. Hacker still holds 233.46M XRP (∼$289M) in one wallet, untouched. Market fear is high (Fear & Greed 30). dbf9
Technical:
- Bearish short-term. Trading BELOW all major EMAs: 50-day ∼$1.35, 100-day ∼$1.33, 200-day ∼$1.37
- RSI ∼40-44, near oversold, weak trend
- Pivot: $1.26. Below it = bearish. 9011d45d
*Levels to watch:*
- *Support 1:* $1.20 (yesterday's low, must hold)
- *Support 2:* $1.14 - $1.08 if $1.20 breaks
- *Resistance 1:* $1.26 - $1.27 (broken support now resistance)
- *Resistance 2:* $1.33 - $1.37 (EMA cluster) - a close above this flips bullish to $1.50
*Short view:* Range-bound / corrective. Bulls defended $1.20, but upside is capped until $1.33 reclaimed. If $1.20 breaks, next risk $1.14
#XRPRealityCheck #Xrp🔥🔥 #XRPRealityCheck #XRPGoal #XRPPredictions Latest - Oct 31, 2026
*Price:* ∼$1.24 - $1.25
- 24h Range: $1.20 - $1.27 low to high
- Down -3.5% in 24h, -5.8% in 7 days after the Binance hack selloff. eaf4
What happened:
XRP dumped to $1.20 overnight on Oct 29-30 after Binance reported a ∼$6.3B hack. Hacker still holds 233.46M XRP (∼$289M) in one wallet, untouched. Market fear is high (Fear & Greed 30). dbf9
Technical:
- Bearish short-term. Trading BELOW all major EMAs: 50-day ∼$1.35, 100-day ∼$1.33, 200-day ∼$1.37
- RSI ∼40-44, near oversold, weak trend
- Pivot: $1.26. Below it = bearish. 9011d45d
*Levels to watch:*
- *Support 1:* $1.20 (yesterday's low, must hold)
- *Support 2:* $1.14 - $1.08 if $1.20 breaks
- *Resistance 1:* $1.26 - $1.27 (broken support now resistance)
- *Resistance 2:* $1.33 - $1.37 (EMA cluster) - a close above this flips bullish to $1.50
*Short view:* Range-bound / corrective. Bulls defended $1.20, but upside is capped until $1.33 reclaimed. If $1.20 breaks, next risk $1.14
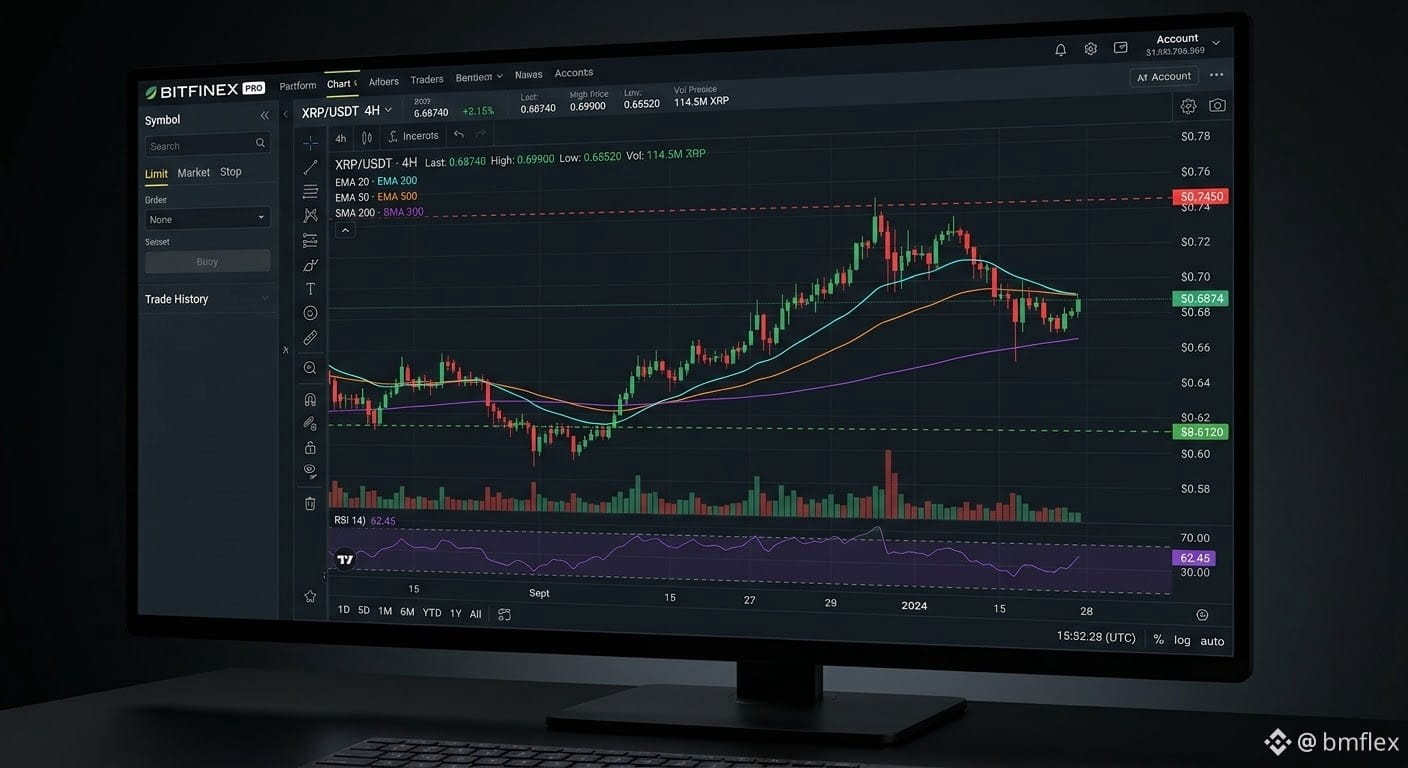
98

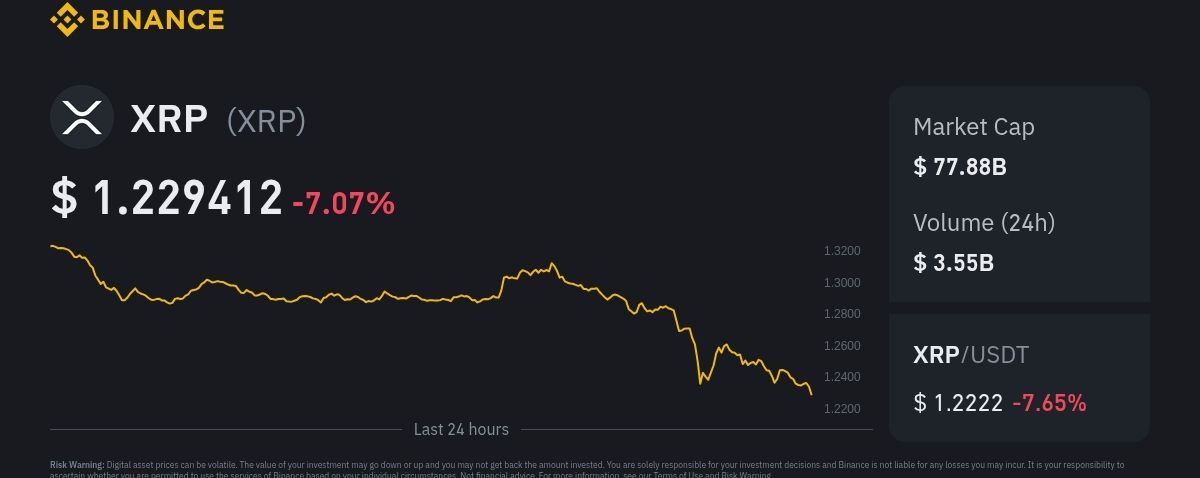
Article
XRP/USD Technical Analysis — October 30, 2026 $XRP /USD Technical Analysis — October 30, 2026
{spot}(XRPUSDT)
XRP is showing short-term bearish momentum, with price trading near the $1.25 support area. The key question is whether buyers can defend this zone or sellers push the price lower. Recent technical data also shows weak RSI and bearish MACD momentum. Borearis +1
### 1\. Key XRP/USD price levels

### XRP/USD
### $1.25–$1.26
Approximate reference price; verify live price on your exchange.
Bearish bias
| Level | Price (USD) | Significance |
| ------------ | ----------- | ---------------------------- |
| Resistance 3 | $1.3566 | Stronger intraday resistance |
| Resistance 2 | $1.3463 | Near-term resistance |
| Resistance 1 | $1.3290 | Key breakout level |
| Support 1 | $1.2546 | Immediate support zone |
| Support 2 | $1.2141 | Daily pivot area |
| Support 3 | $1.0612 | Lower downside reference |
These levels are based on the latest available technical analysis and may change as the market moves. Borearis
### 2\. Potential trading setups
### Scenario A: SELL / SHORT
* Watch for a confirmed breakdown below $1.25.
* Potential downside levels: $1.214, then lower if selling accelerates.
* Invalidation: price recovers above nearby resistance with strong buying volume.
### Scenario B: BUY / LONG
* Wait for price to reclaim $1.329 and hold above it.
* Potential upside levels: $1.346, then $1.357.
* A breakout that quickly reverses is a potential false signal.
### 3\. My trading view
Short-term trend
Bearish
Support near $1.25
Critical zone
Preferred strategy
Wait for confirmation
My view: I would avoid entering a trade blindly around $1.25. A confirmed breakdown may favor a short, while a recovery above $1.329 would improve the bullish case. Use a stop-loss and avoid excessive leverage.
This is a conditional technical outlook, not a guaranteed prediction or financial advice.
### 4\. Choose your trading timeframe
I can narrow this down to specific entry zones, stop-loss levels, and take-profit targets for your preferred chart.
Timeframe
5-minute scalping
15-minute trading
1-hour trading
4-hour swing trading
Daily trend
T
rade direction
BUY / LONG
SELL / SHORT
Both scenarios
Analyze XRP/USD Setup.
#EarningsSeason #Xrp🔥🔥 #XRPRealityCheck
XRP/USD Technical Analysis — October 30, 2026
$XRP /USD Technical Analysis — October 30, 2026
XRP is showing short-term bearish momentum, with price trading near the $1.25 support area. The key question is whether buyers can defend this zone or sellers push the price lower. Recent technical data also shows weak RSI and bearish MACD momentum. Borearis +1
### 1\. Key XRP/USD price levels

### XRP/USD
### $1.25–$1.26
Approximate reference price; verify live price on your exchange.
Bearish bias
| Level | Price (USD) | Significance |
| ------------ | ----------- | ---------------------------- |
| Resistance 3 | $1.3566 | Stronger intraday resistance |
| Resistance 2 | $1.3463 | Near-term resistance |
| Resistance 1 | $1.3290 | Key breakout level |
| Support 1 | $1.2546 | Immediate support zone |
| Support 2 | $1.2141 | Daily pivot area |
| Support 3 | $1.0612 | Lower downside reference |
These levels are based on the latest available technical analysis and may change as the market moves. Borearis
### 2\. Potential trading setups
### Scenario A: SELL / SHORT
* Watch for a confirmed breakdown below $1.25.
* Potential downside levels: $1.214, then lower if selling accelerates.
* Invalidation: price recovers above nearby resistance with strong buying volume.
### Scenario B: BUY / LONG
* Wait for price to reclaim $1.329 and hold above it.
* Potential upside levels: $1.346, then $1.357.
* A breakout that quickly reverses is a potential false signal.
### 3\. My trading view
Short-term trend
Bearish
Support near $1.25
Critical zone
Preferred strategy
Wait for confirmation
My view: I would avoid entering a trade blindly around $1.25. A confirmed breakdown may favor a short, while a recovery above $1.329 would improve the bullish case. Use a stop-loss and avoid excessive leverage.
This is a conditional technical outlook, not a guaranteed prediction or financial advice.
### 4\. Choose your trading timeframe
I can narrow this down to specific entry zones, stop-loss levels, and take-profit targets for your preferred chart.
Timeframe
5-minute scalping
15-minute trading
1-hour trading
4-hour swing trading
Daily trend
T
rade direction
BUY / LONG
SELL / SHORT
Both scenarios
Analyze XRP/USD Setup.
#EarningsSeason #Xrp🔥🔥 #XRPRealityCheck
XRP is showing short-term bearish momentum, with price trading near the $1.25 support area. The key question is whether buyers can defend this zone or sellers push the price lower. Recent technical data also shows weak RSI and bearish MACD momentum. Borearis +1
### 1\. Key XRP/USD price levels

### XRP/USD
### $1.25–$1.26
Approximate reference price; verify live price on your exchange.
Bearish bias
| Level | Price (USD) | Significance |
| ------------ | ----------- | ---------------------------- |
| Resistance 3 | $1.3566 | Stronger intraday resistance |
| Resistance 2 | $1.3463 | Near-term resistance |
| Resistance 1 | $1.3290 | Key breakout level |
| Support 1 | $1.2546 | Immediate support zone |
| Support 2 | $1.2141 | Daily pivot area |
| Support 3 | $1.0612 | Lower downside reference |
These levels are based on the latest available technical analysis and may change as the market moves. Borearis
### 2\. Potential trading setups
### Scenario A: SELL / SHORT
* Watch for a confirmed breakdown below $1.25.
* Potential downside levels: $1.214, then lower if selling accelerates.
* Invalidation: price recovers above nearby resistance with strong buying volume.
### Scenario B: BUY / LONG
* Wait for price to reclaim $1.329 and hold above it.
* Potential upside levels: $1.346, then $1.357.
* A breakout that quickly reverses is a potential false signal.
### 3\. My trading view
Short-term trend
Bearish
Support near $1.25
Critical zone
Preferred strategy
Wait for confirmation
My view: I would avoid entering a trade blindly around $1.25. A confirmed breakdown may favor a short, while a recovery above $1.329 would improve the bullish case. Use a stop-loss and avoid excessive leverage.
This is a conditional technical outlook, not a guaranteed prediction or financial advice.
### 4\. Choose your trading timeframe
I can narrow this down to specific entry zones, stop-loss levels, and take-profit targets for your preferred chart.
Timeframe
5-minute scalping
15-minute trading
1-hour trading
4-hour swing trading
Daily trend
T
rade direction
BUY / LONG
SELL / SHORT
Both scenarios
Analyze XRP/USD Setup.
#EarningsSeason #Xrp🔥🔥 #XRPRealityCheck
112
Log in to explore more content
Join global crypto users on Binance Square
⚡️ Get latest and useful information about crypto.
💬 Trusted by the world’s largest crypto exchange.
👍 Discover real insights from verified creators.
Email / Phone number
Trending Topics
1
#HotCPIDecemberHikePriced
65,211 views
867 Discussing
2
#AnthropicRejectsIPODelayValuationinQuestion
197,450 views
1,676 Discussing
3
#NvidiaInvestigatesAfterHuang’sAffairApology
479,607 views
3,114 Discussing
4
#CanNvidiaEarningsEaseMarketConcerns?
28,569 views
451 Discussing
5
#ADPWeeklyEstimateShowsUSPrivatePayrollsUp19750
12,294 views
234 Discussing
6
#US-IranTalksFuelStrongStockMarketRebound
125,923 views
584 Discussing
7
#BitcoinFiveWeeklyLosses
499,760 views
3,257 Discussing
8
#AIChipSlumpNasdaq
268,267 views
1,815 Discussing
9
#BitcoinSpotETFsPost$201MNetOutflowForThirdStraightDay
2,002 views
31 Discussing
10
#CryptoLiquidationsReach$1.16BIn24Hours
70,451 views
86 Discussing