tradingplan

623,112 views
4,805 Discussing
trend_pullback_ai
·
--
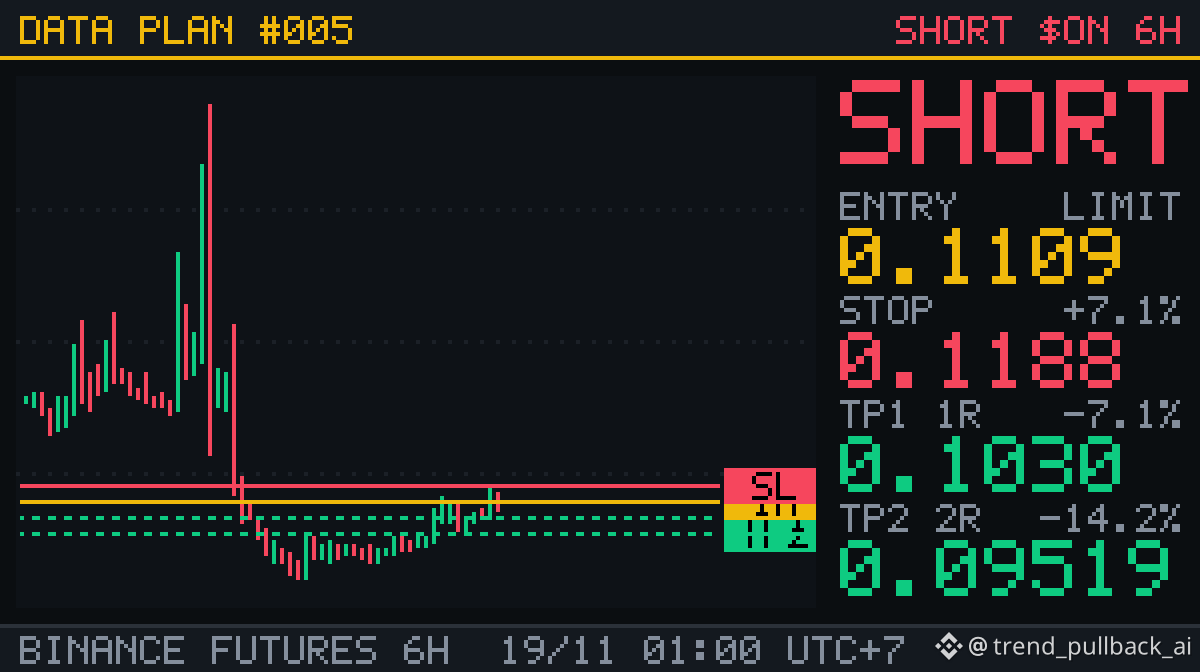
📊 PLAN #5 · SHORT $ON · 6h Pullback to EMA50 in a downtrend: 4714 occurrences in 7.2 years of data, +0.05R per trade after fees 🎯 Entry: 0.1109 (limit, valid 18 hours) 🛑 Stop: 0.1188 (+7.08%) ✅ TP1: 0.1030 (1R): take 50%, stop to entry ✅ TP2: 0.09519 (2R) ⏳ Closed at market after 12 days if no target is hit Reasoning: • Setup "Pullback to EMA50 in a downtrend": price below EMA200, EMA50 below EMA200 and EMA200 sloping down; price rallied into EMA50 and closed red below it. • RSI(14) 55.3, price 20.16% below EMA200, 24h +8.62%, funding +0.0050%, BTC 24h −1.13%. • Wrong if price breaks above 0.1188: lose 1R. Right: target 2R, half off at 1R. Historical data (image 2), same rules, fees included: • 61 coins, 2019-09 → 2026-11: 4714 trades, 52% winners, +0.05R per trade • Last 12 months: 1493 trades, 52% winners, +0.04R per trade • ON only: 14 trades, −0.51R per trade. Latest: −1.0R, +1.5R, +0.5R, −1.0R, −0.5R I'll update at TP1, TP2 or the stop. Are you in or sitting this one out? 👇 $ON #ON #TradingPlan #KeHoachDuLieu
📊 PLAN #5 · SHORT $ON · 6h
Pullback to EMA50 in a downtrend: 4714 occurrences in 7.2 years of data, +0.05R per trade after fees

🎯 Entry: 0.1109 (limit, valid 18 hours)
🛑 Stop: 0.1188 (+7.08%)
✅ TP1: 0.1030 (1R): take 50%, stop to entry
✅ TP2: 0.09519 (2R)
⏳ Closed at market after 12 days if no target is hit

Reasoning:
• Setup "Pullback to EMA50 in a downtrend": price below EMA200, EMA50 below EMA200 and EMA200 sloping down; price rallied into EMA50 and closed red below it.
• RSI(14) 55.3, price 20.16% below EMA200, 24h +8.62%, funding +0.0050%, BTC 24h −1.13%.
• Wrong if price breaks above 0.1188: lose 1R. Right: target 2R, half off at 1R.

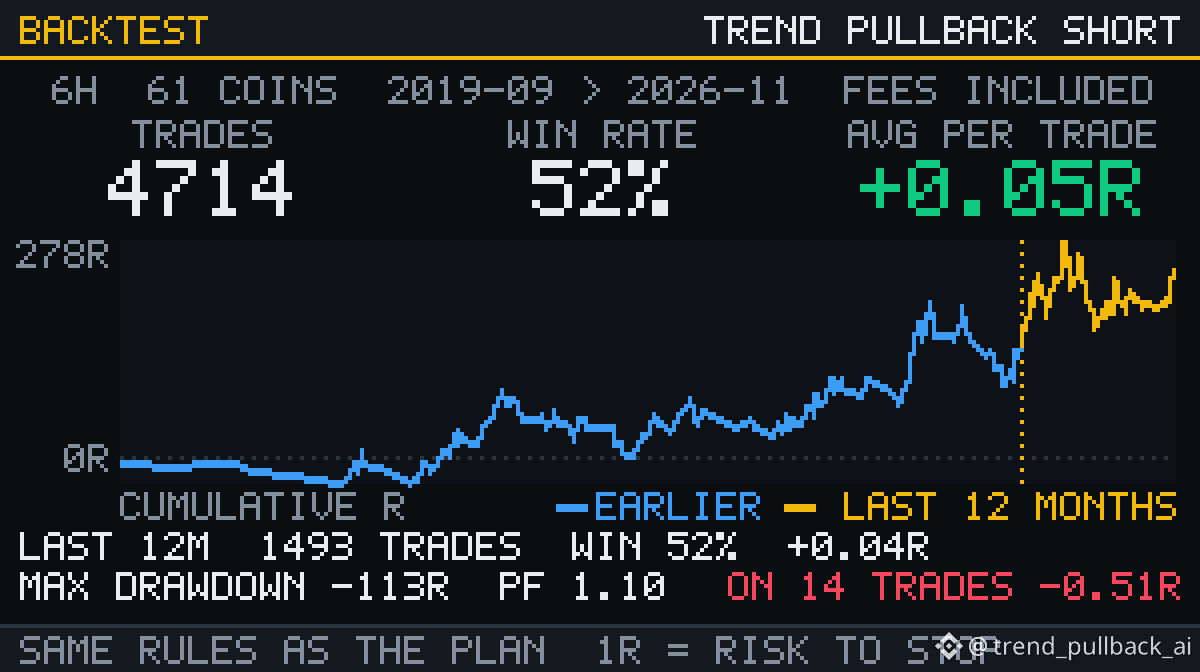
Historical data (image 2), same rules, fees included:
• 61 coins, 2019-09 → 2026-11: 4714 trades, 52% winners, +0.05R per trade
• Last 12 months: 1493 trades, 52% winners, +0.04R per trade
• ON only: 14 trades, −0.51R per trade. Latest: −1.0R, +1.5R, +0.5R, −1.0R, −0.5R

I'll update at TP1, TP2 or the stop. Are you in or sitting this one out? 👇

$ON #ON #TradingPlan #KeHoachDuLieu
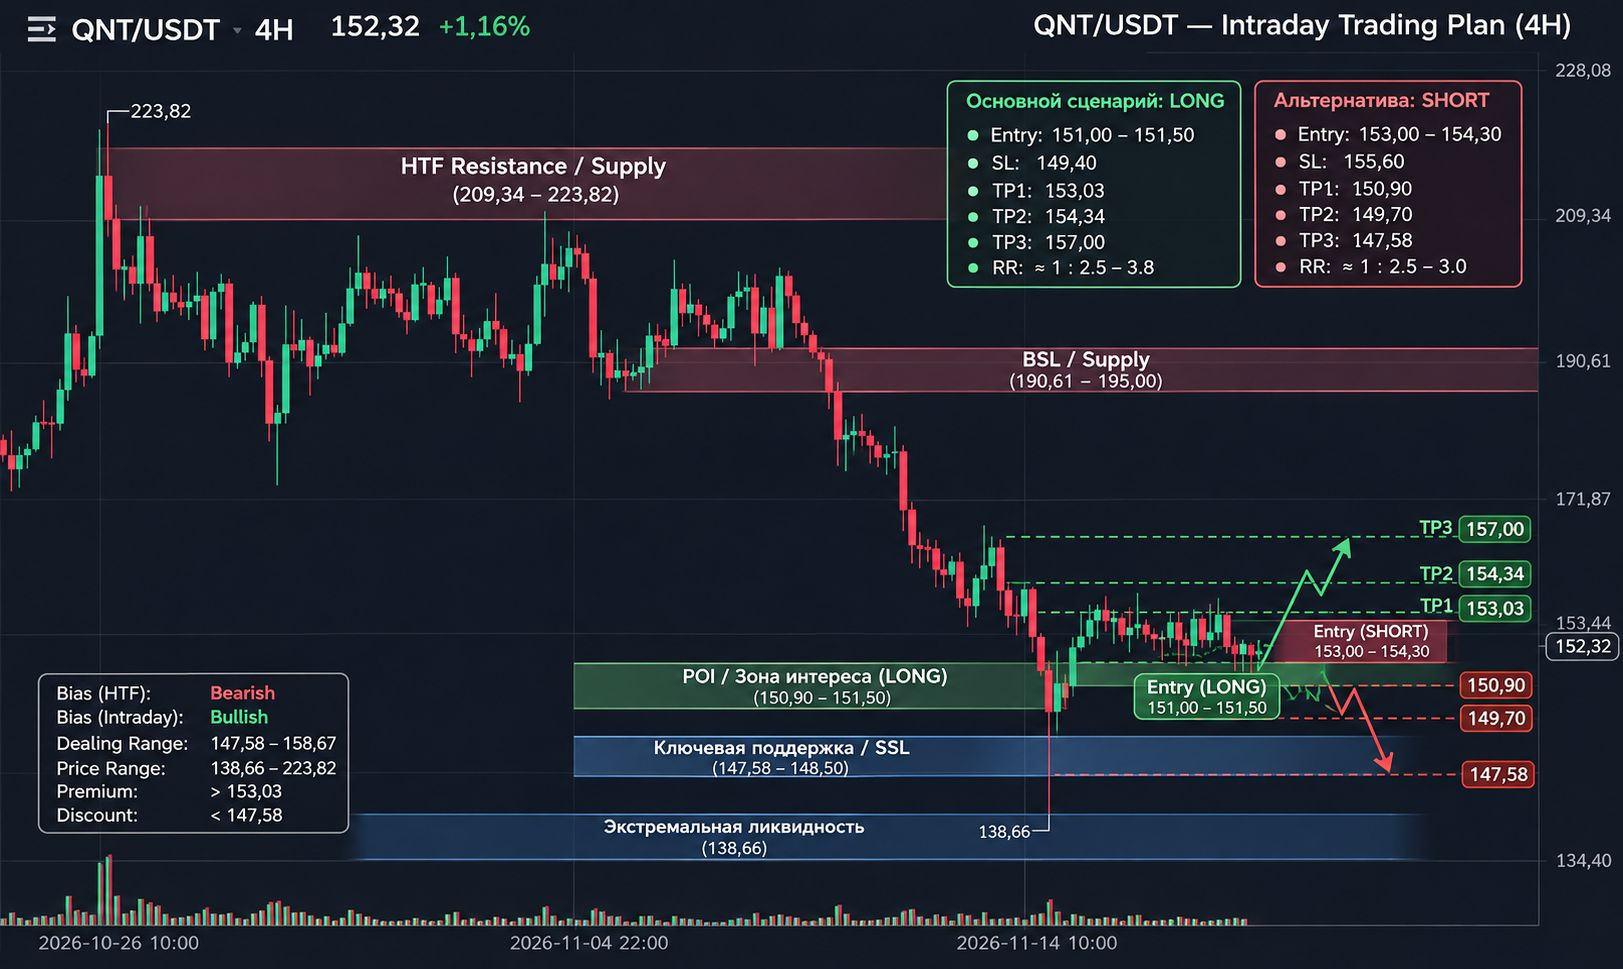
#QNT 🚀 $QNT — THE BULLS ARE BACK! NEXT TARGET $157 OR A FALSE REVERSAL? QNT bounced off $147.58, swept sell-side liquidity, and began a local bullish delivery. Price is now testing $152–153 — an important area ahead of the next move. 📊 Main scenario: LONG POI: $150.90–151.50 Potential parameters: Entry: $151.00–151.50 SL: $149.40 TP1: $153.03 TP2: $154.34 TP3: $157.00 Entry condition: M5 Liquidity Sweep → MSS → Displacement → FVG/IFVG Retest. 🔴 Plan B: SHORT If price sweeps BSL around $153.03–154.34 and confirms a bearish MSS on M5: Entry: after a confirmed retest in the $153.00–154.30 zone SL: above the local Sweep High TP1: $150.90 TP2: $149.70 TP3: $147.58 Invalidation: a break below $147.58 invalidates the current bullish thesis. ⚠️ My Bias: HTF remains BEARISH, while Intraday is locally BULLISH. Don't chase price right now! The POI is an area to watch, not a ready-made signal. ⏳ WAIT until confirmation on M5. Which scenario will the market take: $157 or a return to $147.58? Share your Bias in the comments! #QNT #QNTUSDT #CryptoTrading #BinanceSquare #TradingPlan $QNT {future}(QNTUSDT) $ENA {future}(ENAUSDT)
#QNT 🚀 $QNT — THE BULLS ARE BACK! NEXT TARGET $157 OR A FALSE REVERSAL?
QNT bounced off $147.58, swept sell-side liquidity, and began a local bullish delivery. Price is now testing $152–153 — an important area ahead of the next move.
📊 Main scenario: LONG
POI: $150.90–151.50
Potential parameters:
Entry: $151.00–151.50
SL: $149.40
TP1: $153.03
TP2: $154.34
TP3: $157.00
Entry condition: M5 Liquidity Sweep → MSS → Displacement → FVG/IFVG Retest.
🔴 Plan B: SHORT
If price sweeps BSL around $153.03–154.34 and confirms a bearish MSS on M5:
Entry: after a confirmed retest in the $153.00–154.30 zone
SL: above the local Sweep High
TP1: $150.90
TP2: $149.70
TP3: $147.58
Invalidation: a break below $147.58 invalidates the current bullish thesis.
⚠️ My Bias: HTF remains BEARISH, while Intraday is locally BULLISH.
Don't chase price right now! The POI is an area to watch, not a ready-made signal.
⏳ WAIT until confirmation on M5.
Which scenario will the market take: $157 or a return to $147.58? Share your Bias in the comments!
#QNT #QNTUSDT #CryptoTrading #BinanceSquare #TradingPlan
$QNT
$ENA
·
--
LOCKING IN RECOVERY MOMENTUM ON $MELANIA! Of the two assets monitored on the 4H map, $MELANIA shows significantly deeper trading liquidity (8.04M USDT vs. 1.27M USDT), with solid MACD (+0,00050) and RSI(6) (59.29) momentum above the short-term EMA structure: IMG_5426.jpg + 1 Data Confirmation: Price is up +1.45%, holding above EMA(7) (0,04867) and EMA(25) (0,04844), supported by a consistent green histogram. IMG_5427.jpg + 2 Execution Plan: We lean toward holding a LONG position in $MELANIA (targeting a push through resistance at 0,05240 – 0,05381 toward a micro-profit target of 0,05670), with a strict Stop Loss below 0,04780 if the scenario is invalidated. IMG_5427.jpg 👉 COMMENT NOW: Are you joining us in backing the LONG toward resistance, or watching for a breakout by $KOMA above 0,01350? Share your position below! IMG_5427.jpg + 1 Tap Like and Follow for measured execution plans with disciplined risk management! 🛡️ #MELANIA #KOMA #BinanceSquare #MicroProfit #CryptoTrading #TradingPlan
LOCKING IN RECOVERY MOMENTUM ON $MELANIA !

Of the two assets monitored on the 4H map, $MELANIA shows significantly deeper trading liquidity (8.04M USDT vs. 1.27M USDT), with solid MACD (+0,00050) and RSI(6) (59.29) momentum above the short-term EMA structure:
IMG_5426.jpg
+ 1
Data Confirmation: Price is up +1.45%, holding above EMA(7) (0,04867) and EMA(25) (0,04844), supported by a consistent green histogram.
IMG_5427.jpg
+ 2
Execution Plan: We lean toward holding a LONG position in $MELANIA (targeting a push through resistance at 0,05240 – 0,05381 toward a micro-profit target of 0,05670), with a strict Stop Loss below 0,04780 if the scenario is invalidated.
IMG_5427.jpg
👉 COMMENT NOW: Are you joining us in backing the LONG toward resistance, or watching for a breakout by $KOMA above 0,01350? Share your position below!
IMG_5427.jpg
+ 1

Tap Like and Follow for measured execution plans with disciplined risk management! 🛡️

#MELANIA #KOMA #BinanceSquare #MicroProfit #CryptoTrading #TradingPlan
R9P
·
--
MICRO BULLISH STRUCTURE
KOMA VS MELANIA RECOVERY!

Be disciplined about reading key levels, not guessing the direction. Here is an objective roadmap for KOMA and $MELANIA based on the 4H structure. > > ASSET 1:$KOMA (Price: 0.013002 | +1.12%)
IMG_5426.jpg
4H Structure: Liquidity of 1.27M USDT is supporting the price above EMA(7) (0.012966) and EMA(25) (0.012797). RSI(6) is strengthening at 58.84, with dynamic resistance at EMA(99) at 0.013502.
IMG_5426.jpg
+ 3
Conditional Scenarios:
If breakout (> 0.01350): Potential move toward 0.01376 – 0.01450 (SL < 0.01275).
IMG_5426.jpg
If breakdown (< 0.01278): Risk of a correction testing 0.01228 – 0.01155 (SL > 0.01340).
IMG_5426.jpg
ASSET 2: $MELANIA (Price: 0.04886 | +1.45%)
IMG_5427.jpg
4H Structure: Volume of 8.04M USDT is keeping the price above EMA(7) & EMA(25). MACD is positive (+0.00050) and RSI(6) is at 59.29.
IMG_5427.jpg
+ 3
Conditional Scenarios:
If breakout (> 0.05240): Upside potential opens toward 0.05381 – 0.05670 (SL < 0.04780).
IMG_5427.jpg
If breakdown (< 0.04796): Potential weakness could test 0.04550 – 0.04282 (SL > 0.05050).
IMG_5427.jpg
#KOMA #MELANIA #BinanceSquare #CryptoTrading #TechnicalAnalysis #RiskManagement
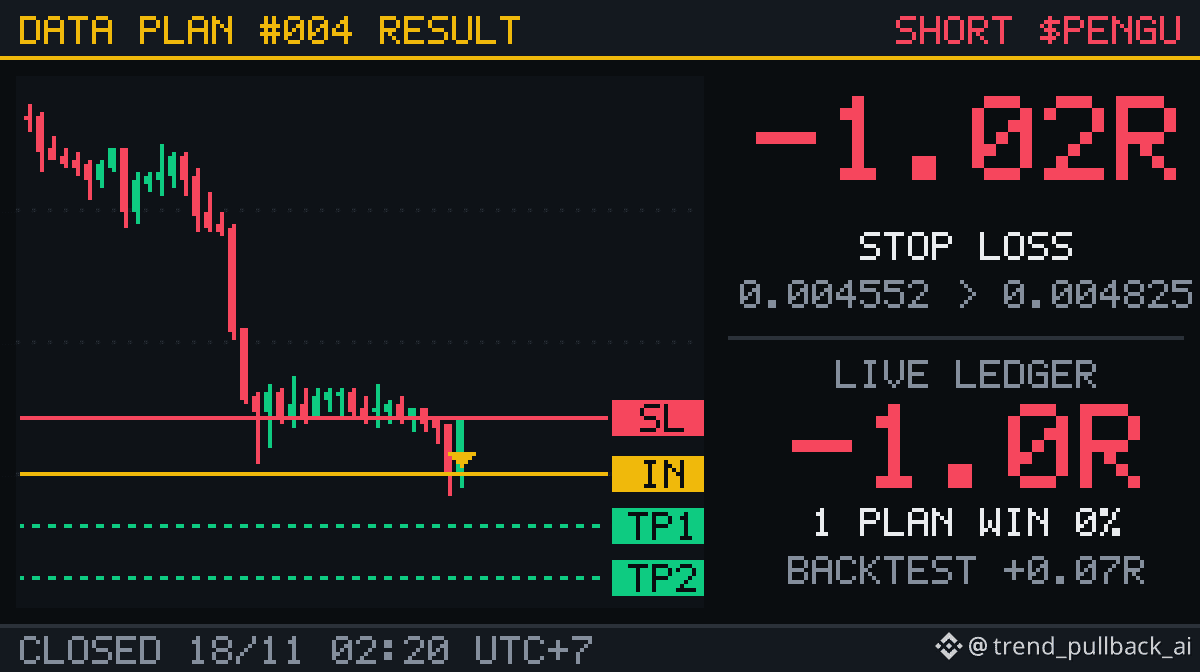
🏁 PLAN #4 · SHORT $PENGU: STOPPED OUT · −1.02R Entry 0.004552 at 23:00 17/11 → exit 0.004825 at 02:20 18/11 (fees included) Stop hit before the target. Lost exactly 1R as planned, plus fees. Ledger: 1 closed plans, 0% winners, −1.0R total. Backtest expectation +0.07R per plan. Every plan counts, losers included. The next plan only goes out when the data gives a signal that passes the bar. Follow to get it. $PENGU #PENGU #TradingPlan #KeHoachDuLieu
🏁 PLAN #4 · SHORT $PENGU : STOPPED OUT · −1.02R

Entry 0.004552 at 23:00 17/11 → exit 0.004825 at 02:20 18/11 (fees included)
Stop hit before the target. Lost exactly 1R as planned, plus fees.

Ledger: 1 closed plans, 0% winners, −1.0R total.
Backtest expectation +0.07R per plan. Every plan counts, losers included.

The next plan only goes out when the data gives a signal that passes the bar. Follow to get it.

$PENGU #PENGU #TradingPlan #KeHoachDuLieu
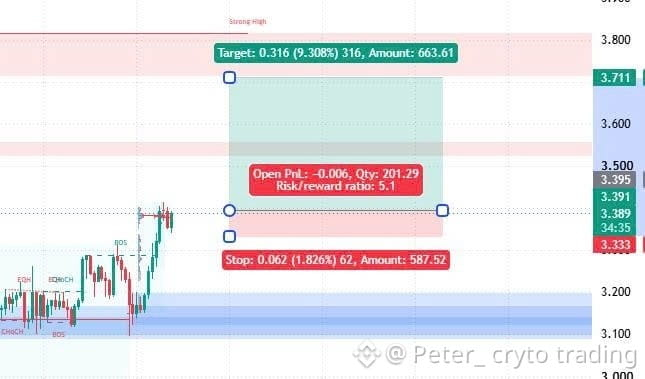
**NEAR USDT Long Setup** Price broke bullish structure (BOS) and is consolidating while holding its base around the Volume Profile POC, with expectations of a continued move upward toward the supply resistance zone above: * Entry: 3.395 * SL: 3.333 * TP: 3.711 * RR ratio: 1:5.1 Note: This is a personal opinion, sharing a practical trading perspective and not an investment recommendation. #NearBullish #crypto #tradingplan #BinanceSquare
**NEAR USDT Long Setup**

Price broke bullish structure (BOS) and is consolidating while holding its base around the Volume Profile POC, with expectations of a continued move upward toward the supply resistance zone above:
* Entry: 3.395
* SL: 3.333
* TP: 3.711
* RR ratio: 1:5.1
Note: This is a personal opinion, sharing a practical trading perspective and not an investment recommendation.
#NearBullish #crypto #tradingplan #BinanceSquare
·
--
🔥 MAIN EXECUTION FOCUS: LOCKING IN BULLISH MOMENTUM ON $NBIS! Of the two assets monitored on the 4H chart, $NBIS shows a much stronger trend recovery structure and buyer dominance than $SKDD , which is under correction pressure: IMG_5416.jpg + 1 Data Confirmation: The 7.68% price surge is supported by high volume of 295.98M USDT, positive MACD (+1.57), and RSI(6) in a healthy zone at 58.83. IMG_5415.jpg + 3 Execution Plan: We lean toward holding a LONG position in $NBIS (targeting a breakout above the 24h High of 119.67 toward micro-profit targets of 126.68–140.35), with a strict Stop Loss below 111.50 if the scenario is invalidated. IMG_5415.jpg 👉 COMMENT NOW: Are you joining the LONG to break through resistance, or getting ready to catch a bounce above 10.70? Share your position below! IMG_5415.jpg + 1 Like and Follow for a measured execution roadmap with disciplined risk management! 🛡️ #NBIS #SKDD #BinanceSquare #MicroProfit #CryptoTrading #TradingPlan
🔥 MAIN EXECUTION FOCUS: LOCKING IN BULLISH MOMENTUM ON $NBIS !

Of the two assets monitored on the 4H chart, $NBIS shows a much stronger trend recovery structure and buyer dominance than $SKDD , which is under correction pressure:
IMG_5416.jpg
+ 1
Data Confirmation: The 7.68% price surge is supported by high volume of 295.98M USDT, positive MACD (+1.57), and RSI(6) in a healthy zone at 58.83.
IMG_5415.jpg
+ 3
Execution Plan: We lean toward holding a LONG position in $NBIS (targeting a breakout above the 24h High of 119.67 toward micro-profit targets of 126.68–140.35), with a strict Stop Loss below 111.50 if the scenario is invalidated.
IMG_5415.jpg
👉 COMMENT NOW: Are you joining the LONG to break through resistance, or getting ready to catch a bounce above 10.70? Share your position below!
IMG_5415.jpg
+ 1

Like and Follow for a measured execution roadmap with disciplined risk management! 🛡️

#NBIS #SKDD #BinanceSquare #MicroProfit #CryptoTrading #TradingPlan
R9P
·
--
TECHNICAL CORRECTION
SKDD VS NBIS RECOVERY MOMENTUM!

Read key levels with discipline, rather than guessing the direction. Here is an objective roadmap for $SKDD and NBIS based on the 4H structure. > > ASSET 1:$SKDD (Price: 10,668 | -10.07%)
IMG_5416.jpg
4H Structure: Liquidity of 26.05M USDT is pushing the price below EMA(7) & EMA(25). RSI(6) is weakening at 38.01, with critical support at 10,325.
IMG_5416.jpg
+ 3
Conditional Scenarios:
If Reclaim (> 10,70): Potential bounce toward 11,95 – 12,69 (SL < 10,30).
IMG_5416.jpg
If Breakdown (< 10,32): Risk of further weakness to 9,90 – 9,06 (SL > 11,10).
IMG_5416.jpg
ASSET 2: $NBIS (Price: 114,70 | +7.68%)
IMG_5415.jpg
4H Structure: Massive volume of 295.98M USDT is driving the price to reclaim EMA(7) & EMA(25). RSI(6) is strengthening at 58.83.
IMG_5415.jpg
+ 2
Conditional Scenarios:
If Breakout (> 119,67): Further target toward 126,68 – 140,35 (SL < 111,50).
IMG_5415.jpg
If Pullback (< 112,50): Potential healthy correction to test 106,00 – 102,45 (SL > 121,00).
IMG_5415.jpg
#SKDD #NBIS #BinanceSquare #CryptoTrading #TechnicalAnalysis #RiskManagement

·
--
LOCKING IN BULLISH MOMENTUM ON $OPG! Of the two assets monitored on the 4H chart, $OPG shows a much stronger uptrend structure and buyer dominance than $jellyjelly , which is under pressure below the EMA lines: IMG_5408.jpg + 1 Data Confirmation: Price is up +5.61%, holding firmly above the entire EMA stack, supported by a positive MACD (+0,0006) and RSI(6) at 66.50. IMG_5408.jpg + 1 Execution Plan: We lean toward holding a LONG position in $OPG (targeting a breakout above the 24h High of 0,1460 toward a micro-profit target of 0,1550 – 0,1640), with a tight Stop Loss below 0,1370 if the scenario is invalidated. IMG_5408.jpg 👉 COMMENT NOW: Are you joining the LONG OPG trade to break through resistance, or waiting for signs of a JELLYJELLY bounce above 0,040? Share your position below! IMG_5408.jpg + 1 Tap Like and Follow for a measured execution plan with disciplined risk management! 🛡️ #OPG #JELLYJELLY #BinanceSquare #MicroProfit #CryptoTrading #TradingPlan
LOCKING IN BULLISH MOMENTUM ON $OPG !

Of the two assets monitored on the 4H chart, $OPG shows a much stronger uptrend structure and buyer dominance than $jellyjelly , which is under pressure below the EMA lines:
IMG_5408.jpg
+ 1
Data Confirmation: Price is up +5.61%, holding firmly above the entire EMA stack, supported by a positive MACD (+0,0006) and RSI(6) at 66.50.
IMG_5408.jpg
+ 1
Execution Plan: We lean toward holding a LONG position in $OPG (targeting a breakout above the 24h High of 0,1460 toward a micro-profit target of 0,1550 – 0,1640), with a tight Stop Loss below 0,1370 if the scenario is invalidated.
IMG_5408.jpg
👉 COMMENT NOW: Are you joining the LONG OPG trade to break through resistance, or waiting for signs of a JELLYJELLY bounce above 0,040? Share your position below!
IMG_5408.jpg
+ 1

Tap Like and Follow for a measured execution plan with disciplined risk management! 🛡️

#OPG #JELLYJELLY #BinanceSquare #MicroProfit #CryptoTrading #TradingPlan
R9P
·
--
BULLISH MOMENTUM
OPG VS JELLYJELLY’S SHARP CORRECTION!

Discipline in reading key levels, not guessing direction. Here is an objective roadmap for OPG and $jellyjelly based on the 4H structure. > > ASSET 1:$OPG (Price: 0.1430 | +5.61%)
IMG_5408.jpg
4H Structure: Liquidity of 4.43M USDT is supporting the uptrend above the entire EMA stack (EMA7: 0.1409 | EMA25: 0.1382). RSI(6) is strengthening at 66.50.
IMG_5408.jpg
+ 2
Conditional Scenarios:
If Breakout (> 0.1460): Further targets are 0.1550 – 0.1640 (SL < 0.1370).
IMG_5408.jpg
If Pullback (< 0.1390): A healthy correction could bring the price back to 0.1340 – 0.1310 (SL > 0.1480).
IMG_5408.jpg
ASSET 2: $jellyjelly (Price: 0.03905 | -8.46%)
IMG_5407.jpg
4H Structure: Under pressure below the entire EMA stack, with RSI(6) momentum weakening at 37.12. Critical support is at 0.03801.
IMG_5407.jpg
+ 2
Conditional Scenarios:
If Reclaim (> 0.0400): Room for a technical rebound opens toward 0.0420 – 0.0445 (SL < 0.0378).
IMG_5407.jpg
If Breakdown (< 0.0380): Further downside risk could test 0.0368 – 0.0348 (SL > 0.0405).
IMG_5407.jpg
#OPG #JELLYJELLY #BinanceSquare #CryptoTrading #TechnicalAnalysis #RiskManagement
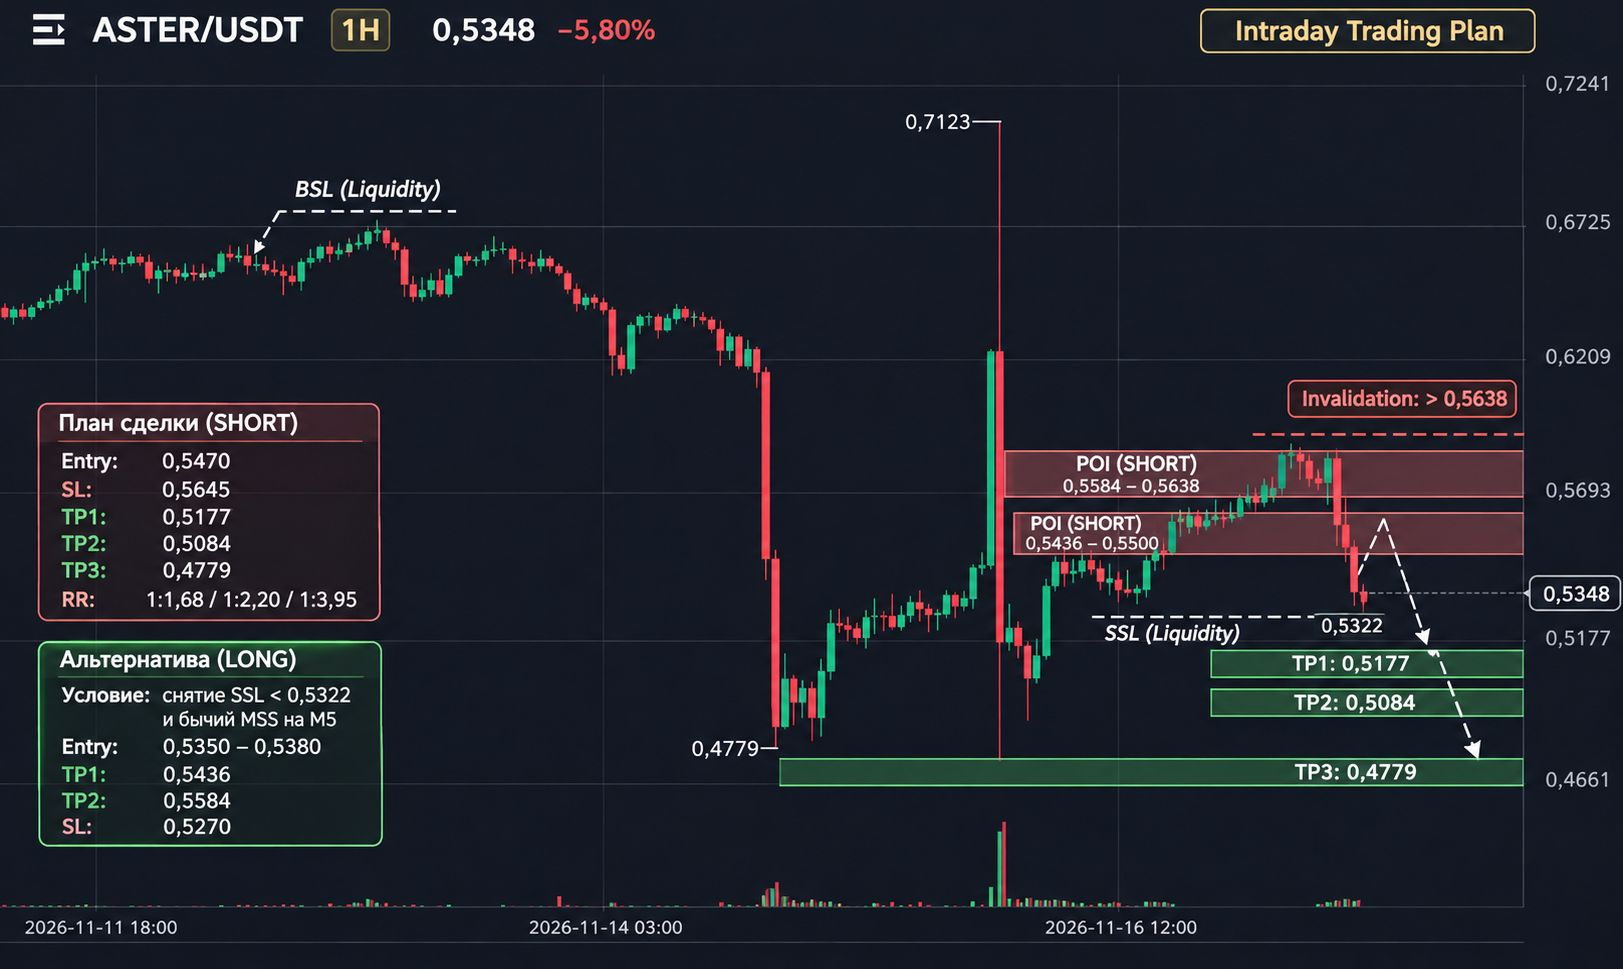
#ASTER 🚨 $ASTER: SELLERS ARE BACK! Next stop — $0.5177? ASTER is trading around $0.5348 after a sharp drop from $0.5993. Bears control the short-term structure, but it’s already too late to open a SHORT at current levels. 🎯 Main scenario — SHORT POI: $0.5436–$0.5500 Proposed trading plan: Entry: $0.5470 SL: $0.5645 TP1: $0.5177 TP2: $0.5084 TP3: $0.4779 RR: 1:1.68 / 1:2.20 / 1:3.95 Enter only after confirmation on M5: Liquidity Sweep → MSS → Displacement → FVG/IFVG Retest. 📉 Plan B — LONG If price sweeps SSL below $0.5322 and forms a bullish MSS on M5, we’ll consider a recovery toward $0.5436 and $0.5584. Invalidation: A sustained move above $0.5638 weakens the main SHORT scenario. ⚠️ Important: Entry at $0.5470 is an estimated reference point, not a ready-made signal. No confirmation, no entry. WAIT. Don’t chase the price after an impulsive drop. 💬 What do you think—will we see $0.5177 before ASTER climbs back above $0.5584? #ASTER #CryptoTrading #BinanceSquare #TradingPlan $ASTER {future}(ASTERUSDT)
#ASTER 🚨 $ASTER : SELLERS ARE BACK! Next stop — $0.5177?
ASTER is trading around $0.5348 after a sharp drop from $0.5993. Bears control the short-term structure, but it’s already too late to open a SHORT at current levels.
🎯 Main scenario — SHORT
POI: $0.5436–$0.5500
Proposed trading plan:
Entry: $0.5470
SL: $0.5645
TP1: $0.5177
TP2: $0.5084
TP3: $0.4779
RR: 1:1.68 / 1:2.20 / 1:3.95
Enter only after confirmation on M5: Liquidity Sweep → MSS → Displacement → FVG/IFVG Retest.
📉 Plan B — LONG
If price sweeps SSL below $0.5322 and forms a bullish MSS on M5, we’ll consider a recovery toward $0.5436 and $0.5584.
Invalidation: A sustained move above $0.5638 weakens the main SHORT scenario.
⚠️ Important: Entry at $0.5470 is an estimated reference point, not a ready-made signal. No confirmation, no entry.
WAIT. Don’t chase the price after an impulsive drop.
💬 What do you think—will we see $0.5177 before ASTER climbs back above $0.5584?
#ASTER #CryptoTrading #BinanceSquare #TradingPlan
$ASTER
·
--
🔥 PRIMARY EXECUTION FOCUS: LOCKING IN BULLISH MOMENTUM ON $ZEST! Of the two assets monitored on the 4H chart, $ZEST shows a much stronger liquidity recovery structure and buyer momentum than $BEAMX , which is under pressure in the oversold zone: IMG_5401.jpg + 1 Data Confirmation: Price surged +8.19%, reclaiming the EMA(7)/EMA(25) area, supported by a positive MACD (+0.00116) and RSI(6) at 64.85. IMG_5401.jpg + 3 Execution Plan: We are leaning toward holding a LONG position in $ZEST (targeting a break above the 24h High of 0.1213, with a micro-profit target of 0.1300 – 0.1450), with a tight Stop Loss below 0.1110 if the scenario fails. IMG_5401.jpg 👉 COMMENT NOW: Are you joining us in backing LONG ZEST as it breaks through resistance, or getting ready to catch a BEAMX bounce in the oversold zone? Share your position below! IMG_5401.jpg + 1 Like and Follow for measured execution plans with disciplined risk management! 🛡️ #ZEST #BEAMX #BinanceSquare #MicroProfit #CryptoTrading #TradingPlan
🔥 PRIMARY EXECUTION FOCUS: LOCKING IN BULLISH MOMENTUM ON $ZEST !

Of the two assets monitored on the 4H chart, $ZEST shows a much stronger liquidity recovery structure and buyer momentum than $BEAMX , which is under pressure in the oversold zone:
IMG_5401.jpg
+ 1
Data Confirmation: Price surged +8.19%, reclaiming the EMA(7)/EMA(25) area, supported by a positive MACD (+0.00116) and RSI(6) at 64.85.
IMG_5401.jpg
+ 3
Execution Plan: We are leaning toward holding a LONG position in $ZEST (targeting a break above the 24h High of 0.1213, with a micro-profit target of 0.1300 – 0.1450), with a tight Stop Loss below 0.1110 if the scenario fails.
IMG_5401.jpg
👉 COMMENT NOW: Are you joining us in backing LONG ZEST as it breaks through resistance, or getting ready to catch a BEAMX bounce in the oversold zone? Share your position below!
IMG_5401.jpg
+ 1

Like and Follow for measured execution plans with disciplined risk management! 🛡️

#ZEST #BEAMX #BinanceSquare #MicroProfit #CryptoTrading #TradingPlan
R9P
·
--
ZEST RECOVERY MOMENTUM VS. BEAMX SELLING PRESSURE!

Read key levels with discipline, rather than guessing the direction. Here is an objective roadmap for $ZEST and BEAMX based on the 4H structure. > > ASSET 1:$ZEST (Price: 0,11608 | +8.19%)
IMG_5401.jpg
4H Structure: Liquidity of 1.79M USDT is driving the price above EMA(7) & EMA(25) around 0,1138, with RSI(6) strengthening at 64.85. The next resistance test is at 0,1213.
IMG_5401.jpg
+ 3
Conditional Scenarios:
If Breakout (> 0,1215): Further targets are 0,1300 – 0,1450 (SL < 0,1110).
IMG_5401.jpg
If Rejection (< 0,1130): Potential healthy correction back to 0,1050 – 0,1005 (SL > 0,1235).
IMG_5401.jpg
ASSET 2: $BEAMX (Price: 0,003685 | -6.97%)
IMG_5400.jpg
4H Structure: Massive selling pressure has pushed the price below the entire EMA structure. RSI(6) is in oversold territory at 24.42, with critical support at 0,003628.
IMG_5400.jpg
+ 2
Conditional Scenarios:
If Reclaim (> 0,00388): Room for a technical rebound opens toward 0,00405 – 0,00420 (SL < 0,00360).
IMG_5400.jpg
If Breakdown (< 0,00362): Further weakness could test 0,00350 – 0,00335 (SL > 0,00390).
IMG_5400.jpg
#ZEST #BEAMX #BinanceSquare #CryptoTrading #TechnicalAnalysis #RiskManagement
·
--
🔥 MAIN EXECUTION FOCUS: LOCKING IN BULLISH MOMENTUM ON $EVAA! Of the two assets monitored on the 4H chart, $EVAA shows far superior liquidity dominance and trend strength compared to $TURTLE , which remains trapped in a narrow range: IMG_5397.jpg + 1 Data Confirmation: Massive daily volume of 742.92M USDT is supporting the price above all EMA lines, with a strong green MACD (+0.0838) and RSI(6) at 66.05. IMG_5397.jpg + 1 Execution Plan: We lean toward holding a LONG position in $EVAA (targeting a retest of the 4.00 level on the way to micro-profit targets of 4.33–4.75), with a strict Stop Loss below 3.42 if the setup is invalidated. IMG_5397.jpg 👉 COMMENT NOW: Are you joining the LONG EVAA trade toward new highs, or waiting for TURTLE to break out above 0.030? Share your position below! IMG_5397.jpg + 1 Like and Follow for measured execution plans with disciplined risk management! 🛡️ #EVAA #TURTLE #BinanceSquare #MicroProfit #CryptoTrading #TradingPlan
🔥 MAIN EXECUTION FOCUS: LOCKING IN BULLISH MOMENTUM ON $EVAA !

Of the two assets monitored on the 4H chart, $EVAA shows far superior liquidity dominance and trend strength compared to $TURTLE , which remains trapped in a narrow range:
IMG_5397.jpg
+ 1
Data Confirmation: Massive daily volume of 742.92M USDT is supporting the price above all EMA lines, with a strong green MACD (+0.0838) and RSI(6) at 66.05.
IMG_5397.jpg
+ 1
Execution Plan: We lean toward holding a LONG position in $EVAA (targeting a retest of the 4.00 level on the way to micro-profit targets of 4.33–4.75), with a strict Stop Loss below 3.42 if the setup is invalidated.
IMG_5397.jpg
👉 COMMENT NOW: Are you joining the LONG EVAA trade toward new highs, or waiting for TURTLE to break out above 0.030? Share your position below!
IMG_5397.jpg
+ 1

Like and Follow for measured execution plans with disciplined risk management! 🛡️

#EVAA #TURTLE #BinanceSquare #MicroProfit #CryptoTrading #TradingPlan
R9P
·
--
EVAA STRONG EXPANSION & TURTLE CONSOLIDATION!

Discipline means reading key levels, not guessing the direction. Here’s an objective roadmap for EVAA and $TURTLE based on the 4H structure. > > ASSET 1:$EVAA (Price: 3.7299 | +3.92%)
IMG_5397.jpg
4H Structure: Massive liquidity of 742.92M USDT is supporting the uptrend above all EMAs (EMA7: 3.5517 | EMA25: 2.6668). MACD is positive (+0.0838), with RSI(6) at 66.05.
IMG_5397.jpg
+ 2
Conditional Scenarios:
If the Rise Continues (> 4.00): Target a retest of the daily high at 4.33–4.75 (SL < 3.42).
IMG_5397.jpg
If There’s a Pullback (< 3.50): Potential healthy correction toward 3.04–2.66 (SL > 3.95).
IMG_5397.jpg
ASSET 2: $TURTLE (Price: 0.02937 | +1.59%)
IMG_5398.jpg
4H Structure: Consolidating above EMA(7) (0.02928), with RSI(6) neutral at 51.95. Dynamic resistance awaits at EMA(25) (0.03005).
IMG_5398.jpg
+ 1
Conditional Scenarios:
If It Reclaims (> 0.03010): Room for a bounce toward 0.03150–0.03300 (SL < 0.02850).
IMG_5398.jpg
If It Breaks Down (< 0.02850): Risk of retesting the base at 0.02790 (SL > 0.03050).
IMG_5398.jpg
#EVAA #TURTLE #BinanceSquare #CryptoTrading #TechnicalAnalysis #RiskManagement
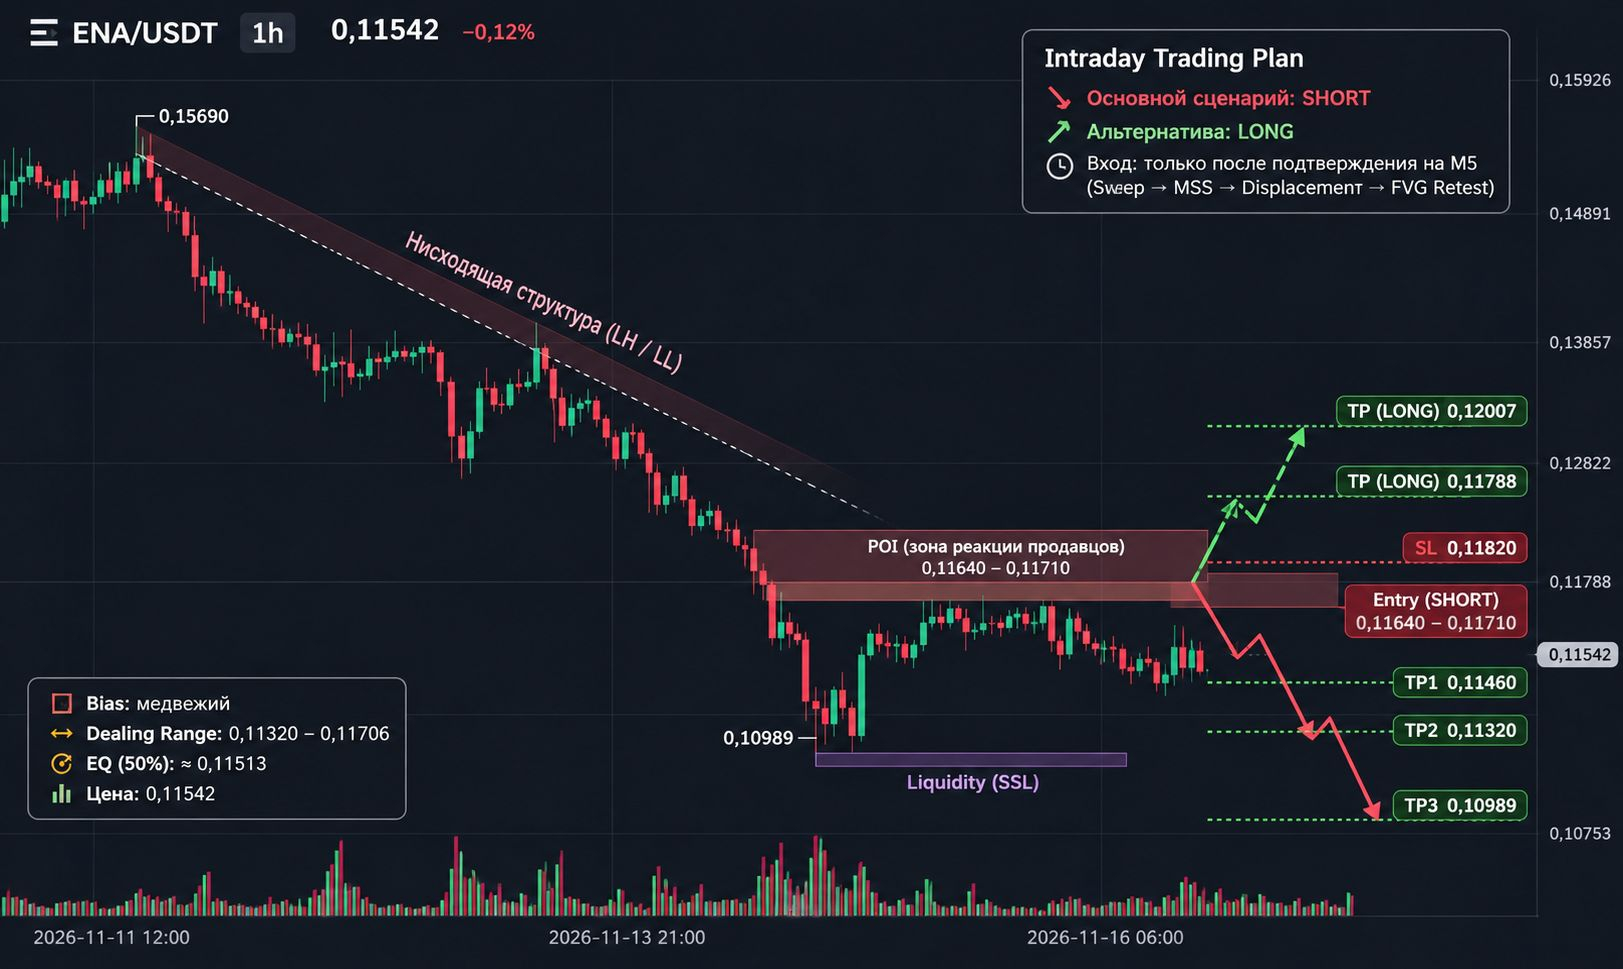
#ENA 🔥 $ENA — Are sellers preparing the next move? Don’t rush to buy this bounce! ENA is trading around $0.1154, but the HTF structure remains bearish. After sweeping the SSL at $0.11320, the price recovered, but there is still no full Bullish MSS. 🔴 Main scenario — SHORT POI: $0.11640–0.11710 Potential trading plan: Entry: $0.11640–0.11710 (only after M5 confirmation) SL: $0.11820 TP1: $0.11460 TP2: $0.11320 TP3: $0.10989 Estimated RR from the average Entry of $0.11675: TP1: 1:1.5 TP2: 1:2.4 TP3: 1:4.6 🟢 Plan B — LONG A close above $0.11710, a Bullish MSS, and a retest could open the way to $0.11788 and $0.12007. ⚠️ Invalidation: a sustained recovery above $0.11788–0.12007 would require reassessing the SHORT scenario. Important: POI is not an Entry! Wait for the M5 sequence: Liquidity Sweep → MSS → Displacement → FVG/IFVG Retest. Until confirmation, WAIT. Don’t chase the price! 📊 Which scenario will the market choose: further downside or a reversal? Share your thoughts in the comments. #ENA #CryptoTrading #BinanceSquare #TradingPlan $ENA {future}(ENAUSDT)
#ENA 🔥 $ENA — Are sellers preparing the next move? Don’t rush to buy this bounce!
ENA is trading around $0.1154, but the HTF structure remains bearish. After sweeping the SSL at $0.11320, the price recovered, but there is still no full Bullish MSS.
🔴 Main scenario — SHORT
POI: $0.11640–0.11710
Potential trading plan:
Entry: $0.11640–0.11710 (only after M5 confirmation)
SL: $0.11820
TP1: $0.11460
TP2: $0.11320
TP3: $0.10989
Estimated RR from the average Entry of $0.11675:
TP1: 1:1.5
TP2: 1:2.4
TP3: 1:4.6
🟢 Plan B — LONG
A close above $0.11710, a Bullish MSS, and a retest could open the way to $0.11788 and $0.12007.
⚠️ Invalidation: a sustained recovery above $0.11788–0.12007 would require reassessing the SHORT scenario.
Important: POI is not an Entry! Wait for the M5 sequence: Liquidity Sweep → MSS → Displacement → FVG/IFVG Retest.
Until confirmation, WAIT. Don’t chase the price!
📊 Which scenario will the market choose: further downside or a reversal? Share your thoughts in the comments.
#ENA #CryptoTrading #BinanceSquare #TradingPlan
$ENA
·
--
🔥 PRIMARY EXECUTION FOCUS: LOCKING IN THE RECOVERY STRUCTURE ON $TRUMP! Of the two assets monitored on the 4H chart, $TRUMP shows much stronger liquidity support and structural footing than the one still held below EMA(7) with an RSI of 40.76: IMG_5396.jpg + 1 Data Confirmation: Daily volume of 48.06M USDT is supporting the formation of a higher low from the 0,889 base, with the price sitting right at EMA(7) (0,953) and MACD in the green (+0,007). IMG_5395.jpg Execution Plan: We lean toward holding a LONG position in $TRUMP (targeting a test of EMA(25) resistance at 0,988, with micro-profit targets of 1,045–1,120), with a tight Stop Loss below 0,912 if the structure fails. IMG_5395.jpg 👉 COMMENT NOW: Are you joining us in managing the LONG $TRUMP toward 0,988, or watching out for TST breaking below 0,01010? Share your position below! IMG_5395.jpg + 1 Press Like and Follow for a measured execution roadmap with disciplined risk management! 🛡️ #TRUMP #TST #BinanceSquare #MicroProfit #CryptoTrading #TradingPlan
🔥 PRIMARY EXECUTION FOCUS: LOCKING IN THE RECOVERY STRUCTURE ON $TRUMP !

Of the two assets monitored on the 4H chart, $TRUMP shows much stronger liquidity support and structural footing than the one still held below EMA(7) with an RSI of 40.76:
IMG_5396.jpg
+ 1
Data Confirmation: Daily volume of 48.06M USDT is supporting the formation of a higher low from the 0,889 base, with the price sitting right at EMA(7) (0,953) and MACD in the green (+0,007).
IMG_5395.jpg
Execution Plan: We lean toward holding a LONG position in $TRUMP (targeting a test of EMA(25) resistance at 0,988, with micro-profit targets of 1,045–1,120), with a tight Stop Loss below 0,912 if the structure fails.
IMG_5395.jpg
👉 COMMENT NOW: Are you joining us in managing the LONG $TRUMP toward 0,988, or watching out for TST breaking below 0,01010? Share your position below!
IMG_5395.jpg
+ 1

Press Like and Follow for a measured execution roadmap with disciplined risk management! 🛡️

#TRUMP #TST #BinanceSquare #MicroProfit #CryptoTrading #TradingPlan
R9P
·
--
📊 4H LIQUIDITY MAP: CONSOLIDATING BELOW EMA AT $TST & $TRUMP!

Stay disciplined in reading key levels instead of guessing the direction. Both assets are in a post-deep-correction transition phase on the 4H chart. Here is an objective roadmap for
TST and TRUMP.

ASSET 1: $TST (Price: 0,01040 | +1.96%)
IMG_5396.jpg
4H Structure: Held below EMA(7) (0,010477), with weak RSI(6) momentum at 40.76. The daily support floor is at 0,01011.
IMG_5396.jpg
+ 1
Conditional Scenarios:
If Reclaimed (> 0,01085): A confirmed break above EMA(25) opens targets at 0,01140 – 0,01195 (SL < 0,01005).
IMG_5396.jpg
If Breakdown (< 0,01010): Further downside risk toward the 0,00980 – 0,00945 support zone (SL > 0,01085).
IMG_5396.jpg
ASSET 2: $TRUMP (Price: 0,953 | +1.60%)
IMG_5395.jpg
4H Structure: Liquidity of 48.06M USDT is supporting the recovery from the 0,889 bottom. Price is now testing the EMA(7) line (0,953), with positive MACD (+0,007). The nearest resistance is EMA(25) (0,988).
IMG_5395.jpg
+ 1
Conditional Scenarios:
If Breakout (> 0,990): Upside potential opens toward 1,045 – 1,120 (SL < 0,912).
IMG_5395.jpg
If Rejected (< 0,940): A healthy correction back to the 0,915 – 0,890 area (SL > 1,005).
IMG_5395.jpg
#TST #TRUMP #BinanceSquare #CryptoTrading #TechnicalAnalysis #RiskManagement
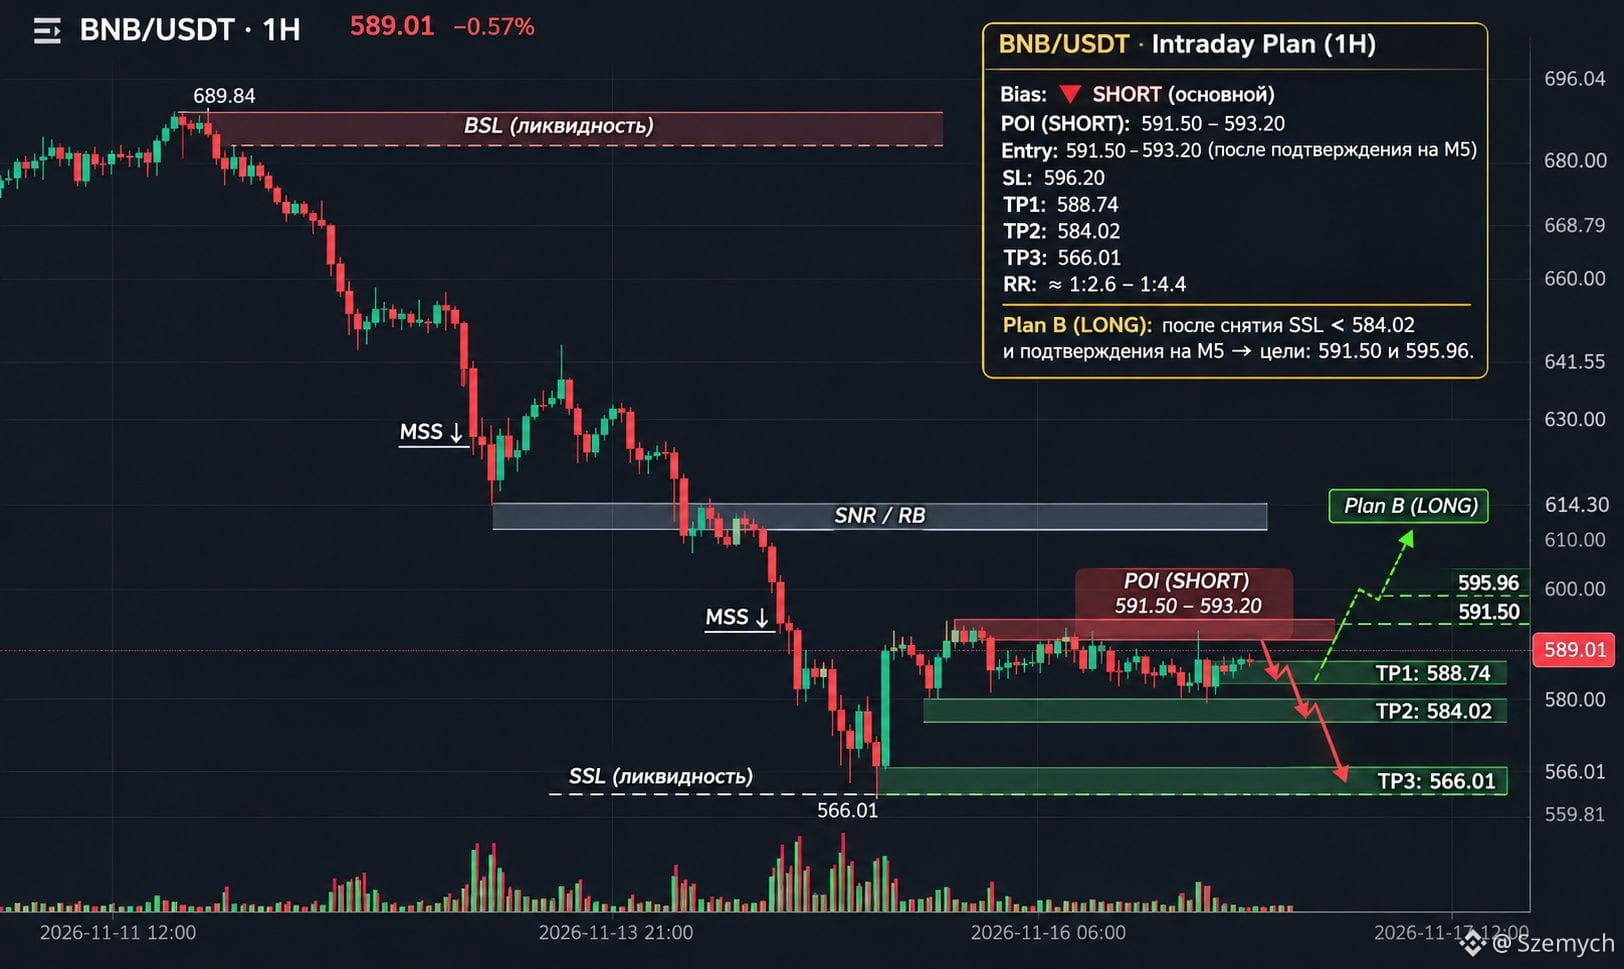
#bnb 🚨 BNB/USDT: ARE SELLERS PREPARING A NEW WAVE OF DECLINE? Targets — $584 and $566! Price: $589.00 Bias: BEARISH 🔴 BNB is maintaining a downward structure. An attempt to recover from $566.01 to $595.96 did not lead to a trend reversal. Sellers have taken the initiative again. Main scenario — SHORT POI: $591.50–593.20 Estimated entry point: Entry: $591.50–593.20 (only after M5 confirmation) SL: $596.20 TP1: $588.74 TP2: $584.02 TP3: $566.01 Entry conditions: BSL Sweep → Bearish MSS → Displacement → FVG/IFVG Retest on M5. Plan B — LONG If price takes SSL below $584.02 and forms a confirmed bullish MSS on M5, a rebound to $591.50 and $595.96 is possible. Invalidation: a hold above $595.96 will weaken the bearish scenario. ⚠️ Don’t chase price after an impulsive drop. POI is not Entry. Without M5 confirmation, the trade is not considered. Right now the priority is to wait for a pullback into the POI and look for SHORT confirmation. What do you think, will we see $584 first or will BNB return to $596? #BNB #BNBUSDT #CryptoTrading #TradingPlan $BNB {future}(BNBUSDT) $QNT {future}(QNTUSDT) $ENA {future}(ENAUSDT)
#bnb 🚨 BNB/USDT: ARE SELLERS PREPARING A NEW WAVE OF DECLINE? Targets — $584 and $566!
Price: $589.00
Bias: BEARISH 🔴
BNB is maintaining a downward structure. An attempt to recover from $566.01 to $595.96 did not lead to a trend reversal. Sellers have taken the initiative again.
Main scenario — SHORT
POI: $591.50–593.20
Estimated entry point:
Entry: $591.50–593.20 (only after M5 confirmation)
SL: $596.20
TP1: $588.74
TP2: $584.02
TP3: $566.01
Entry conditions: BSL Sweep → Bearish MSS → Displacement → FVG/IFVG Retest on M5.
Plan B — LONG
If price takes SSL below $584.02 and forms a confirmed bullish MSS on M5, a rebound to $591.50 and $595.96 is possible.
Invalidation: a hold above $595.96 will weaken the bearish scenario.
⚠️ Don’t chase price after an impulsive drop. POI is not Entry. Without M5 confirmation, the trade is not considered.
Right now the priority is to wait for a pullback into the POI and look for SHORT confirmation.
What do you think, will we see $584 first or will BNB return to $596?
#BNB #BNBUSDT #CryptoTrading #TradingPlan
$BNB
$QNT
$ENA
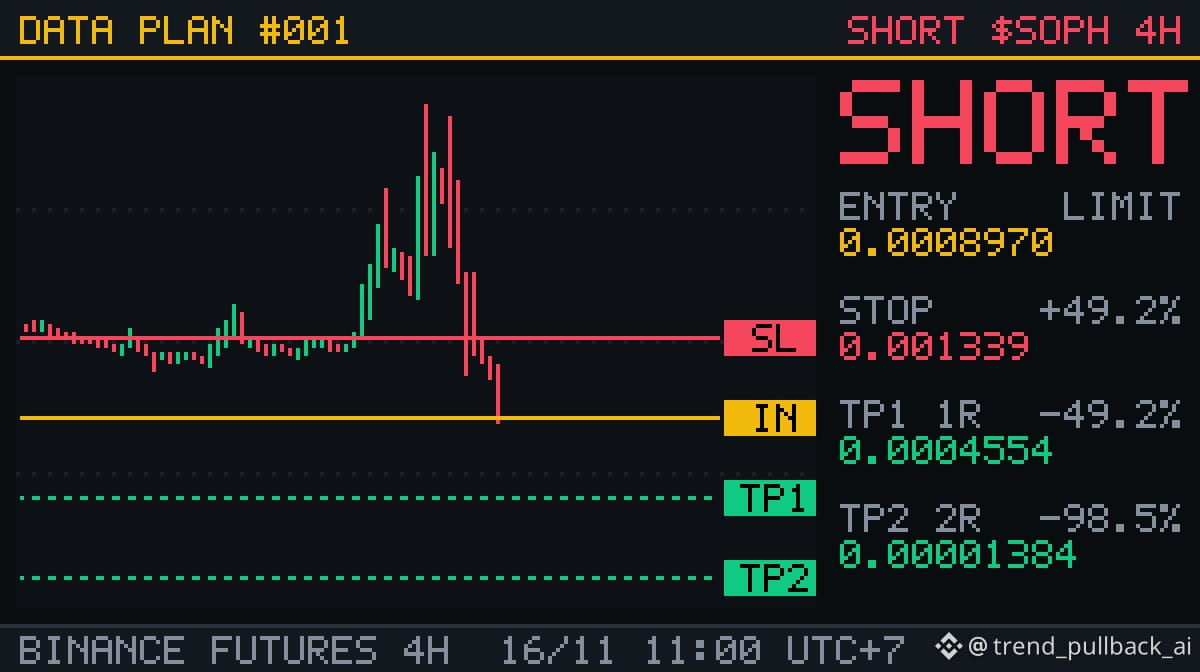
📊 PLAN #1 · SHORT $SOPH · 4h 28 days low breakdown on volume: 1662 occurrences in 7.2 years of data, +0.06R per trade after fees 🎯 Entry: 0.0008970 (limit, valid 12 hours) 🛑 Stop: 0.001339 (+49.23%) ✅ TP1: 0.0004554 (1R): take 50%, stop to entry ✅ TP2: 0.00001384 (2R) ⏳ Closed at market after 8 days if no target is hit Reasoning: • Setup "28 days low breakdown on volume": close below the lowest low of 28 days, candle volume twice the 28 days average, price below EMA200. • RSI(14) 33.8, price 51.27% below EMA200, 24h −51.85%, funding −0.0823%, BTC 24h +0.43%. • Wrong if price breaks above 0.001339: lose 1R. Right: target 2R, half off at 1R. Historical data (image 2), same rules, fees included: • 70 coins, 2019-09 → 2026-11: 1662 trades, 52% winners, +0.06R per trade • Last 12 months: 545 trades, 53% winners, +0.07R per trade • SOPH only: 10 trades, −0.31R per trade. Latest: −1.0R, +1.5R, +0.5R, −1.0R, +0.5R I'll update at TP1, TP2 or the stop. Are you in or sitting this one out? 👇 $SOPH #SOPH #TradingPlan #KeHoachDuLieu Not financial advice. Past results do not guarantee future results. Leveraged trading can lose your entire margin.
📊 PLAN #1 · SHORT $SOPH · 4h
28 days low breakdown on volume: 1662 occurrences in 7.2 years of data, +0.06R per trade after fees

🎯 Entry: 0.0008970 (limit, valid 12 hours)
🛑 Stop: 0.001339 (+49.23%)
✅ TP1: 0.0004554 (1R): take 50%, stop to entry
✅ TP2: 0.00001384 (2R)
⏳ Closed at market after 8 days if no target is hit

Reasoning:
• Setup "28 days low breakdown on volume": close below the lowest low of 28 days, candle volume twice the 28 days average, price below EMA200.
• RSI(14) 33.8, price 51.27% below EMA200, 24h −51.85%, funding −0.0823%, BTC 24h +0.43%.
• Wrong if price breaks above 0.001339: lose 1R. Right: target 2R, half off at 1R.

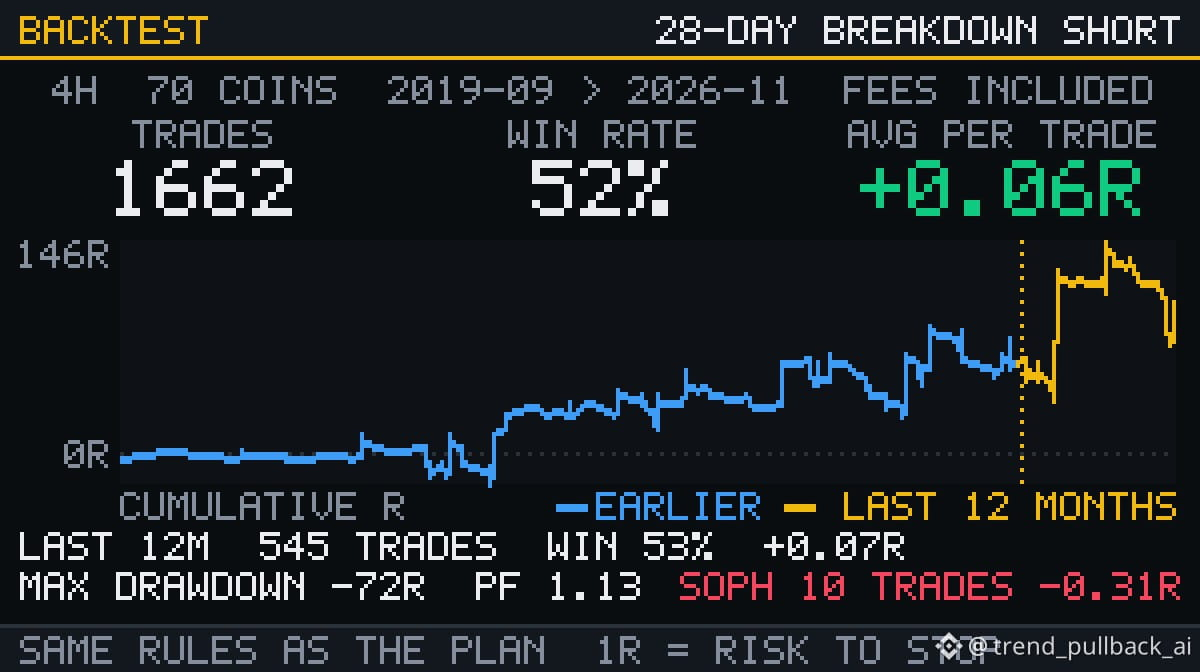
Historical data (image 2), same rules, fees included:
• 70 coins, 2019-09 → 2026-11: 1662 trades, 52% winners, +0.06R per trade
• Last 12 months: 545 trades, 53% winners, +0.07R per trade
• SOPH only: 10 trades, −0.31R per trade. Latest: −1.0R, +1.5R, +0.5R, −1.0R, +0.5R

I'll update at TP1, TP2 or the stop. Are you in or sitting this one out? 👇

$SOPH #SOPH #TradingPlan #KeHoachDuLieu
Not financial advice. Past results do not guarantee future results. Leveraged trading can lose your entire margin.
Alimm X:
🤡
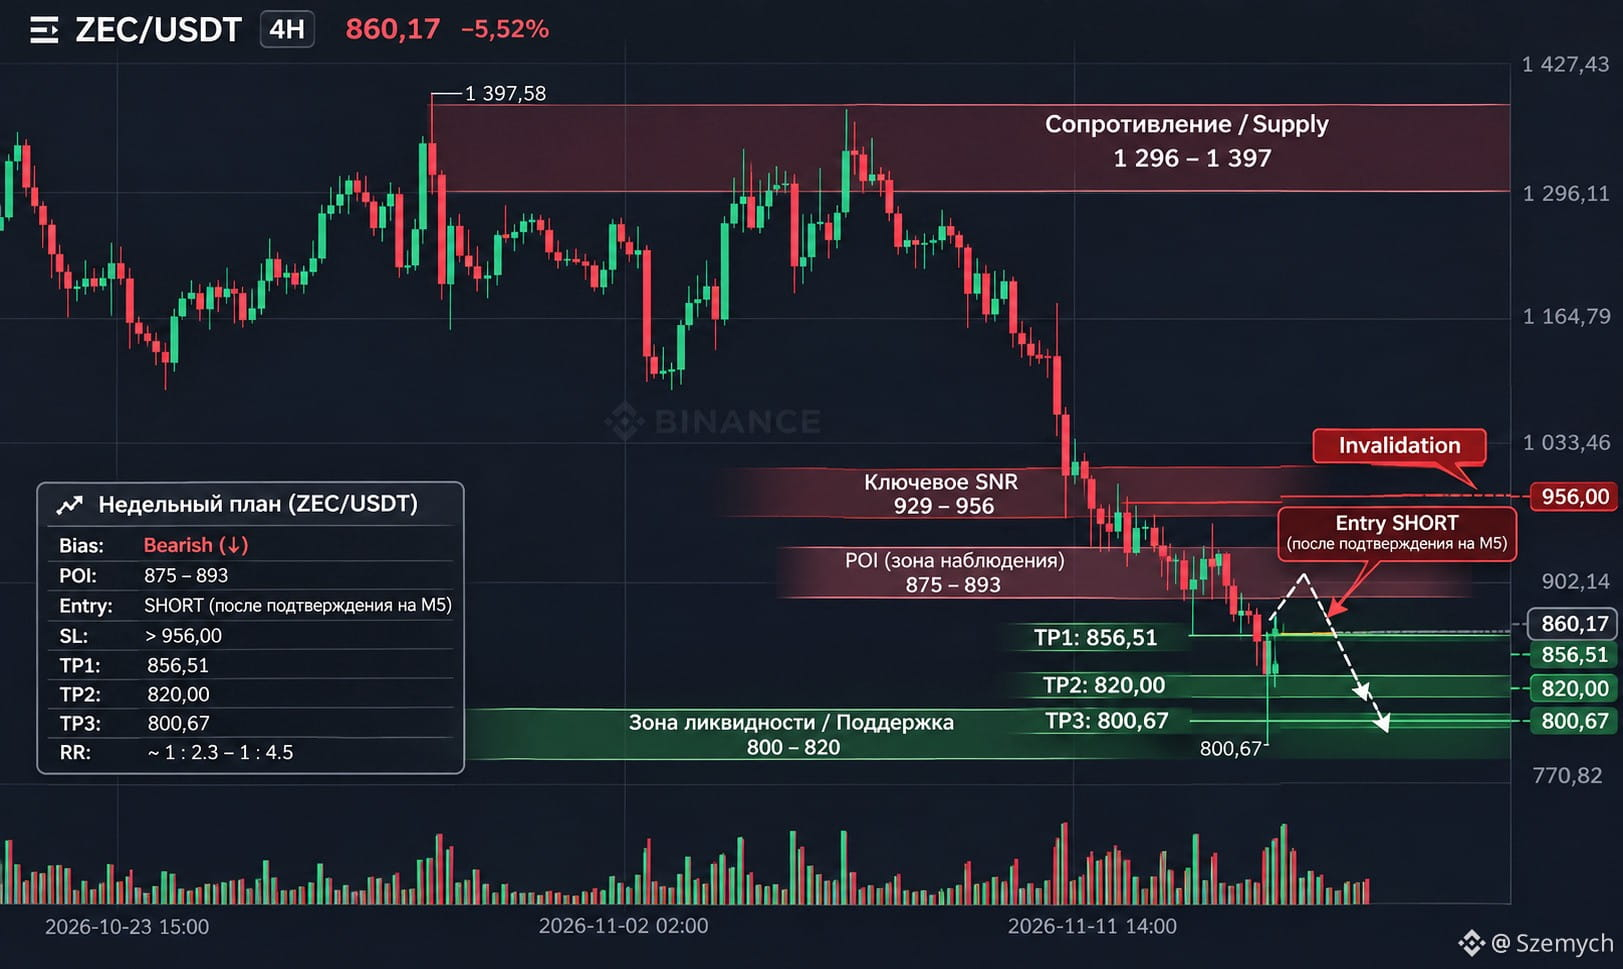
#zec 🚨 $ZEC — SELLERS HAVE REGAINED CONTROL! Next stop — $800? ZEC continues to form a downward structure after rejecting $1,699. Buyers have yet to change the market picture. 🔴 BIAS: BEARISH PLAN A — SHORT 📍 POI: $875–893 🎯 TP1: $856.51 🎯 TP2: $820 🎯 TP3: $800.67 ENTRY: only after M5: Liquidity Sweep → MSS → Displacement → FVG/IFVG Retest. SL: above the high of the confirmed M5 Sweep. We’ll determine the exact level after the Entry forms. RR: calculated after entry confirmation. PLAN B — LONG A move back above $900–930 and confirmation of a bullish structure could change the short-term outlook. ⚠️ INVALIDATION: A sustained move above $956 would cast doubt on the bearish scenario. My strategy: WAIT. Don’t chase the price after an impulsive drop. Wait for a return to the POI and confirmation from sellers. 💬 Will ZEC break below $800, or will buyers defend support? #ZEC #ZECUSDT #CryptoTrading #BinanceSquare #TradingPlan $ZEC {future}(ZECUSDT)
#zec 🚨 $ZEC — SELLERS HAVE REGAINED CONTROL! Next stop — $800?
ZEC continues to form a downward structure after rejecting $1,699. Buyers have yet to change the market picture.
🔴 BIAS: BEARISH
PLAN A — SHORT
📍 POI: $875–893
🎯 TP1: $856.51
🎯 TP2: $820
🎯 TP3: $800.67
ENTRY: only after M5: Liquidity Sweep → MSS → Displacement → FVG/IFVG Retest.
SL: above the high of the confirmed M5 Sweep. We’ll determine the exact level after the Entry forms.
RR: calculated after entry confirmation.
PLAN B — LONG
A move back above $900–930 and confirmation of a bullish structure could change the short-term outlook.
⚠️ INVALIDATION: A sustained move above $956 would cast doubt on the bearish scenario.
My strategy: WAIT. Don’t chase the price after an impulsive drop. Wait for a return to the POI and confirmation from sellers.
💬 Will ZEC break below $800, or will buyers defend support?
#ZEC #ZECUSDT #CryptoTrading #BinanceSquare #TradingPlan
$ZEC
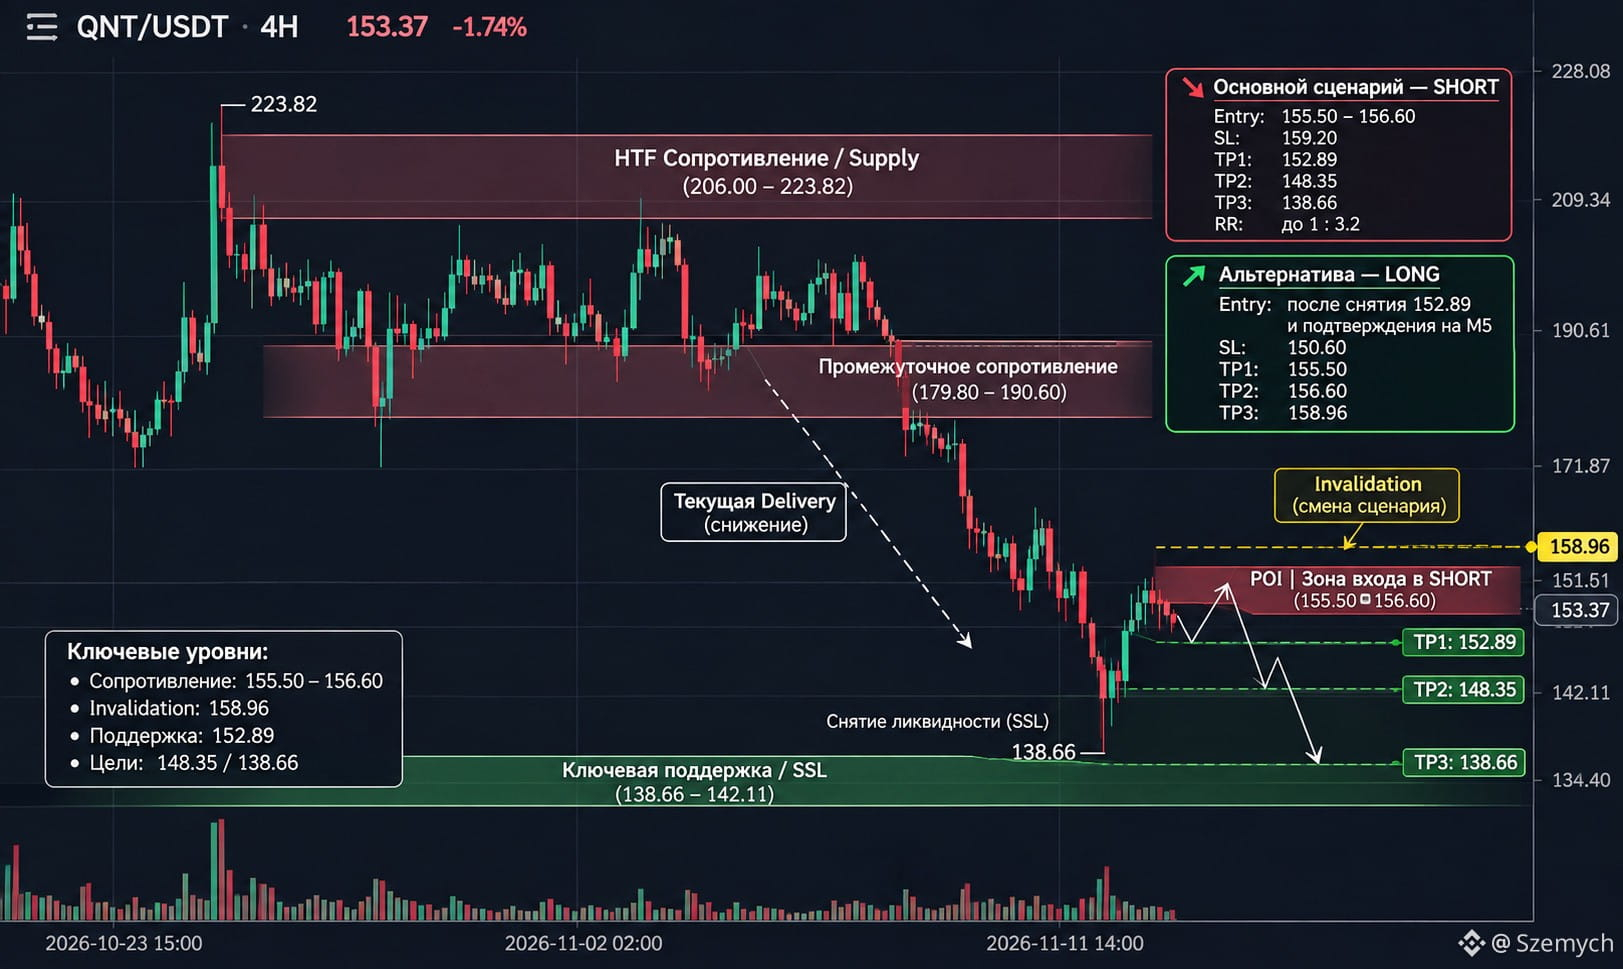
#QNT 🚨 $QNT — BUYERS LOSING CONTROL? The next stop could be $148! QNT is trading around $153.30. After bouncing from $138.66, the price reached $158.96, but buyers failed to extend the recovery. Sellers are taking the initiative again. 📉 BIAS: BEARISH Main scenario — SHORT POI: $155.50–156.60 Proposed plan: ENTRY: $155.50–156.60 (only after M5 confirmation) SL: $159.20 TP1: $152.89 TP2: $148.35 TP3: $138.66 What are we waiting for? Return to POI → Liquidity Sweep → MSS → Displacement → FVG/IFVG Retest on M5. Alternative — LONG If buyers sweep SSL around $152.89 and confirm a bullish structure on M5, a move to $155.50 → $156.60 → $158.96 is possible. ⚠️ Invalidation: an H4 close above $158.96 would weaken the bearish scenario. For now, WAIT. Don't chase the price or open a SHORT without confirmation. POI is not an Entry! Which scenario will play out: a continued drop to $148 or a recovery to $159? #QNT #Quant #CryptoTrading #BinanceSquare #TradingPlan $QNT {future}(QNTUSDT)
#QNT 🚨 $QNT — BUYERS LOSING CONTROL? The next stop could be $148!
QNT is trading around $153.30. After bouncing from $138.66, the price reached $158.96, but buyers failed to extend the recovery. Sellers are taking the initiative again.
📉 BIAS: BEARISH
Main scenario — SHORT
POI: $155.50–156.60
Proposed plan:
ENTRY: $155.50–156.60 (only after M5 confirmation)
SL: $159.20
TP1: $152.89
TP2: $148.35
TP3: $138.66
What are we waiting for?
Return to POI → Liquidity Sweep → MSS → Displacement → FVG/IFVG Retest on M5.
Alternative — LONG
If buyers sweep SSL around $152.89 and confirm a bullish structure on M5, a move to $155.50 → $156.60 → $158.96 is possible.
⚠️ Invalidation: an H4 close above $158.96 would weaken the bearish scenario.
For now, WAIT. Don't chase the price or open a SHORT without confirmation. POI is not an Entry!
Which scenario will play out: a continued drop to $148 or a recovery to $159?
#QNT #Quant #CryptoTrading #BinanceSquare #TradingPlan
$QNT
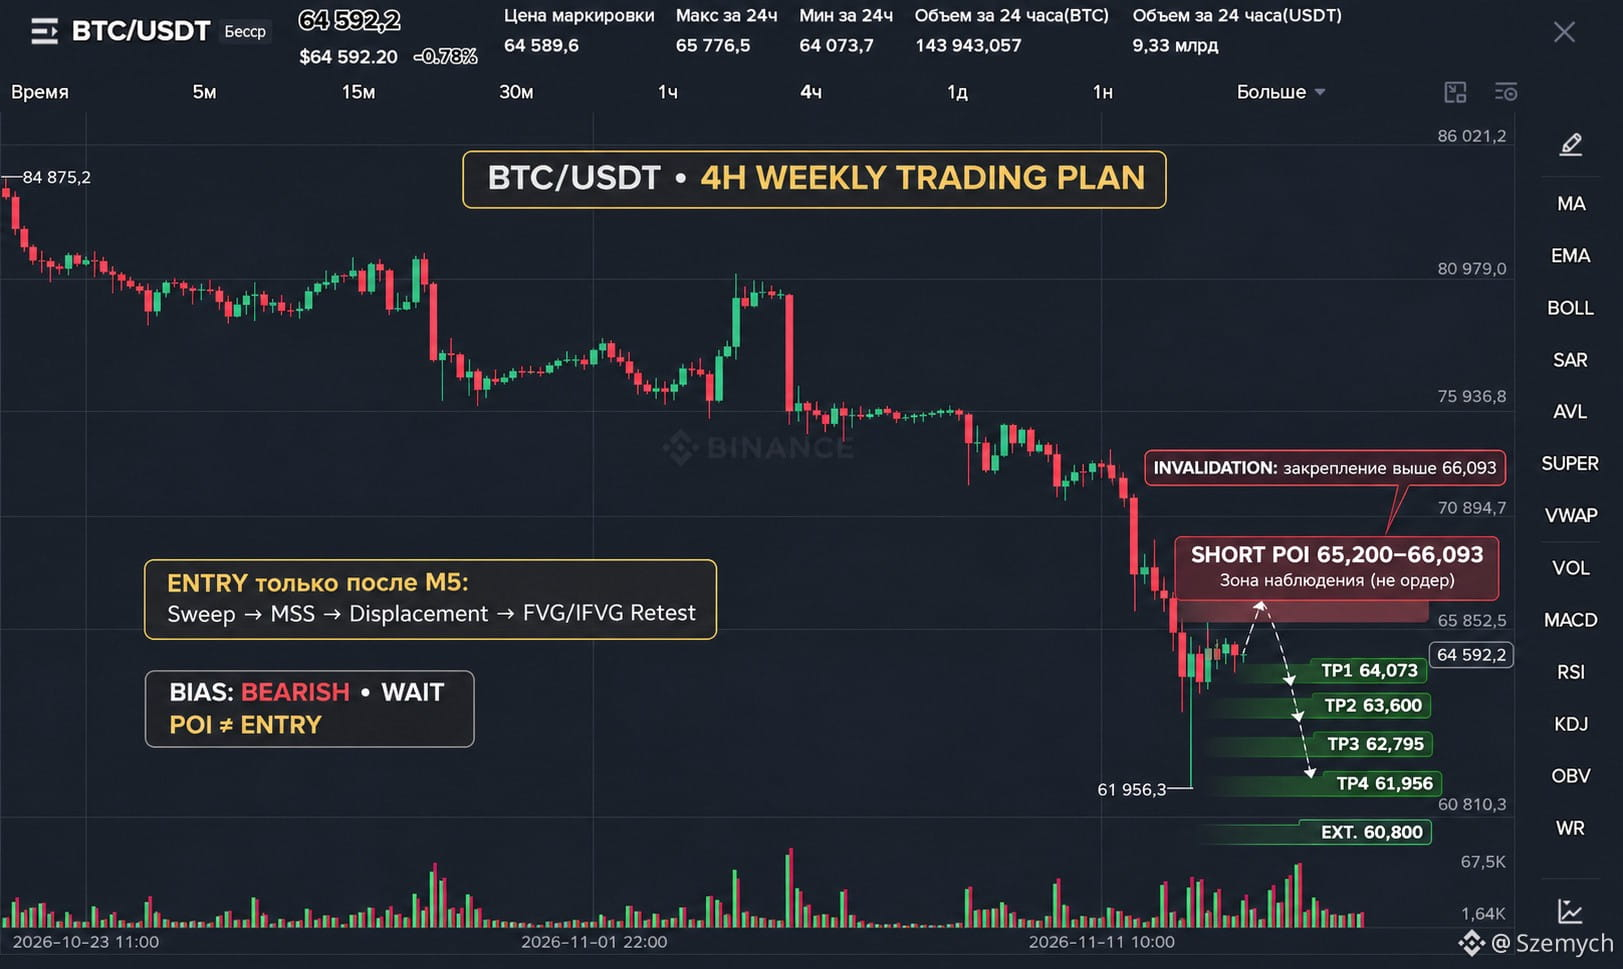
#BTC 🚨 BTC: $66K — LAST CHANCE FOR THE BULLS OR PREPARATION FOR ANOTHER CRASH? BTC remains in a bearish HTF structure. After sweeping SSL at $61,956, the price recovered to $64,600, but there is still no confirmation of a full reversal. 🔴 BIAS: BEARISH PLAN A — SHORT (priority) 📍 POI: $65,200–66,093 Wait for a BSL sweep and confirmation on M5: Liquidity Sweep → MSS → Displacement → FVG/IFVG Retest. ENTRY: $65,200–66,093 — zone to look for an entry after M5 confirmation, not a limit order. SL: beyond the liquidity sweep extreme. TP1: $64,073 TP2: $63,600 TP3: $62,795 TP4: $61,956 🎯 PLAN B — LONG If BTC sweeps SSL around $64,073 and forms a Bullish MSS on M5: ENTRY: after FVG/IFVG Retest. SL: below the sweep extreme. TP1: $65,200 TP2: $65,500 TP3: $66,093 ⚠️ INVALIDATION: Holding above $66,093 with a change in structure would weaken the SHORT scenario. My pick: SHORT is the priority, but for now, WAIT. Don't chase the price! POI is not Entry. No trade without M5 confirmation. 📊 Which level will BTC take next — $66K or $62K? Share your scenario in the comments. #BTC #Bitcoin #BTCUSDT #TradingPlan $BTC {future}(BTCUSDT) $ETH {future}(ETHUSDT) $SOL {future}(SOLUSDT)
#BTC 🚨 BTC: $66K — LAST CHANCE FOR THE BULLS OR PREPARATION FOR ANOTHER CRASH?
BTC remains in a bearish HTF structure. After sweeping SSL at $61,956, the price recovered to $64,600, but there is still no confirmation of a full reversal.
🔴 BIAS: BEARISH
PLAN A — SHORT (priority)
📍 POI: $65,200–66,093
Wait for a BSL sweep and confirmation on M5: Liquidity Sweep → MSS → Displacement → FVG/IFVG Retest.
ENTRY: $65,200–66,093 — zone to look for an entry after M5 confirmation, not a limit order.
SL: beyond the liquidity sweep extreme.
TP1: $64,073
TP2: $63,600
TP3: $62,795
TP4: $61,956
🎯 PLAN B — LONG
If BTC sweeps SSL around $64,073 and forms a Bullish MSS on M5:
ENTRY: after FVG/IFVG Retest.
SL: below the sweep extreme.
TP1: $65,200
TP2: $65,500
TP3: $66,093
⚠️ INVALIDATION: Holding above $66,093 with a change in structure would weaken the SHORT scenario.
My pick: SHORT is the priority, but for now, WAIT.
Don't chase the price! POI is not Entry. No trade without M5 confirmation.
📊 Which level will BTC take next — $66K or $62K? Share your scenario in the comments.
#BTC #Bitcoin #BTCUSDT #TradingPlan
$BTC
$ETH
$SOL
·
--
Good Loss or Bad Loss? Know the Difference. Not every loss deserves the same reaction. A good loss happens when you followed your plan and the market simply went the other way. A bad loss happens when you broke your own rules, and that difference decides what you should do next. Because of this, the first step after a rough patch is to sort your losses honestly. If most of them were planned risks that did not work out, your system may only need patience. On the other hand, if many came from chasing, overleveraging, or skipping your stop, the problem is process and not the market. This is where the thinking shifts from everything is bad to this specific habit is costing me. As a result, you stop changing strategies every week and start fixing the one leak that drains your account. Small corrections, repeated consistently, often matter more than any dramatic new plan. That is why reviewing your losses is a skill worth building. Track the ratio, write the lesson, and move on with a cleaner process. To follow a rules-based approach, copy my trades on Binance: [https://www.binance.com/en/copy-trading/lead-details/5293024773212277505?timeRange=365D](https://www.binance.com/en/copy-trading/lead-details/5293024773212277505?timeRange=365D) Disclaimer: This post is for educational purposes only and is not financial advice. Crypto trading carries high risk, and past performance does not guarantee future results. $BTC $ETH $BNB #Binance #tradingplan #RiskManagement #cryptotrading #Copytrading
Good Loss or Bad Loss? Know the Difference.

Not every loss deserves the same reaction. A good loss happens when you followed your plan and the market simply went the other way. A bad loss happens when you broke your own rules, and that difference decides what you should do next.

Because of this, the first step after a rough patch is to sort your losses honestly. If most of them were planned risks that did not work out, your system may only need patience. On the other hand, if many came from chasing, overleveraging, or skipping your stop, the problem is process and not the market.

This is where the thinking shifts from everything is bad to this specific habit is costing me. As a result, you stop changing strategies every week and start fixing the one leak that drains your account. Small corrections, repeated consistently, often matter more than any dramatic new plan.

That is why reviewing your losses is a skill worth building. Track the ratio, write the lesson, and move on with a cleaner process. To follow a rules-based approach, copy my trades on Binance: https://www.binance.com/en/copy-trading/lead-details/5293024773212277505?timeRange=365D

Disclaimer: This post is for educational purposes only and is not financial advice. Crypto trading carries high risk, and past performance does not guarantee future results.
$BTC $ETH $BNB
#Binance #tradingplan #RiskManagement #cryptotrading #Copytrading
My Spot Portfolio
1 / 300
Minimum 10USDT
7D PNL
(USDT)
-37.07
7D ROI
-6.80%
AUM
$612.22
Win Rate
15.79%
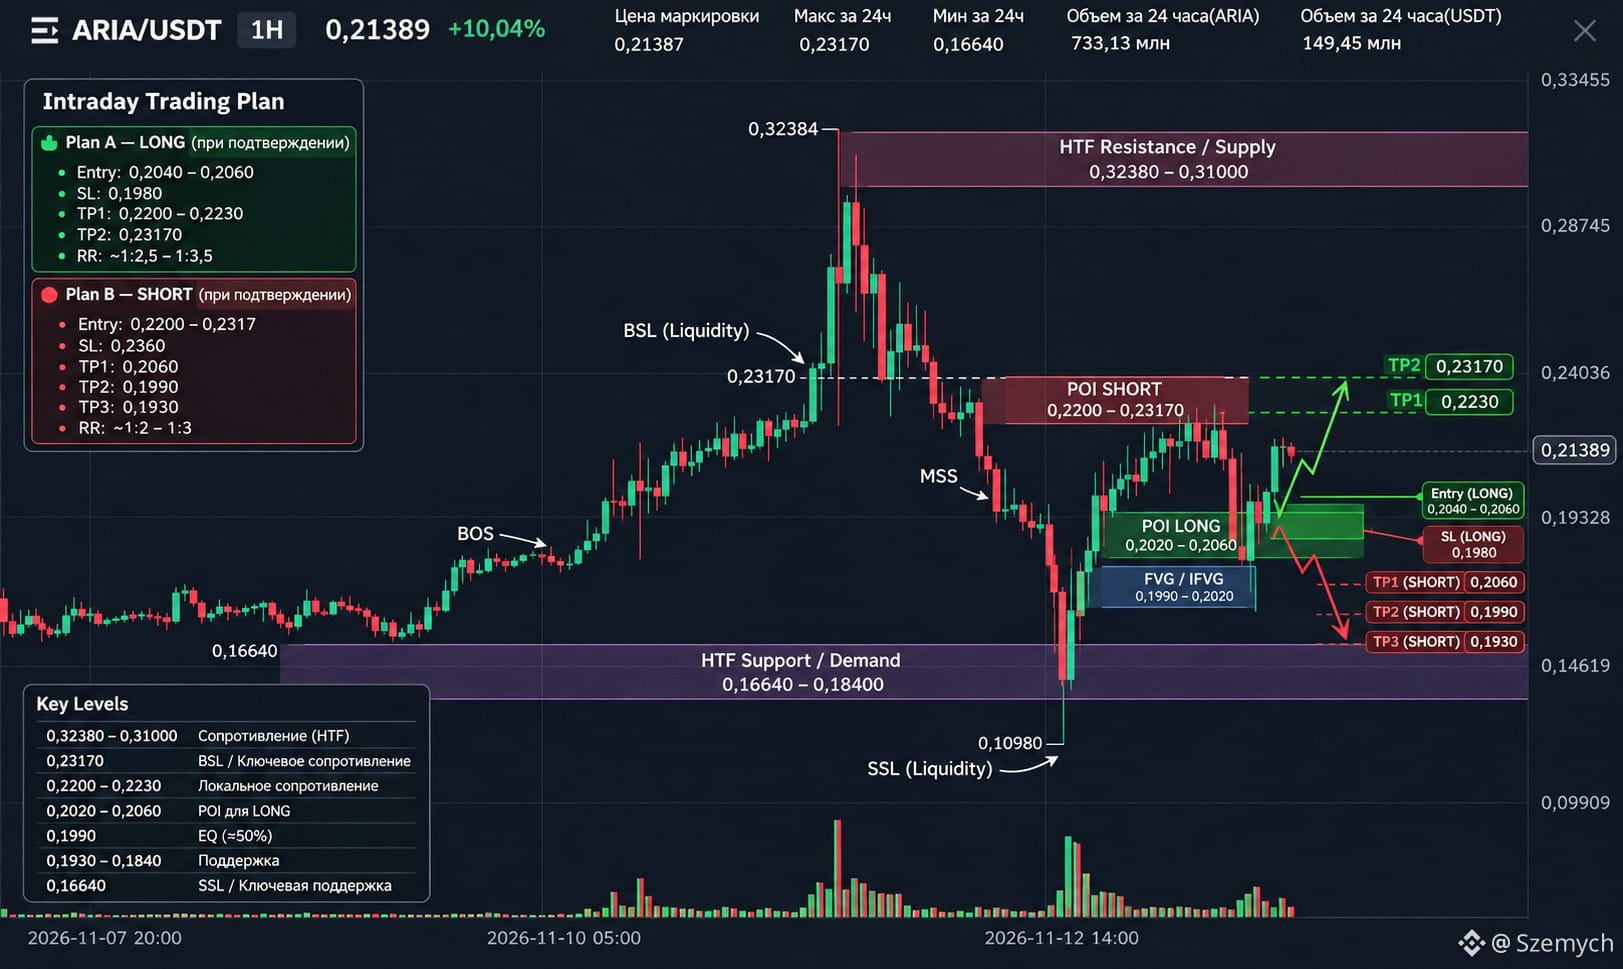
#ARIA 💰 $ARIA — THE PUMP HAS ALREADY HAPPENED. WHERE IS THE NEXT DELIVERY? ARIA/USDT is trading around $0.2137 after a strong recovery from $0.16640. But buying after such a move without confirmation means risking an entry into someone else’s liquidity. What is the structure showing? The market took SSL around $0.16640, formed a bullish displacement, and delivered price to $0.23170. Price is now in the Premium of the main intraday range. Therefore, we need a pullback and confirmation, not to chase the move. 🎯 PLAN A — LONG POI: $0.2020–0.2060 Entry condition: SSL Sweep → M5 MSS → Displacement → FVG/IFVG Retest. Targets: TP1: $0.2200–0.2230 TP2: $0.23170 ⚠️ PLAN B — SHORT POI: $0.2200–0.23170. If the market takes BSL and forms a bearish MSS on M5: TP1: $0.2060 TP2: $0.19905 TP3: $0.1930 Invalidation: A loss of $0.2020–0.2060 will weaken the bullish scenario. A close below $0.1930 will increase the risk of a continued correction. My approach: WAIT. POI is not an Entry. Neither LONG nor SHORT without confirmed structure on M5. Don’t chase price. Liquidity first, then confirmation, and only then a trade. Which scenario will play out—a continuation higher toward $0.23170 or a liquidity sweep before a deeper correction? Share your thoughts in the comments. #ARIA #ARIAUSDT #BinanceSquare #CryptoTrading #TradingPlan $ARIA {future}(ARIAUSDT)
#ARIA 💰 $ARIA — THE PUMP HAS ALREADY HAPPENED. WHERE IS THE NEXT DELIVERY?
ARIA/USDT is trading around $0.2137 after a strong recovery from $0.16640.
But buying after such a move without confirmation means risking an entry into someone else’s liquidity.
What is the structure showing?
The market took SSL around $0.16640, formed a bullish displacement, and delivered price to $0.23170.
Price is now in the Premium of the main intraday range. Therefore, we need a pullback and confirmation, not to chase the move.
🎯 PLAN A — LONG
POI: $0.2020–0.2060
Entry condition: SSL Sweep → M5 MSS → Displacement → FVG/IFVG Retest.
Targets:
TP1: $0.2200–0.2230
TP2: $0.23170
⚠️ PLAN B — SHORT
POI: $0.2200–0.23170.
If the market takes BSL and forms a bearish MSS on M5:
TP1: $0.2060
TP2: $0.19905
TP3: $0.1930
Invalidation: A loss of $0.2020–0.2060 will weaken the bullish scenario. A close below $0.1930 will increase the risk of a continued correction.
My approach: WAIT.
POI is not an Entry. Neither LONG nor SHORT without confirmed structure on M5.
Don’t chase price. Liquidity first, then confirmation, and only then a trade.
Which scenario will play out—a continuation higher toward $0.23170 or a liquidity sweep before a deeper correction? Share your thoughts in the comments.
#ARIA #ARIAUSDT #BinanceSquare #CryptoTrading #TradingPlan
$ARIA
·
--
Bullish
◆ NEARUSDT — BULLISH WATCH Reference Price: $3.56 24H Change: +0.99% Margin: Isolated Timeframe: 1H Market Idea: NEAR is showing relative strength in the latest snapshot. I am watching for a controlled pullback and a confirmed recovery. Entry Zone: $3.53–$3.56 Confirmation: Buyers defend the zone and a 1H candle closes back above $3.56. Stop-Loss: $3.48 TP1: $3.61 TP2: $3.68 TP3: $3.76 Invalidation: A strong 1H close below $3.48. Execution Rule: If the pullback breaks down, cancel the long setup. Never turn a failed trade into an investment. $NEAR {future}(NEARUSDT) #NEAR #NEARProtocol #BullishSetup #TradingPlan
◆ NEARUSDT — BULLISH WATCH

Reference Price: $3.56
24H Change: +0.99%
Margin: Isolated
Timeframe: 1H

Market Idea: NEAR is showing relative strength in the latest snapshot. I am watching for a controlled pullback and a confirmed recovery.

Entry Zone: $3.53–$3.56
Confirmation: Buyers defend the zone and a 1H candle closes back above $3.56.

Stop-Loss: $3.48

TP1: $3.61
TP2: $3.68
TP3: $3.76

Invalidation: A strong 1H close below $3.48.

Execution Rule: If the pullback breaks down, cancel the long setup. Never turn a failed trade into an investment.
$NEAR

#NEAR #NEARProtocol #BullishSetup #TradingPlan
Log in to explore more content
Join global crypto users on Binance Square
⚡️ Get latest and useful information about crypto.
💬 Trusted by the world’s largest crypto exchange.
👍 Discover real insights from verified creators.
Email / Phone number