
#probabilisticanalysis
probabilisticanalysis
85 views
2 Discussing
Hot
Latest

·
--
Bullish
#zec #ProbabilisticAnalysis #tradingplan
🎯 ZEC A 30 DÍAS: Probabilistic mapping for early October and hypothesis testing ($1,122) 📊⏳
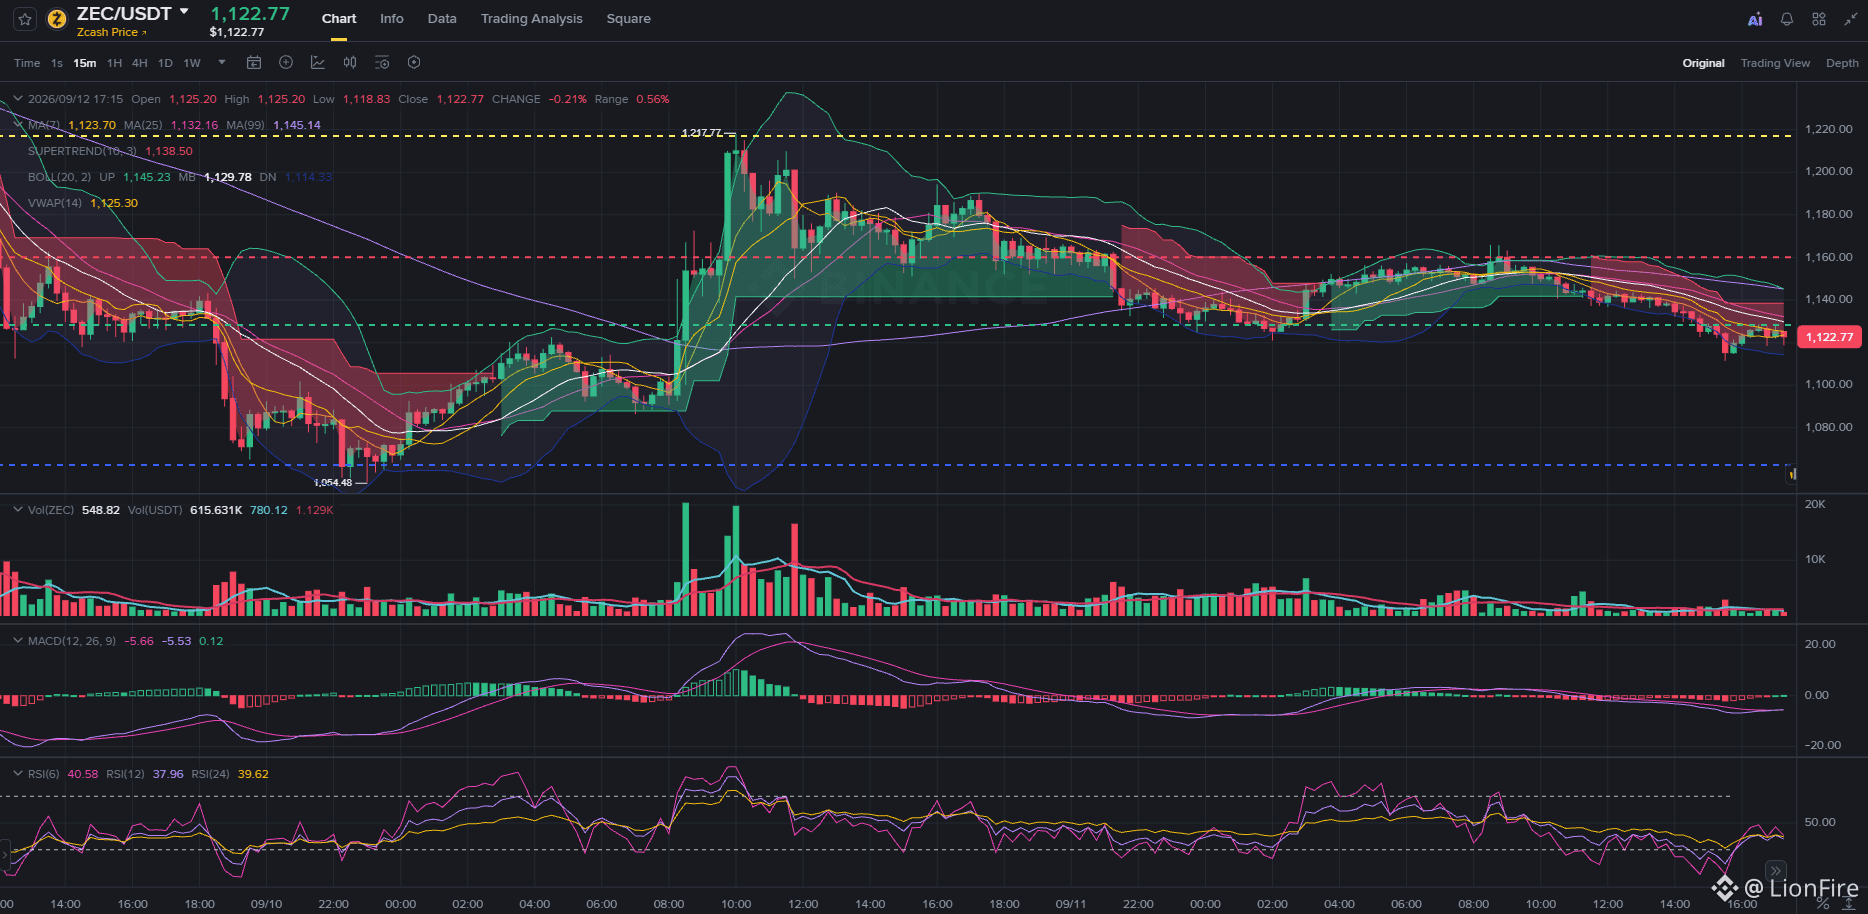
Testing the idea that markets are managed by probabilities, not certainties, we record the technical map of $ZEC ($1,122.77) on 15m. With the price currently testing our Green Line of buy, we set three objective scenarios to contrast exactly one month from now (October 12):
🚀 Bullish (Continuation) 50%
⚖️ Base (Compression) 35%
🔻 Bearish (Capitulation) 15%
🧭 Reading of the 4 marked levels:
🟢 Green Line ($1,120) — Entry Support: Active accumulation level. Price is defending the lower Bollinger band ($1,114) and the RSI(6) is cooling to 40.58 points. As long as this floor holds daily candles, the constructive structure remains alive.
🔴 Red Line ($1,160) — Confirmation Trigger: Intermediate ceiling. Breaking it toward the end of September turns the Supertrend ($1,138.50) to buys and cancels the pressure from the MA99 ($1,145.14), opening the door to acceleration.
🟡 Yellow Line ($1,220) — Major Resistance: Prior local high. Breaking this level with volume confirms the extension toward new cycle highs.
🔵 Blue Line ($1,064) — Safety Net: Invalidation of bullish momentum. Losing $1,120 would force a retest of this key support to avoid a purge toward $1,000.
💡 No bias or guesswork: the statistical edge is buying in the green zone with limited risk and waiting for confirmation on the red line. We save this analysis to audit results in 30 days. Strict risk management and a cool head! 🧠⚡
#zec #ProbabilisticAnalysis #tradingplan
🎯 ZEC A 30 DÍAS: Probabilistic mapping for early October and hypothesis testing ($1,122) 📊⏳
Testing the idea that markets are managed by probabilities, not certainties, we record the technical map of $ZEC ($1,122.77) on 15m. With the price currently testing our Green Line of buy, we set three objective scenarios to contrast exactly one month from now (October 12):
🚀 Bullish (Continuation) 50%
⚖️ Base (Compression) 35%
🔻 Bearish (Capitulation) 15%
🧭 Reading of the 4 marked levels:
🟢 Green Line ($1,120) — Entry Support: Active accumulation level. Price is defending the lower Bollinger band ($1,114) and the RSI(6) is cooling to 40.58 points. As long as this floor holds daily candles, the constructive structure remains alive.
🔴 Red Line ($1,160) — Confirmation Trigger: Intermediate ceiling. Breaking it toward the end of September turns the Supertrend ($1,138.50) to buys and cancels the pressure from the MA99 ($1,145.14), opening the door to acceleration.
🟡 Yellow Line ($1,220) — Major Resistance: Prior local high. Breaking this level with volume confirms the extension toward new cycle highs.
🔵 Blue Line ($1,064) — Safety Net: Invalidation of bullish momentum. Losing $1,120 would force a retest of this key support to avoid a purge toward $1,000.
💡 No bias or guesswork: the statistical edge is buying in the green zone with limited risk and waiting for confirmation on the red line. We save this analysis to audit results in 30 days. Strict risk management and a cool head! 🧠⚡
🎯 ZEC A 30 DÍAS: Probabilistic mapping for early October and hypothesis testing ($1,122) 📊⏳
Testing the idea that markets are managed by probabilities, not certainties, we record the technical map of $ZEC ($1,122.77) on 15m. With the price currently testing our Green Line of buy, we set three objective scenarios to contrast exactly one month from now (October 12):
🚀 Bullish (Continuation) 50%
⚖️ Base (Compression) 35%
🔻 Bearish (Capitulation) 15%
🧭 Reading of the 4 marked levels:
🟢 Green Line ($1,120) — Entry Support: Active accumulation level. Price is defending the lower Bollinger band ($1,114) and the RSI(6) is cooling to 40.58 points. As long as this floor holds daily candles, the constructive structure remains alive.
🔴 Red Line ($1,160) — Confirmation Trigger: Intermediate ceiling. Breaking it toward the end of September turns the Supertrend ($1,138.50) to buys and cancels the pressure from the MA99 ($1,145.14), opening the door to acceleration.
🟡 Yellow Line ($1,220) — Major Resistance: Prior local high. Breaking this level with volume confirms the extension toward new cycle highs.
🔵 Blue Line ($1,064) — Safety Net: Invalidation of bullish momentum. Losing $1,120 would force a retest of this key support to avoid a purge toward $1,000.
💡 No bias or guesswork: the statistical edge is buying in the green zone with limited risk and waiting for confirmation on the red line. We save this analysis to audit results in 30 days. Strict risk management and a cool head! 🧠⚡
220
Log in to explore more content
Join global crypto users on Binance Square
⚡️ Get latest and useful information about crypto.
💬 Trusted by the world’s largest crypto exchange.
👍 Discover real insights from verified creators.
Email / Phone number
Trending Topics
1
#SECReceivesGrayscaleLitecoinTrustETFFiling
26,980 views
549 Discussing
2
#ClarityActFacesProceduralVoteSept15
134,135 views
1,543 Discussing
3
#US10YearTreasuryYieldNears5%
45,536 views
804 Discussing
4
#CryptoLiquidations$674MIn24H
9,933 views
137 Discussing
5
#TokenizedStockHoldersUp619.1%
45,486 views
710 Discussing
6
#RevolutConfirmsFakeGovEmailDataBreach
73,211 views
999 Discussing
7
#CanadaOSFISaysTokenizedDepositsEqualTraditionalDeposits
4,410 views
88 Discussing
8
#USBankCompletesCrossBorderPaymentPilotOnStellar
64,862 views
1,052 Discussing
9
#NvidiaInTalksToInvestUpTo$10BInAnthropicIPO
4,624 views
80 Discussing
10
#EtherRalliesAsBearishBetsLiquidate
97,045 views
1,321 Discussing