
#ntc
ntc
27,137 views
43 Discussing
Hot
Latest

🚀 Bitcoin ($BTC ) Long-Term Growth: From Cents to Six Figures — What Comes Next?
$BTC
Over the years, $BTC has shown one of the strongest growth stories in financial markets. From just a few cents in 2010 to reaching around $126,000, the trend clearly shows long-term strength despite multiple deep corrections. The chart reflects a cycle pattern where strong rallies are followed by sharp pullbacks, and then a new higher move begins.
📊 Key Levels & Trading Plan
Support Zones: 85,000 – 95,000 (strong holding range)
Resistance Zones: 120,000 – 130,000 (major supply zone)
Breakout Entry (Short-Term): Above 130,000 with strong volume
Pullback Entry (Safer): Around 90,000 support zone
Stop Loss:
Short-term: Below 85,000
Mid-term: Below 75,000
Targets:
Short-term: 140,000 – 155,000
Mid-term: 180,000+ if trend continues
---
📈 Professional Market Report for Traders
Bitcoin has followed a clear pattern over time: strong rise, deep correction, and then a new high. This repeating cycle shows that the market grows step by step, not in a straight line. Even after big drops, the price has always managed to recover and move higher in the long run. This gives confidence to long-term investors, but short-term traders must still be careful during volatile phases.
For trading, the best approach is to avoid chasing price when it is already high. Buying near support levels gives better control and lower risk. Breakout trades can work well, but only when strong volume confirms the move. Long-term traders should focus on holding during strong trends and not panic during corrections. Using stop losses and proper risk management is very important. Bitcoin rewards patience, but only disciplined traders can take full advantage of its movement.
#ntc #BTC🔥🔥🔥🔥🔥 #BTC突破7万大关 #BTC70K✈️
$BTC
Over the years, $BTC has shown one of the strongest growth stories in financial markets. From just a few cents in 2010 to reaching around $126,000, the trend clearly shows long-term strength despite multiple deep corrections. The chart reflects a cycle pattern where strong rallies are followed by sharp pullbacks, and then a new higher move begins.
📊 Key Levels & Trading Plan
Support Zones: 85,000 – 95,000 (strong holding range)
Resistance Zones: 120,000 – 130,000 (major supply zone)
Breakout Entry (Short-Term): Above 130,000 with strong volume
Pullback Entry (Safer): Around 90,000 support zone
Stop Loss:
Short-term: Below 85,000
Mid-term: Below 75,000
Targets:
Short-term: 140,000 – 155,000
Mid-term: 180,000+ if trend continues
---
📈 Professional Market Report for Traders
Bitcoin has followed a clear pattern over time: strong rise, deep correction, and then a new high. This repeating cycle shows that the market grows step by step, not in a straight line. Even after big drops, the price has always managed to recover and move higher in the long run. This gives confidence to long-term investors, but short-term traders must still be careful during volatile phases.
For trading, the best approach is to avoid chasing price when it is already high. Buying near support levels gives better control and lower risk. Breakout trades can work well, but only when strong volume confirms the move. Long-term traders should focus on holding during strong trends and not panic during corrections. Using stop losses and proper risk management is very important. Bitcoin rewards patience, but only disciplined traders can take full advantage of its movement.
#ntc #BTC🔥🔥🔥🔥🔥 #BTC突破7万大关 #BTC70K✈️


#MRVLSoarsOnNVDATrillionDollarOutlook #USClarityActAdvancesToSenateAgenda #bedrock $BR #ntc btc dip below 50 k soon

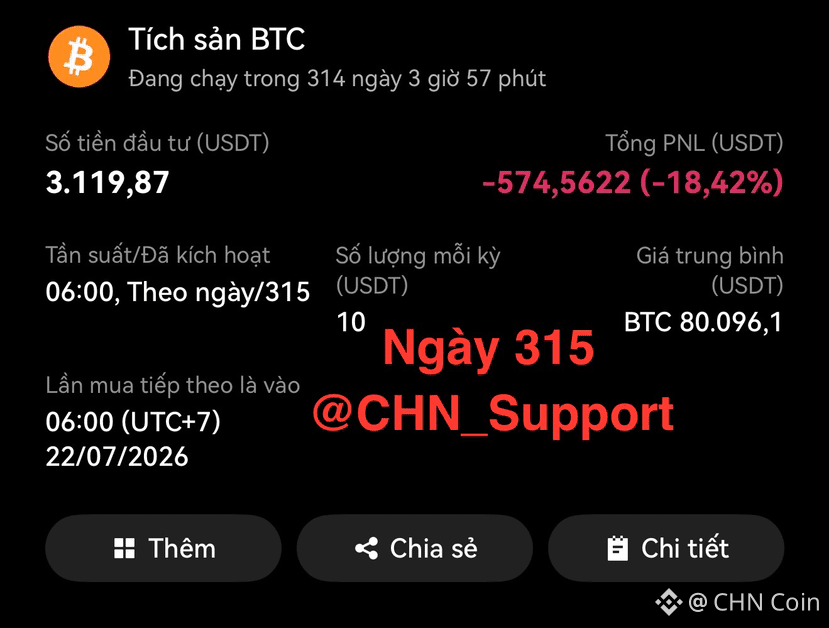
🔥 Accumulating Bitcoin day 315
No matter whether the market is up or down, I still buy Bitcoin at 6:00 AM.
Today is day 315 of my accumulation, everyone.
My accumulation journey has been going for nearly 1 year. I’ll keep it going until around September 1st, when I will pause it in accordance with the law.
By that time, if an exchange has been licensed, I’ll continue on it; if not, I’ll wait.
All the coins I’ve bought before will be withdrawn to my personal wallet for safekeeping.
I’m not too worried about the amount of coins I’ve purchased, because a few years from now, if I want to stop accumulating and sell, that would likely be during an uptrend, and the licensed exchange should also have been well established by then.
While waiting for the exchange and everything to become stable, I’ll still analyze and assess the market as usual.
If the exchange gets approved, I’ll test it and give you feedback, okay.
⚠️ Information is for reference only and not investment advice
#bitcoin #ntc $BTC
No matter whether the market is up or down, I still buy Bitcoin at 6:00 AM.
Today is day 315 of my accumulation, everyone.
My accumulation journey has been going for nearly 1 year. I’ll keep it going until around September 1st, when I will pause it in accordance with the law.
By that time, if an exchange has been licensed, I’ll continue on it; if not, I’ll wait.
All the coins I’ve bought before will be withdrawn to my personal wallet for safekeeping.
I’m not too worried about the amount of coins I’ve purchased, because a few years from now, if I want to stop accumulating and sell, that would likely be during an uptrend, and the licensed exchange should also have been well established by then.
While waiting for the exchange and everything to become stable, I’ll still analyze and assess the market as usual.
If the exchange gets approved, I’ll test it and give you feedback, okay.
⚠️ Information is for reference only and not investment advice
#bitcoin #ntc $BTC

#ntc ☀️ Good morning! The channel *InfoMoney* transmissions on WhatsApp are starting now.
*NY futures fall as tech stocks sell-off intensifies*
U.S. stock index futures are trading mostly lower this Friday (26), pressured by the intensification of a global wave of selling of technology stocks amid growing concerns about rising costs for artificial intelligence infrastructure.
*NY futures fall as tech stocks sell-off intensifies*
U.S. stock index futures are trading mostly lower this Friday (26), pressured by the intensification of a global wave of selling of technology stocks amid growing concerns about rising costs for artificial intelligence infrastructure.

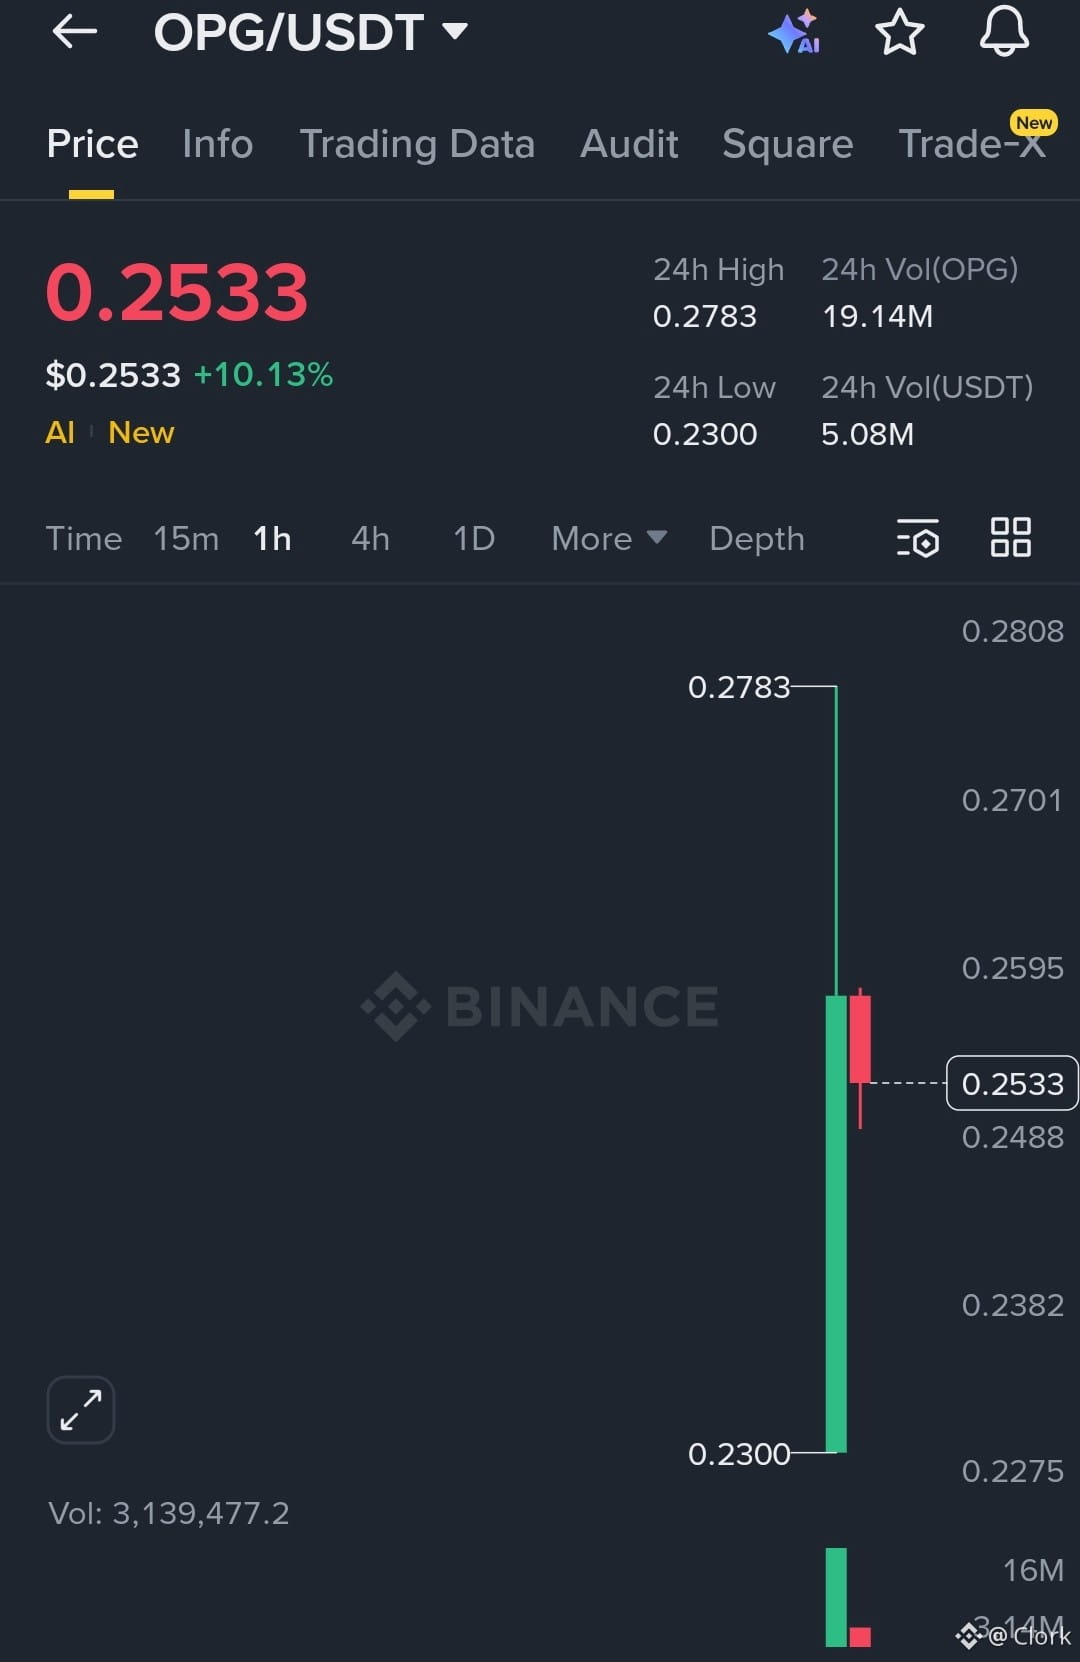
$OPG
Market Event: Buyers defended a key intraday level after a controlled liquidity sweep below recent lows.
Momentum Implication: Price structure favors gradual continuation if higher lows continue forming.
Levels:
• Entry Price (EP): 0.2490 - 0.2520
• Trade Target 1 (TG1): 0.2610
• Trade Target 2 (TG2): 0.2680
• Trade Target 3 (TG3): 0.2760
• Stop Loss (SL): 0.2410
Trade Decision: Long exposure remains valid while price respects the defended support base.
Close: Sustained trading above 0.2490 supports further upside rotation.#OPG #Bydip #NTC #btc70k
Market Event: Buyers defended a key intraday level after a controlled liquidity sweep below recent lows.
Momentum Implication: Price structure favors gradual continuation if higher lows continue forming.
Levels:
• Entry Price (EP): 0.2490 - 0.2520
• Trade Target 1 (TG1): 0.2610
• Trade Target 2 (TG2): 0.2680
• Trade Target 3 (TG3): 0.2760
• Stop Loss (SL): 0.2410
Trade Decision: Long exposure remains valid while price respects the defended support base.
Close: Sustained trading above 0.2490 supports further upside rotation.#OPG #Bydip #NTC #btc70k
Log in to explore more content