Binance Square
#continuationpattern

continuationpattern

1,996 views
22 Discussing
Palanca N Gigante
·
--
Bullish
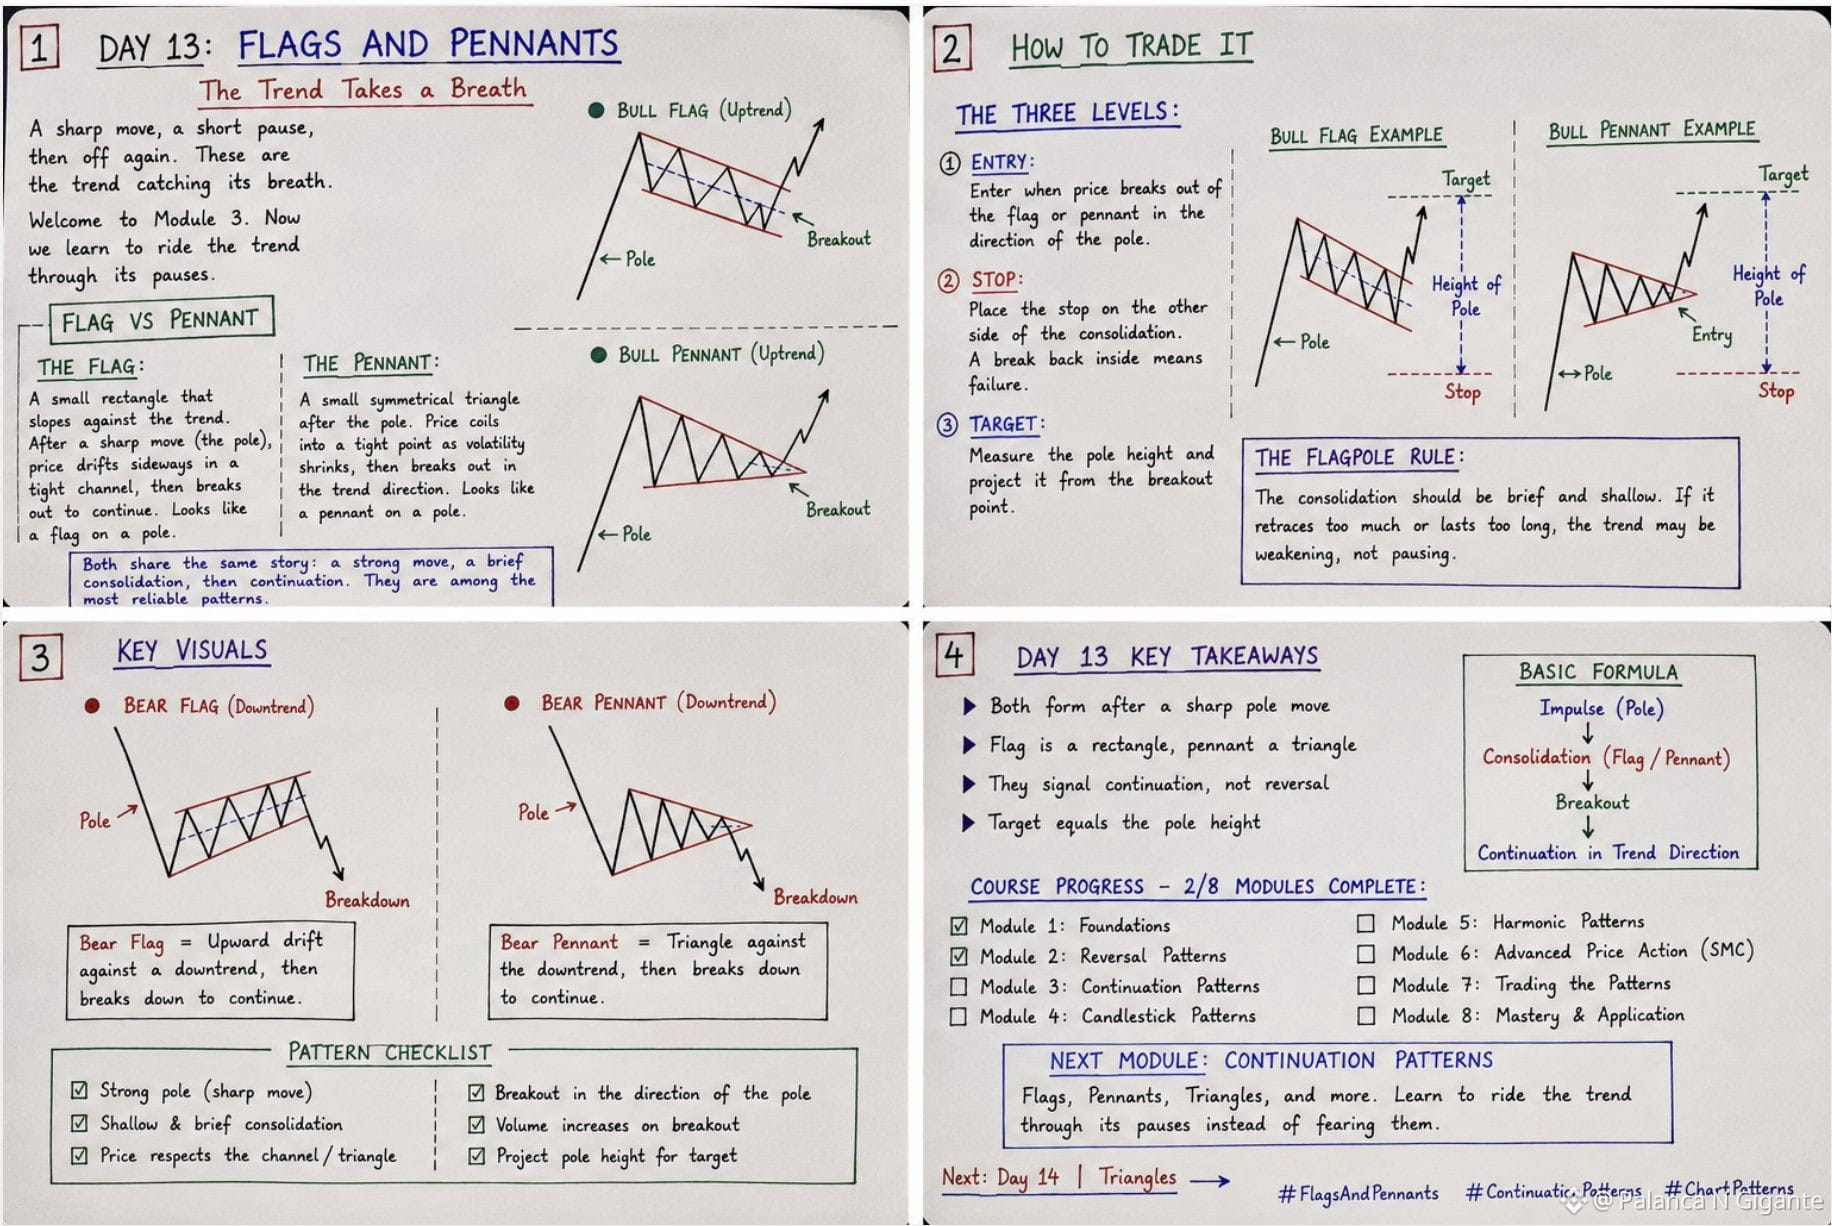
COURSE ON MASTERY OF GRAPHIC PATTERNS: MODULE 3: CONTINUITY PATTERNS | DAY 13 $龙虾 FLAGS AND PENNANTS: The Trend Gives a Pause A sharp move, a brief pause, and then the trend resumes. That’s how the trend catches its breath again. Welcome to Module 3. Now we’ll learn to take advantage of the trend during its pauses. FLAG VS. PENNANT 🟢 THE FLAG: A small, tilted rectangle against the trend. After a sharp move (the pole), the price oscillates sideways in a narrow channel and then breaks out to continue. It looks like a flag on a pole. 🟢 THE PENNANT: A small, symmetrical triangle after the pole. The price concentrates in a narrow point as volatility decreases, and then breaks in the direction of the trend. It looks like a pennant on a pole. $LSK Both share the same story: a strong move, a brief consolidation, and then continuation. They’re among the most reliable patterns. HOW TO TRADE WITH THE THREE LEVELS: ▪️ ENTRY: Enter when the price breaks the flag or pennant in the direction of the pole. ▪️STOP: Place the stop on the other side of the consolidation. A breakout to the inside means failure. ▪️TARGET: Measure the height of the pole and project it from the breakout point. THE POLE RULE: Consolidation must be brief and shallow. If it retraces too much or lasts too long, the trend may be weakening rather than pausing. DAY 13 KEY TAKEAWAYS $GRIFFAIN ▶️Both form after a sharp move from the pole. ▶️The flag is a rectangle; the pennant is a triangle. ▶️They signal continuation, not reversal ▶️The target is equal to the height of the pole. Next: Day 14 | Triangles {future}(龙虾USDT) {future}(GRIFFAINUSDT) {future}(LSKUSDT) #StrategicTrading #FlagsAndPennant #ContinuationPattern #chartpatterns #candlestick_patterns
COURSE ON MASTERY OF GRAPHIC PATTERNS: MODULE 3: CONTINUITY PATTERNS | DAY 13 $龙虾

FLAGS AND PENNANTS: The Trend Gives a Pause

A sharp move, a brief pause, and then the trend resumes. That’s how the trend catches its breath again.

Welcome to Module 3. Now we’ll learn to take advantage of the trend during its pauses. FLAG VS. PENNANT

🟢 THE FLAG: A small, tilted rectangle against the trend. After a sharp move (the pole), the price oscillates sideways in a narrow channel and then breaks out to continue. It looks like a flag on a pole.

🟢 THE PENNANT: A small, symmetrical triangle after the pole. The price concentrates in a narrow point as volatility decreases, and then breaks in the direction of the trend.

It looks like a pennant on a pole. $LSK

Both share the same story: a strong move, a brief consolidation, and then continuation.

They’re among the most reliable patterns. HOW TO TRADE WITH THE THREE LEVELS:

▪️
ENTRY: Enter when the price breaks the flag or pennant in the direction of the pole.

▪️STOP: Place the stop on the other side of the consolidation. A breakout to the inside means failure.

▪️TARGET: Measure the height of the pole and project it from the breakout point.

THE POLE RULE: Consolidation must be brief and shallow. If it retraces too much or lasts too long, the trend may be weakening rather than pausing.

DAY 13 KEY TAKEAWAYS $GRIFFAIN

▶️Both form after a sharp move from the pole.

▶️The flag is a rectangle; the pennant is a triangle.

▶️They signal continuation, not reversal

▶️The target is equal to the height of the pole. Next: Day 14 | Triangles


#StrategicTrading #FlagsAndPennant #ContinuationPattern #chartpatterns #candlestick_patterns
Palanca N Gigante
·
--
Bullish
COURSE ON MASTERING CHART PATTERNS: MODULE 2 COMPLETED | DAY 12 $RAY

REVIEW OF MODULE 2: Reversal Patterns Dominated Now you can identify reversals. Next, learn to ride the trend. 🚀

12 Days Completed | 48 Slides | 2/8 Modules ✅

THE FIVE REVERSALS: $ZEC

HEAD AND SHOULDERS (Day 7): Three peaks, the middle one higher. A break of the neckline confirms the top reversal. Inverted in bottoms.

DOUBLE TOP AND DOUBLE BOTTOM (Day 8): The M and W formations. Two failures at one level. A break of the middle level confirms it.

TRIPLE TOP AND TRIPLE BOTTOM (Day 9): Three tests at one level. Stronger than a double top. Trapped traders fuel the breakout.

ROUNDED TOP AND ROUNDED BOTTOM (Day 10): The saucer curve. A slow, steady shift in control over longer timeframes.

DIAMOND (Day 11): Price expands and then contracts. A rare but powerful top reversal.

THE REVERSAL RULES: $NAORIS

Every reversal shares these characteristics:

1️⃣ They occur after a clear trend, not in the middle of a range.
A break of a key level confirms the pattern. No break, no trade.
3️⃣ Volume should increase on the breakout to prove conviction.
4️⃣ The measured move provides a target: project the height of the pattern.

Master these four rules.

COURSE PROGRESS - 2/8 MODULES COMPLETED:
✅ Module 1: Fundamentals
✅ Module 2: Reversal Patterns
⬜ Module 3: Continuation Patterns
⬜ Module 4: Candlestick Patterns
⬜ Module 5: Harmonic Patterns
⬜ Module 6: Advanced Price Analysis (SMC)
⬜ Module 7: Trading the Patterns
⬜ Module 8: Mastery and Application

NEXT MODULE: CONTINUATION PATTERNS Flags and much more. Learn to ride the trend during its pauses instead of fearing them.

Next: Day 13 | Flags and Pennants ➡️


#StrategicTrading #ReversalPatterns #chartpatterns #TechnicalAnalysis #candlestick_patterns

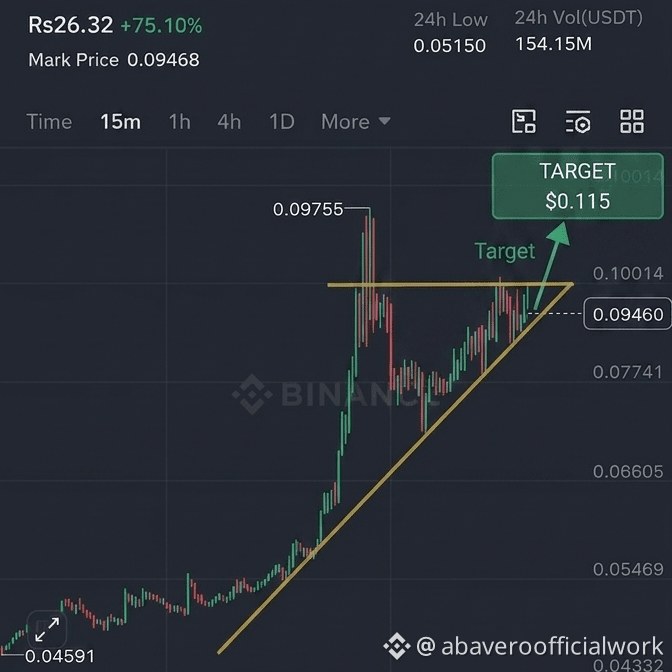
The $SYN chart is printing a powerful Symmetrical Triangle on the 15-minute timeframe right after its massive surge. It’s compressing toward a decisive breakout point! 🎯 Golden Setup: 🔹 Buy Zone: Ideal entry on a successful re-test of the lower support around $0.08800. 🔹 Bullish Target: A clean breakout pushes it to $0.11500+. 🔹 Invalidation: A decisive close below $0.08400 shifts sentiment. The risk-to-reward ratio for a long continuation is exceptionally high here. Manage your risk closely! #SYNUSDT #Synapse #ContinuationPattern #BreakoutAlert #BinanceSquareFamily {future}(SYNUSDT)
The $SYN chart is printing a powerful Symmetrical Triangle on the 15-minute timeframe right after its massive surge. It’s compressing toward a decisive breakout point!

🎯 Golden Setup:

🔹 Buy Zone: Ideal entry on a successful re-test of the lower support around $0.08800.

🔹 Bullish Target: A clean breakout pushes it to $0.11500+.

🔹 Invalidation: A decisive close below $0.08400 shifts sentiment.

The risk-to-reward ratio for a long continuation is exceptionally high here. Manage your risk closely!

#SYNUSDT #Synapse #ContinuationPattern #BreakoutAlert #BinanceSquareFamily
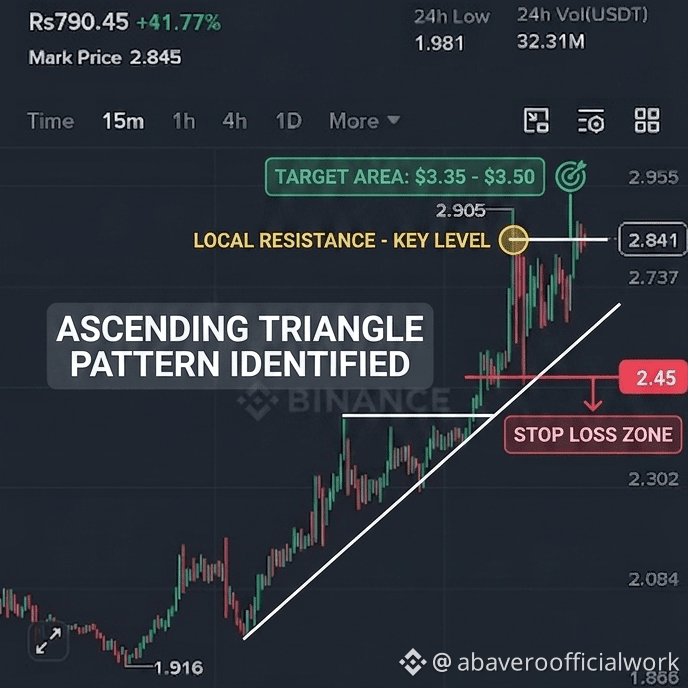
The $FOLKS chart is compressing heavily on the 15-minute timeframe after its explosive rally. It’s sitting right inside a massive Ascending Triangle, pointing toward a imminent continuation breakout or a quick liquidity sweep. 🎯 Golden Setup: 🔹 Buy Zone: Ideal entry on a successful re-test of the triangle's ascending support, around $2.550. 🔹 Bullish Target: A clean breakout will target $3.350+. 🔹 Stop Loss Zone: Maintain strict risk management with a close below $2.450. The risk-to-reward ratio here is incredibly high for a trend-continuation play. #FOLKSUSDT #FolksFinance #ContinuationPattern #BreakoutAlert #BinanceSquare {future}(FOLKSUSDT)
The $FOLKS chart is compressing heavily on the 15-minute timeframe after its explosive rally. It’s sitting right inside a massive Ascending Triangle, pointing toward a imminent continuation breakout or a quick liquidity sweep.

🎯 Golden Setup:

🔹 Buy Zone: Ideal entry on a successful re-test of the triangle's ascending support, around $2.550.

🔹 Bullish Target: A clean breakout will target $3.350+.

🔹 Stop Loss Zone: Maintain strict risk management with a close below $2.450.

The risk-to-reward ratio here is incredibly high for a trend-continuation play.

#FOLKSUSDT #FolksFinance #ContinuationPattern #BreakoutAlert #BinanceSquare
Log in to explore more content
Join global crypto users on Binance Square
⚡️ Get latest and useful information about crypto.
💬 Trusted by the world’s largest crypto exchange.
👍 Discover real insights from verified creators.
Email / Phone number