
#bollingerbands
bollingerbands
121,986 views
574 Discussing
Hot
Latest

·
--
$JELLYJELLY USDT — SHORT scenario (Bollinger)
After a sharp upward impulse, the price reached the 0.0395–0.0405 zone, where local resistance may form. On the 15M chart, the price is already stretched away from the Bollinger middle band, so I’m considering a SHORT only if a pullback is confirmed, not by chasing the move.
Scenario: rejection from the 0.0395–0.0405 zone, a close below 0.0385, and confirmation of weakness on the 15M chart.
🎯 TP1: 0.0380
🎯 TP2: 0.0370
🎯 TP3: 0.0361
❌ Invalidation: a close above 0.0405–0.0410
I won’t consider a SHORT without confirmation of a reversal. After an impulse like this, the price may continue squeezing higher, so entering blindly is dangerous.
#JellyJellyMurdabad #ShortSignal #Bollingerbands #CryptoTradingBots #BİNANCE
$JELLYJELLY USDT — SHORT scenario (Bollinger)
After a sharp upward impulse, the price reached the 0.0395–0.0405 zone, where local resistance may form. On the 15M chart, the price is already stretched away from the Bollinger middle band, so I’m considering a SHORT only if a pullback is confirmed, not by chasing the move.
Scenario: rejection from the 0.0395–0.0405 zone, a close below 0.0385, and confirmation of weakness on the 15M chart.
🎯 TP1: 0.0380
🎯 TP2: 0.0370
🎯 TP3: 0.0361
❌ Invalidation: a close above 0.0405–0.0410
I won’t consider a SHORT without confirmation of a reversal. After an impulse like this, the price may continue squeezing higher, so entering blindly is dangerous.
#JellyJellyMurdabad #ShortSignal #Bollingerbands #CryptoTradingBots #BİNANCE
After a sharp upward impulse, the price reached the 0.0395–0.0405 zone, where local resistance may form. On the 15M chart, the price is already stretched away from the Bollinger middle band, so I’m considering a SHORT only if a pullback is confirmed, not by chasing the move.
Scenario: rejection from the 0.0395–0.0405 zone, a close below 0.0385, and confirmation of weakness on the 15M chart.
🎯 TP1: 0.0380
🎯 TP2: 0.0370
🎯 TP3: 0.0361
❌ Invalidation: a close above 0.0405–0.0410
I won’t consider a SHORT without confirmation of a reversal. After an impulse like this, the price may continue squeezing higher, so entering blindly is dangerous.
#JellyJellyMurdabad #ShortSignal #Bollingerbands #CryptoTradingBots #BİNANCE
1
5
138

·
--
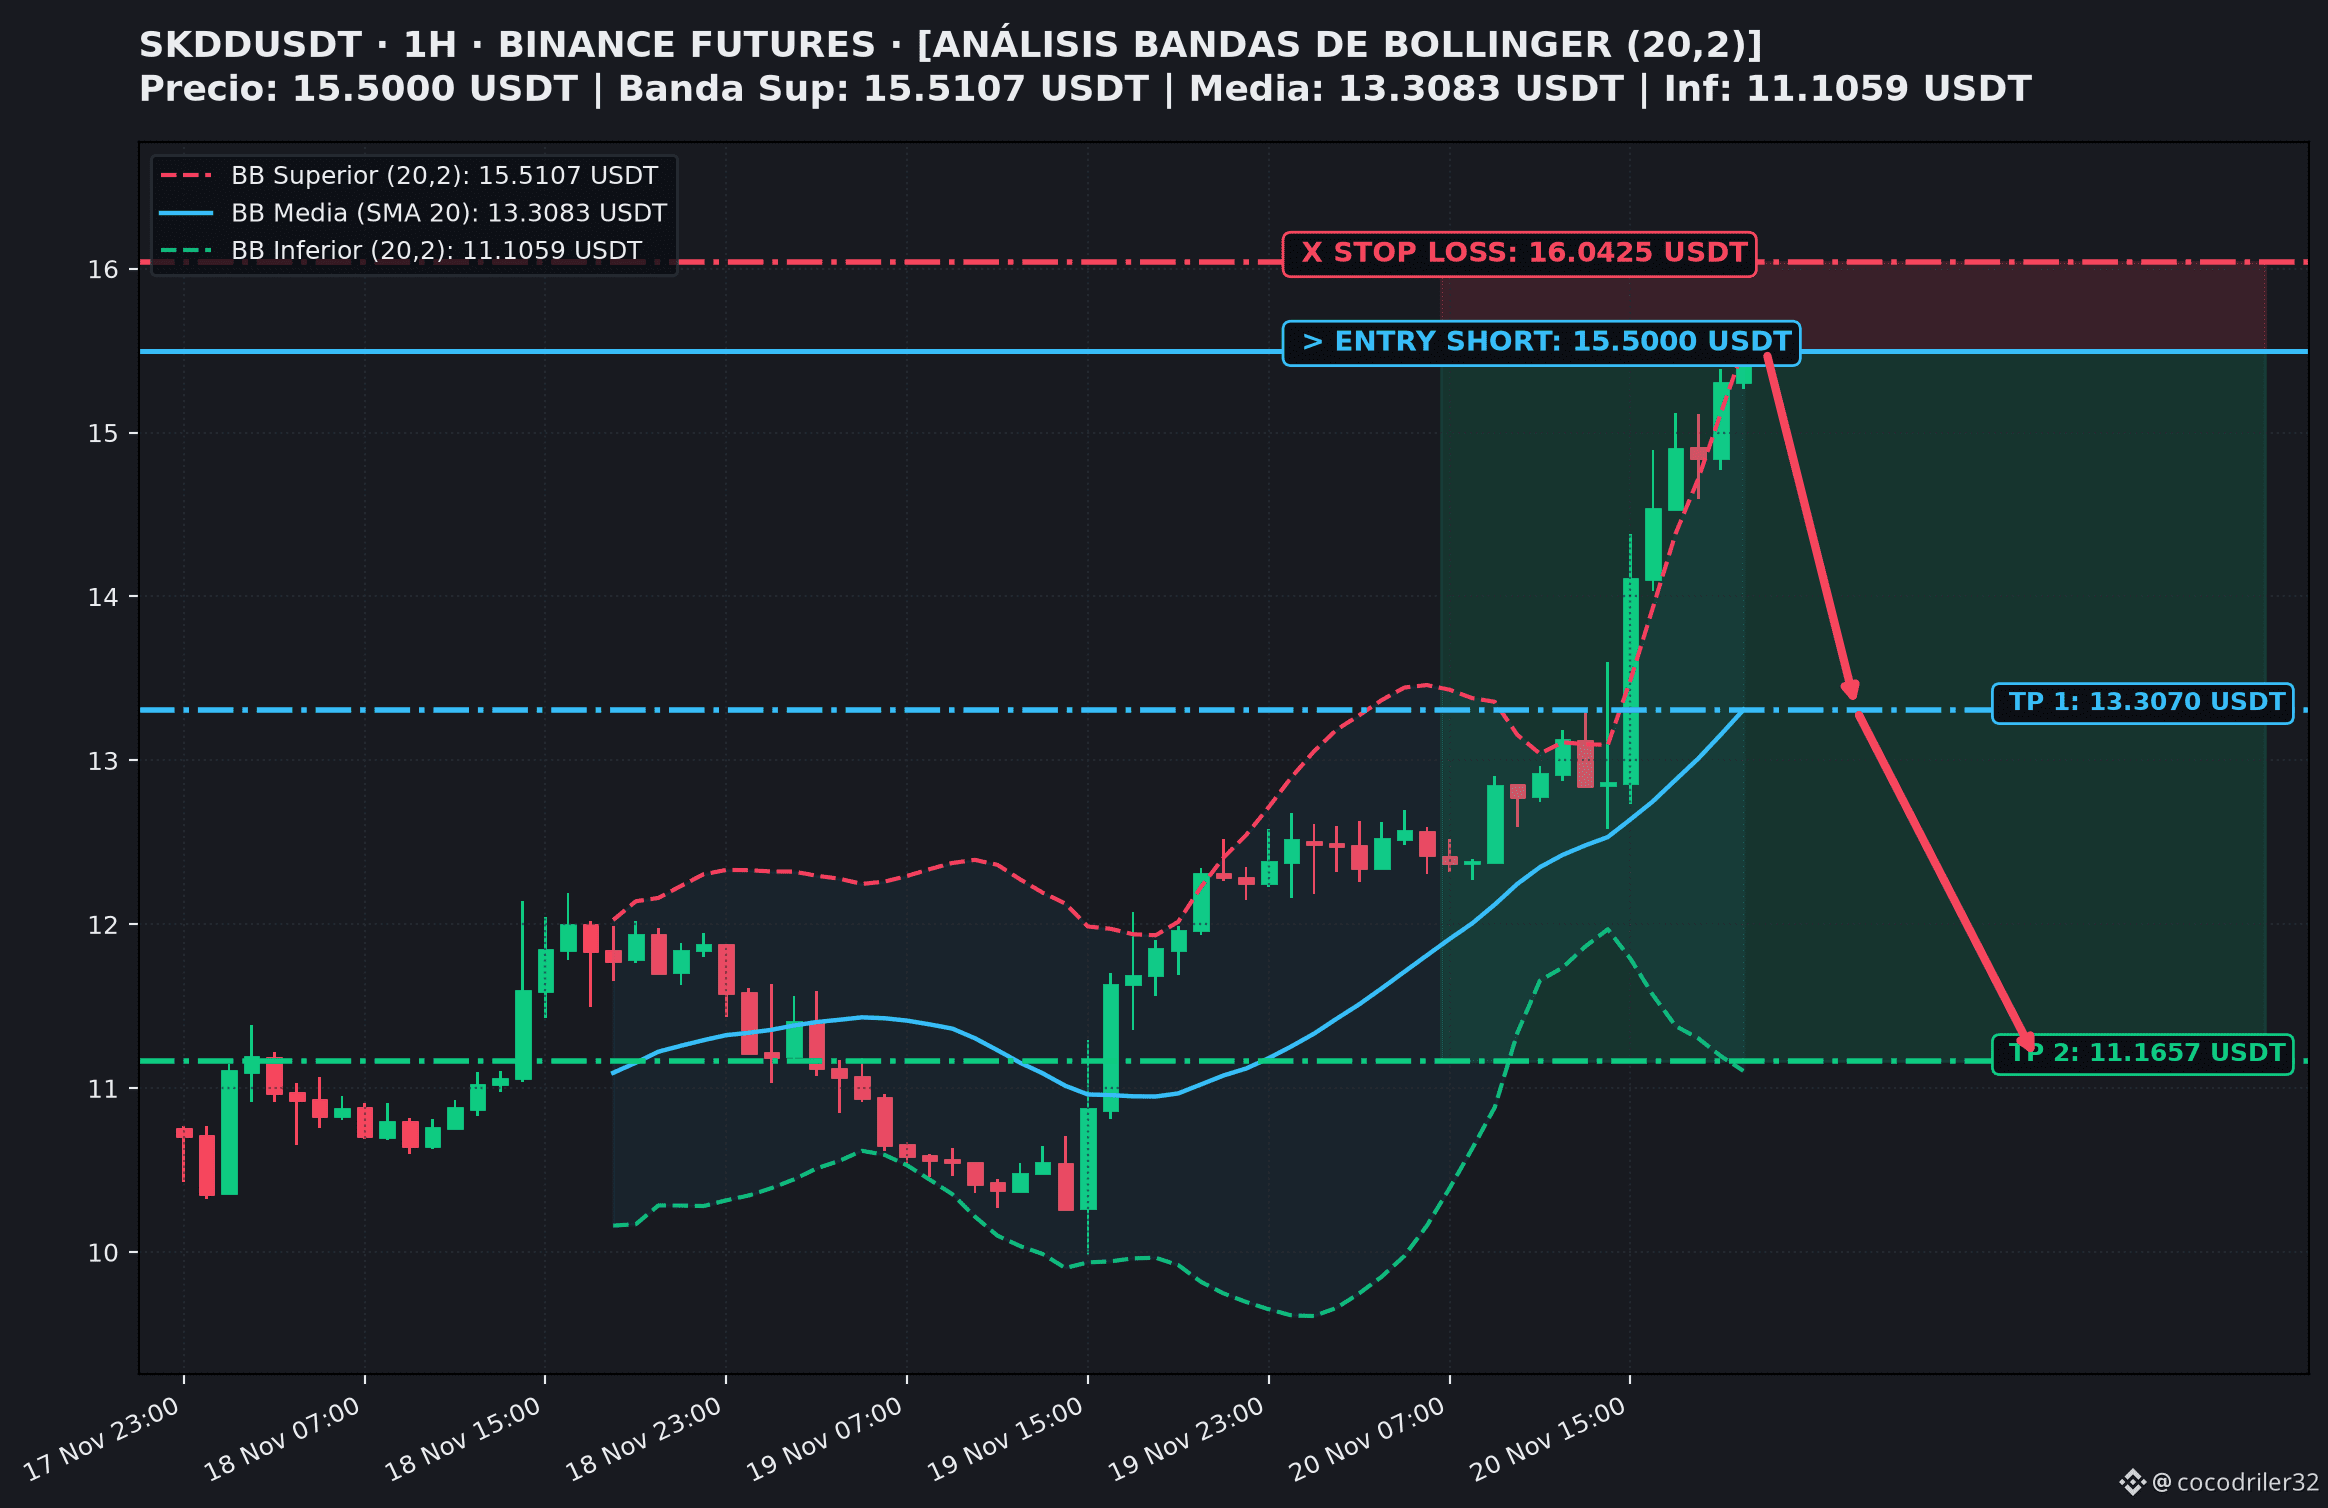
ANALYSIS $SKDD (1H): Technical Overextension (+28.07%) and Short Setup 📉⚡
The SKDDUSDT pair (Binance Futures) has recorded a sharp vertical move, with a 24-hour change of +28.07% and a market cap below < 130M (Low-Cap). Price action is at 101.4% of the Bollinger Bands range, with the 1H RSI at 85.1 points. The derivatives map shows a Long/Short ratio of 0.41 and a funding rate of -0.1412%, reflecting a saturation of bullish positions that are prone to a correction.
📌 Key Setup Points (Short / Mean Reversion):
🎯 Entry Point: 15.5000 USDT (confirmation of exhaustion in the upper zone)
🛑 Stop Loss: 16.0425 USDT (generous and protected, placed above the recent sweep wicks)
💰 Target 1 (TP1): 13.3070 USDT (reversion toward the Middle Band / SMA 20)
🚀 Target 2 (TP2): 11.1657 USDT (corrective extension toward structural support)
⚖️ R:R Ratio: 1:4.04 at TP1 | 1:7.99 at TP2 (defensive partial profit-taking)
🧠 Technical Rationale and Risk Management:
- Exhaustion and Selling Pressure: The stretch above the moving average suggests institutional absorption of late buyers.
- Anti-Hunt Stop Loss: Placed at 16.0425 USDT with an extra safety margin to withstand volatility spikes before the pullback.
- Trading Plan: Secure profits upon reaching TP1 (13.3070 USDT) and move the Stop Loss to the entry price (Breakeven).
👉 Do you trade technical pullbacks after vertical rallies in altcoins? Follow us for more daily quantitative analysis!
👇 Do you think SKDD will correct toward TP1 or seek a new high? Let us know your opinion in the comments!
#BinanceSquare #CryptoTrading #BollingerBands #FuturesTrading $BTC $SKDD
ANALYSIS $SKDD (1H): Technical Overextension (+28.07%) and Short Setup 📉⚡
The SKDDUSDT pair (Binance Futures) has recorded a sharp vertical move, with a 24-hour change of +28.07% and a market cap below < 130M (Low-Cap). Price action is at 101.4% of the Bollinger Bands range, with the 1H RSI at 85.1 points. The derivatives map shows a Long/Short ratio of 0.41 and a funding rate of -0.1412%, reflecting a saturation of bullish positions that are prone to a correction.
📌 Key Setup Points (Short / Mean Reversion):
🎯 Entry Point: 15.5000 USDT (confirmation of exhaustion in the upper zone)
🛑 Stop Loss: 16.0425 USDT (generous and protected, placed above the recent sweep wicks)
💰 Target 1 (TP1): 13.3070 USDT (reversion toward the Middle Band / SMA 20)
🚀 Target 2 (TP2): 11.1657 USDT (corrective extension toward structural support)
⚖️ R:R Ratio: 1:4.04 at TP1 | 1:7.99 at TP2 (defensive partial profit-taking)
🧠 Technical Rationale and Risk Management:
- Exhaustion and Selling Pressure: The stretch above the moving average suggests institutional absorption of late buyers.
- Anti-Hunt Stop Loss: Placed at 16.0425 USDT with an extra safety margin to withstand volatility spikes before the pullback.
- Trading Plan: Secure profits upon reaching TP1 (13.3070 USDT) and move the Stop Loss to the entry price (Breakeven).
👉 Do you trade technical pullbacks after vertical rallies in altcoins? Follow us for more daily quantitative analysis!
👇 Do you think SKDD will correct toward TP1 or seek a new high? Let us know your opinion in the comments!
#BinanceSquare #CryptoTrading #BollingerBands #FuturesTrading $BTC $SKDD
The SKDDUSDT pair (Binance Futures) has recorded a sharp vertical move, with a 24-hour change of +28.07% and a market cap below < 130M (Low-Cap). Price action is at 101.4% of the Bollinger Bands range, with the 1H RSI at 85.1 points. The derivatives map shows a Long/Short ratio of 0.41 and a funding rate of -0.1412%, reflecting a saturation of bullish positions that are prone to a correction.
📌 Key Setup Points (Short / Mean Reversion):
🎯 Entry Point: 15.5000 USDT (confirmation of exhaustion in the upper zone)
🛑 Stop Loss: 16.0425 USDT (generous and protected, placed above the recent sweep wicks)
💰 Target 1 (TP1): 13.3070 USDT (reversion toward the Middle Band / SMA 20)
🚀 Target 2 (TP2): 11.1657 USDT (corrective extension toward structural support)
⚖️ R:R Ratio: 1:4.04 at TP1 | 1:7.99 at TP2 (defensive partial profit-taking)
🧠 Technical Rationale and Risk Management:
- Exhaustion and Selling Pressure: The stretch above the moving average suggests institutional absorption of late buyers.
- Anti-Hunt Stop Loss: Placed at 16.0425 USDT with an extra safety margin to withstand volatility spikes before the pullback.
- Trading Plan: Secure profits upon reaching TP1 (13.3070 USDT) and move the Stop Loss to the entry price (Breakeven).
👉 Do you trade technical pullbacks after vertical rallies in altcoins? Follow us for more daily quantitative analysis!
👇 Do you think SKDD will correct toward TP1 or seek a new high? Let us know your opinion in the comments!
#BinanceSquare #CryptoTrading #BollingerBands #FuturesTrading $BTC $SKDD
2
175
·
--
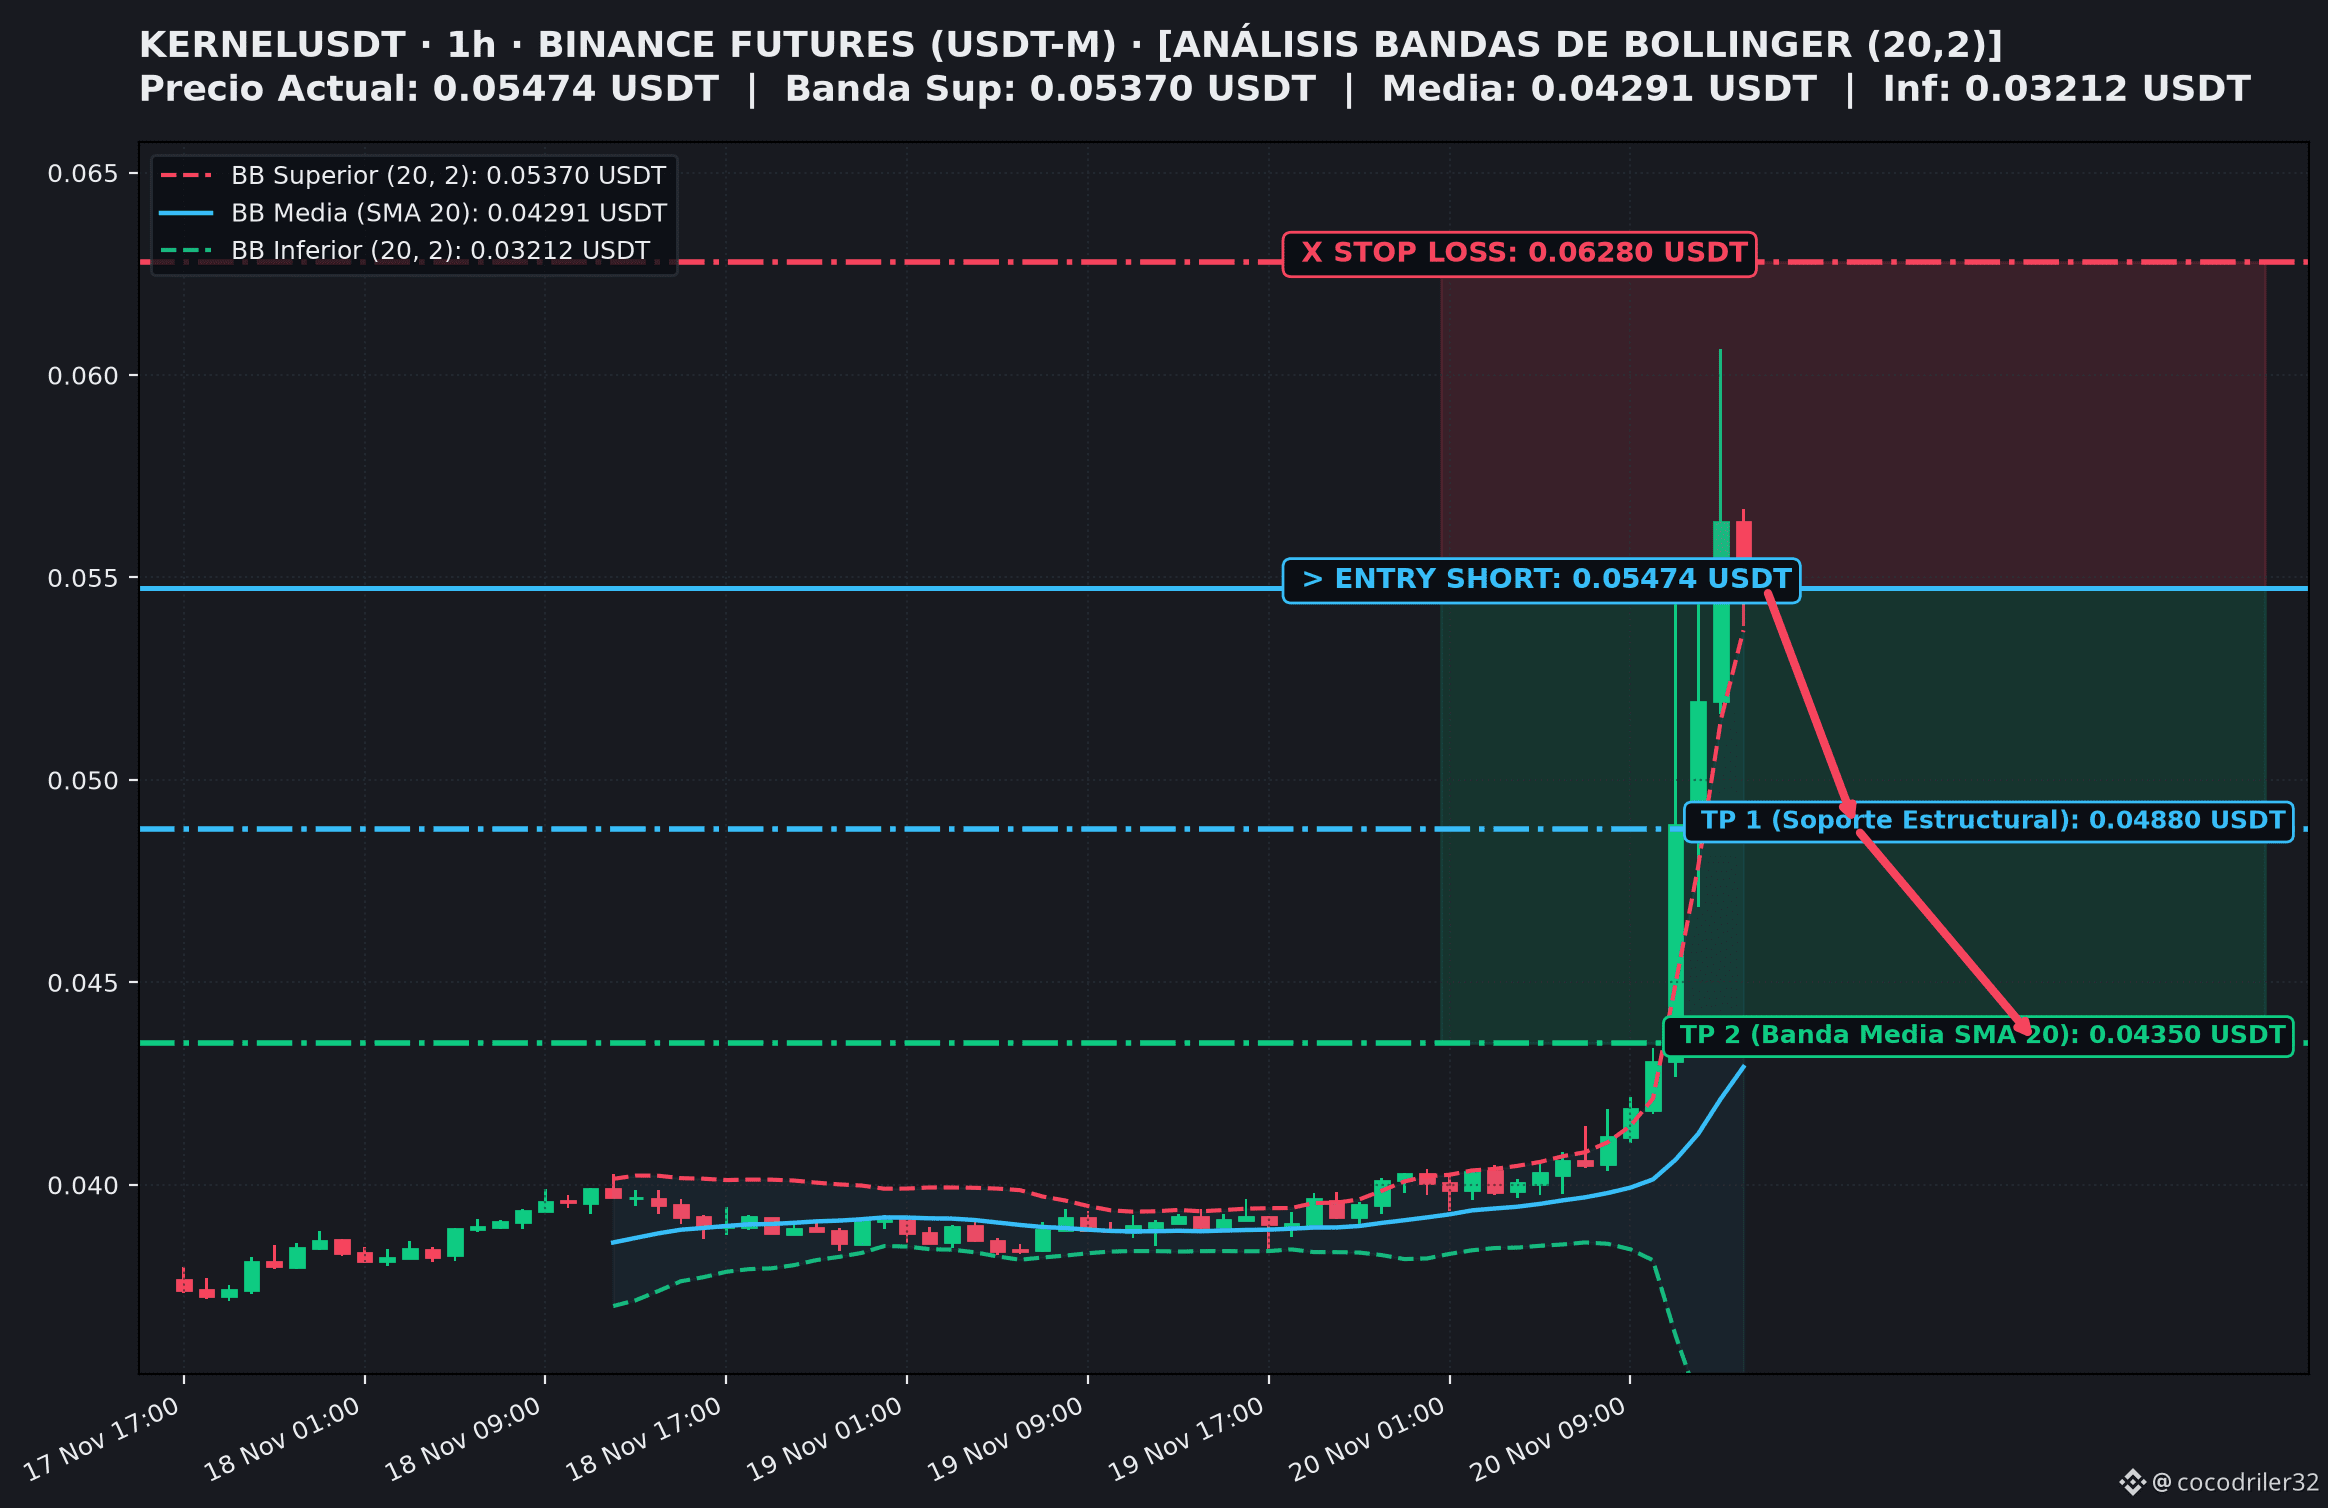
ANALYSIS $KERNEL (1H): Parabolic Expansion (+50%) and Exhaustion Short Setup 📉⚡
The KERNELUSDT pair (Binance Futures) has experienced an explosive vertical rally of over 50% in the past few hours, breaking out of its consolidation at 0.0400 USDT and reaching a peak of 0.06065 USDT on record volume. After stretching above the Upper Bollinger Band (0.05370 USDT) and pushing the 1H RSI above 94, the price has left a strong rejection wick at the highs, and the current candle confirms institutional profit-taking, opening up a high-probability mean-reversion setup.
📌 Key Setup Points (Short / Reversal After Euphoria):
🎯 Entry Point: 0.05474 USDT (confirmation of bearish rejection after piercing the upper band)
🛑 Stop Loss: 0.06280 USDT (wide and protected, placed well above the 0.06065 USDT wick high to shield the trade from extreme volatility)
💰 Target 1 (TP1): 0.04880 USDT (structural support / previous breakout closing level)
🚀 Target 2 (TP2): 0.04350 USDT (reversal toward the Middle Band / SMA 20)
⚖️ R:R Ratio: 1:0.74 at TP1 | 1:1.39 at TP2 (conservative approach with an early partial take-profit)
🧠 Technical Rationale and Risk Management:
- Rejection at the Highs on Climax Volume: The upper wick at 0.06065 USDT signals that strong hands absorbed late buyers.
- Wide Anti-Wick Stop Loss: Set at 0.06280 USDT to prevent secondary sweep wicks from closing the position before the corrective pullback toward the SMA 20.
- Trading Plan: Secure partial profits at TP1 (0.04880 USDT) and immediately move the Stop Loss to the entry price (Breakeven).
👉 Do you trade pullbacks in highly volatile tokens after vertical rallies? Follow us for more daily setups on Binance Square!
👇 Do you think KERNEL will fall straight to 0.0435 USDT or retest 0.060 USDT first? Leave us a comment!
#BinanceSquare #CryptoTrading #BollingerBands #FuturesTrading $BTC $KERNEL
ANALYSIS $KERNEL (1H): Parabolic Expansion (+50%) and Exhaustion Short Setup 📉⚡
The KERNELUSDT pair (Binance Futures) has experienced an explosive vertical rally of over 50% in the past few hours, breaking out of its consolidation at 0.0400 USDT and reaching a peak of 0.06065 USDT on record volume. After stretching above the Upper Bollinger Band (0.05370 USDT) and pushing the 1H RSI above 94, the price has left a strong rejection wick at the highs, and the current candle confirms institutional profit-taking, opening up a high-probability mean-reversion setup.
📌 Key Setup Points (Short / Reversal After Euphoria):
🎯 Entry Point: 0.05474 USDT (confirmation of bearish rejection after piercing the upper band)
🛑 Stop Loss: 0.06280 USDT (wide and protected, placed well above the 0.06065 USDT wick high to shield the trade from extreme volatility)
💰 Target 1 (TP1): 0.04880 USDT (structural support / previous breakout closing level)
🚀 Target 2 (TP2): 0.04350 USDT (reversal toward the Middle Band / SMA 20)
⚖️ R:R Ratio: 1:0.74 at TP1 | 1:1.39 at TP2 (conservative approach with an early partial take-profit)
🧠 Technical Rationale and Risk Management:
- Rejection at the Highs on Climax Volume: The upper wick at 0.06065 USDT signals that strong hands absorbed late buyers.
- Wide Anti-Wick Stop Loss: Set at 0.06280 USDT to prevent secondary sweep wicks from closing the position before the corrective pullback toward the SMA 20.
- Trading Plan: Secure partial profits at TP1 (0.04880 USDT) and immediately move the Stop Loss to the entry price (Breakeven).
👉 Do you trade pullbacks in highly volatile tokens after vertical rallies? Follow us for more daily setups on Binance Square!
👇 Do you think KERNEL will fall straight to 0.0435 USDT or retest 0.060 USDT first? Leave us a comment!
#BinanceSquare #CryptoTrading #BollingerBands #FuturesTrading $BTC $KERNEL
The KERNELUSDT pair (Binance Futures) has experienced an explosive vertical rally of over 50% in the past few hours, breaking out of its consolidation at 0.0400 USDT and reaching a peak of 0.06065 USDT on record volume. After stretching above the Upper Bollinger Band (0.05370 USDT) and pushing the 1H RSI above 94, the price has left a strong rejection wick at the highs, and the current candle confirms institutional profit-taking, opening up a high-probability mean-reversion setup.
📌 Key Setup Points (Short / Reversal After Euphoria):
🎯 Entry Point: 0.05474 USDT (confirmation of bearish rejection after piercing the upper band)
🛑 Stop Loss: 0.06280 USDT (wide and protected, placed well above the 0.06065 USDT wick high to shield the trade from extreme volatility)
💰 Target 1 (TP1): 0.04880 USDT (structural support / previous breakout closing level)
🚀 Target 2 (TP2): 0.04350 USDT (reversal toward the Middle Band / SMA 20)
⚖️ R:R Ratio: 1:0.74 at TP1 | 1:1.39 at TP2 (conservative approach with an early partial take-profit)
🧠 Technical Rationale and Risk Management:
- Rejection at the Highs on Climax Volume: The upper wick at 0.06065 USDT signals that strong hands absorbed late buyers.
- Wide Anti-Wick Stop Loss: Set at 0.06280 USDT to prevent secondary sweep wicks from closing the position before the corrective pullback toward the SMA 20.
- Trading Plan: Secure partial profits at TP1 (0.04880 USDT) and immediately move the Stop Loss to the entry price (Breakeven).
👉 Do you trade pullbacks in highly volatile tokens after vertical rallies? Follow us for more daily setups on Binance Square!
👇 Do you think KERNEL will fall straight to 0.0435 USDT or retest 0.060 USDT first? Leave us a comment!
#BinanceSquare #CryptoTrading #BollingerBands #FuturesTrading $BTC $KERNEL
2
140
·
--
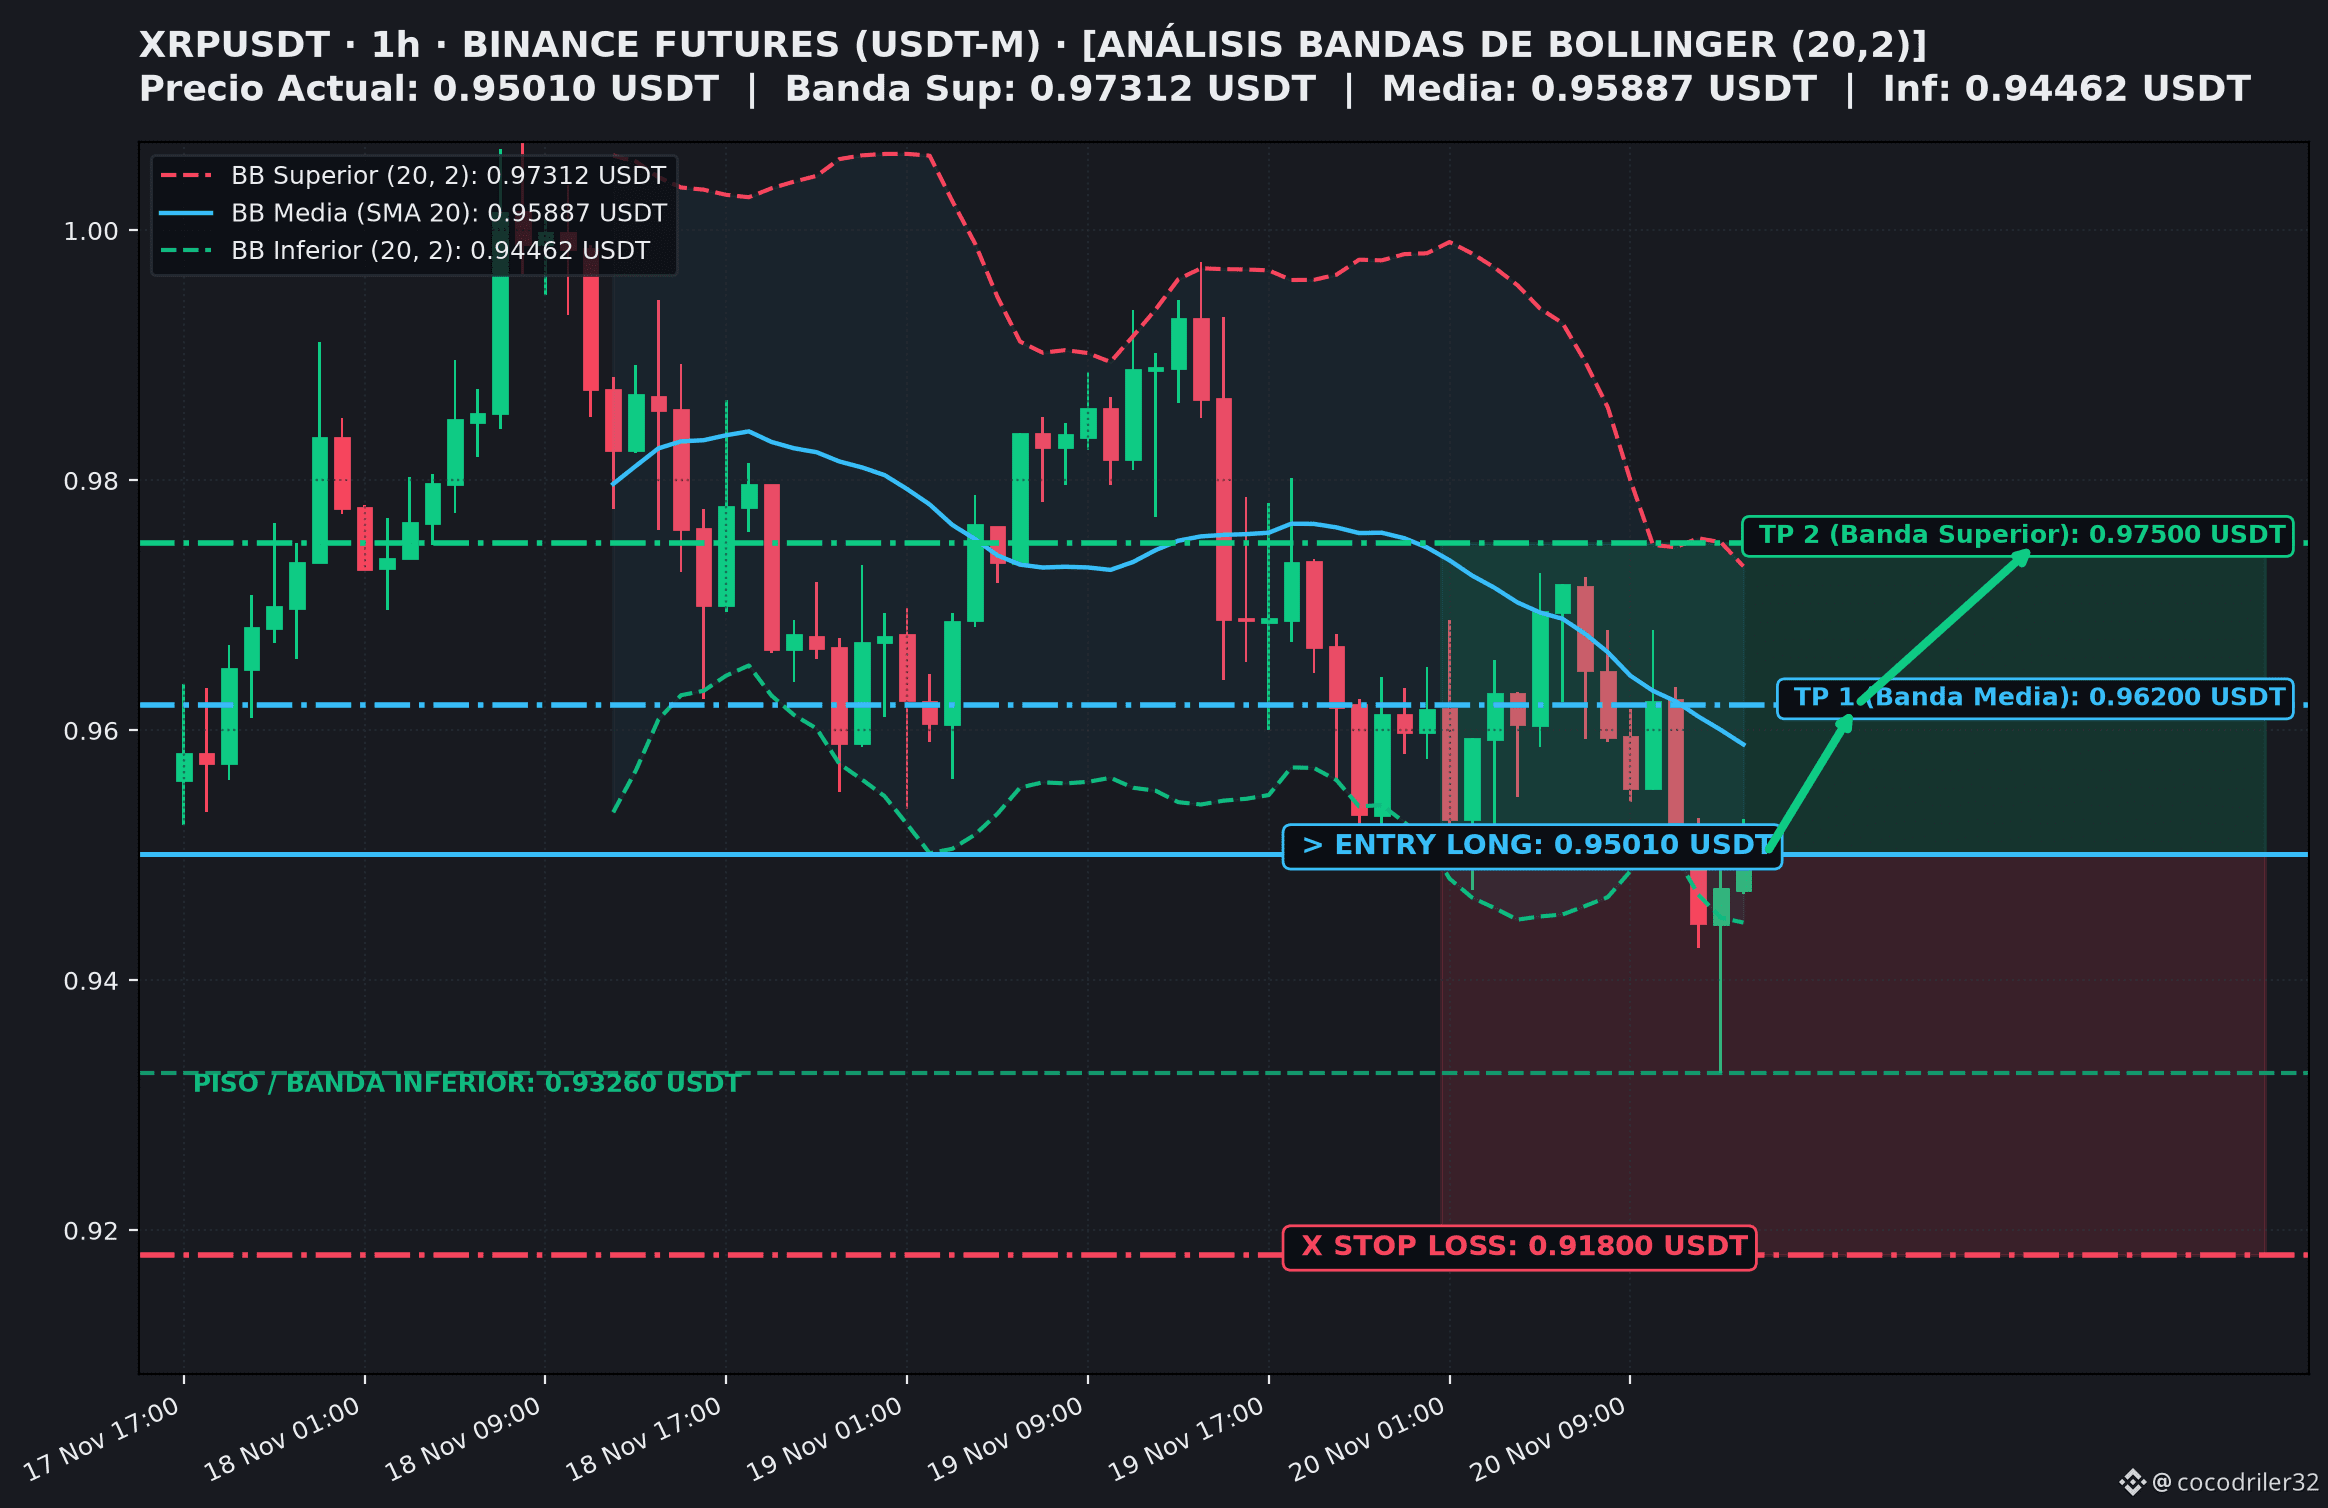
ANALYSIS $XRP (1H): Lower Band Liquidity Sweep and Long Setup 📈⚡
The XRPUSDT pair (Binance Futures) made an aggressive capitulation wick down to 0.93260 USDT, temporarily piercing the lower Bollinger Band (0.94462 USDT) to hunt for residual liquidity. Buyers responded immediately, closing the candle with a clear hammer pattern and institutional absorption on volume of more than 63M, while the current candle confirms a bullish re-entry toward the dynamic Bollinger channel.
📌 Setup Key Points (Long / Bounce After Sweep):
🎯 Entry Point: 0.95010 USDT (confirmation of recovery above the lower band)
🛑 Stop Loss: 0.91800 USDT (with ample room and protection, placed well below the sweep low of 0.93260 USDT and the 0.92000 USDT zone)
💰 Target 1 (TP1): 0.96200 USDT (reversal toward the Middle Band / SMA 20)
🚀 Target 2 (TP2): 0.97500 USDT (bullish expansion toward the Upper Bollinger Band)
⚖️ R:R Ratio: 1:0.37 at TP1 | 1:0.78 at TP2 (defensive approach prioritizing partial profit-taking)
🧠 Technical Rationale and Risk Management:
- Climax Absorption at Support: The strong rejection at 0.9326 USDT following the volume spike signals a classic bear trap before mean reversion.
- Anti-Wick Stop Loss: Set at 0.91800 USDT, with more than 1.4 cents of clearance below the extreme wick to protect the position against any manipulative retest.
- Trading Plan: Take partial profits when TP1 (0.96200 USDT) is reached and immediately move the Stop Loss to the entry price (Breakeven).
👉 Do you trade support bounces after liquidity sweeps on XRP? Follow us for more daily technical analysis on Binance Square!
👇 Do you think XRP will try to reclaim the dollar (1.00 USDT) in this move, or will it continue consolidating? Share your opinion!
#BinanceSquare #CryptoTrading #BollingerBands #FuturesTrading $BTC $XRP
ANALYSIS $XRP (1H): Lower Band Liquidity Sweep and Long Setup 📈⚡
The XRPUSDT pair (Binance Futures) made an aggressive capitulation wick down to 0.93260 USDT, temporarily piercing the lower Bollinger Band (0.94462 USDT) to hunt for residual liquidity. Buyers responded immediately, closing the candle with a clear hammer pattern and institutional absorption on volume of more than 63M, while the current candle confirms a bullish re-entry toward the dynamic Bollinger channel.
📌 Setup Key Points (Long / Bounce After Sweep):
🎯 Entry Point: 0.95010 USDT (confirmation of recovery above the lower band)
🛑 Stop Loss: 0.91800 USDT (with ample room and protection, placed well below the sweep low of 0.93260 USDT and the 0.92000 USDT zone)
💰 Target 1 (TP1): 0.96200 USDT (reversal toward the Middle Band / SMA 20)
🚀 Target 2 (TP2): 0.97500 USDT (bullish expansion toward the Upper Bollinger Band)
⚖️ R:R Ratio: 1:0.37 at TP1 | 1:0.78 at TP2 (defensive approach prioritizing partial profit-taking)
🧠 Technical Rationale and Risk Management:
- Climax Absorption at Support: The strong rejection at 0.9326 USDT following the volume spike signals a classic bear trap before mean reversion.
- Anti-Wick Stop Loss: Set at 0.91800 USDT, with more than 1.4 cents of clearance below the extreme wick to protect the position against any manipulative retest.
- Trading Plan: Take partial profits when TP1 (0.96200 USDT) is reached and immediately move the Stop Loss to the entry price (Breakeven).
👉 Do you trade support bounces after liquidity sweeps on XRP? Follow us for more daily technical analysis on Binance Square!
👇 Do you think XRP will try to reclaim the dollar (1.00 USDT) in this move, or will it continue consolidating? Share your opinion!
#BinanceSquare #CryptoTrading #BollingerBands #FuturesTrading $BTC $XRP
The XRPUSDT pair (Binance Futures) made an aggressive capitulation wick down to 0.93260 USDT, temporarily piercing the lower Bollinger Band (0.94462 USDT) to hunt for residual liquidity. Buyers responded immediately, closing the candle with a clear hammer pattern and institutional absorption on volume of more than 63M, while the current candle confirms a bullish re-entry toward the dynamic Bollinger channel.
📌 Setup Key Points (Long / Bounce After Sweep):
🎯 Entry Point: 0.95010 USDT (confirmation of recovery above the lower band)
🛑 Stop Loss: 0.91800 USDT (with ample room and protection, placed well below the sweep low of 0.93260 USDT and the 0.92000 USDT zone)
💰 Target 1 (TP1): 0.96200 USDT (reversal toward the Middle Band / SMA 20)
🚀 Target 2 (TP2): 0.97500 USDT (bullish expansion toward the Upper Bollinger Band)
⚖️ R:R Ratio: 1:0.37 at TP1 | 1:0.78 at TP2 (defensive approach prioritizing partial profit-taking)
🧠 Technical Rationale and Risk Management:
- Climax Absorption at Support: The strong rejection at 0.9326 USDT following the volume spike signals a classic bear trap before mean reversion.
- Anti-Wick Stop Loss: Set at 0.91800 USDT, with more than 1.4 cents of clearance below the extreme wick to protect the position against any manipulative retest.
- Trading Plan: Take partial profits when TP1 (0.96200 USDT) is reached and immediately move the Stop Loss to the entry price (Breakeven).
👉 Do you trade support bounces after liquidity sweeps on XRP? Follow us for more daily technical analysis on Binance Square!
👇 Do you think XRP will try to reclaim the dollar (1.00 USDT) in this move, or will it continue consolidating? Share your opinion!
#BinanceSquare #CryptoTrading #BollingerBands #FuturesTrading $BTC $XRP
1
1
109
·
--
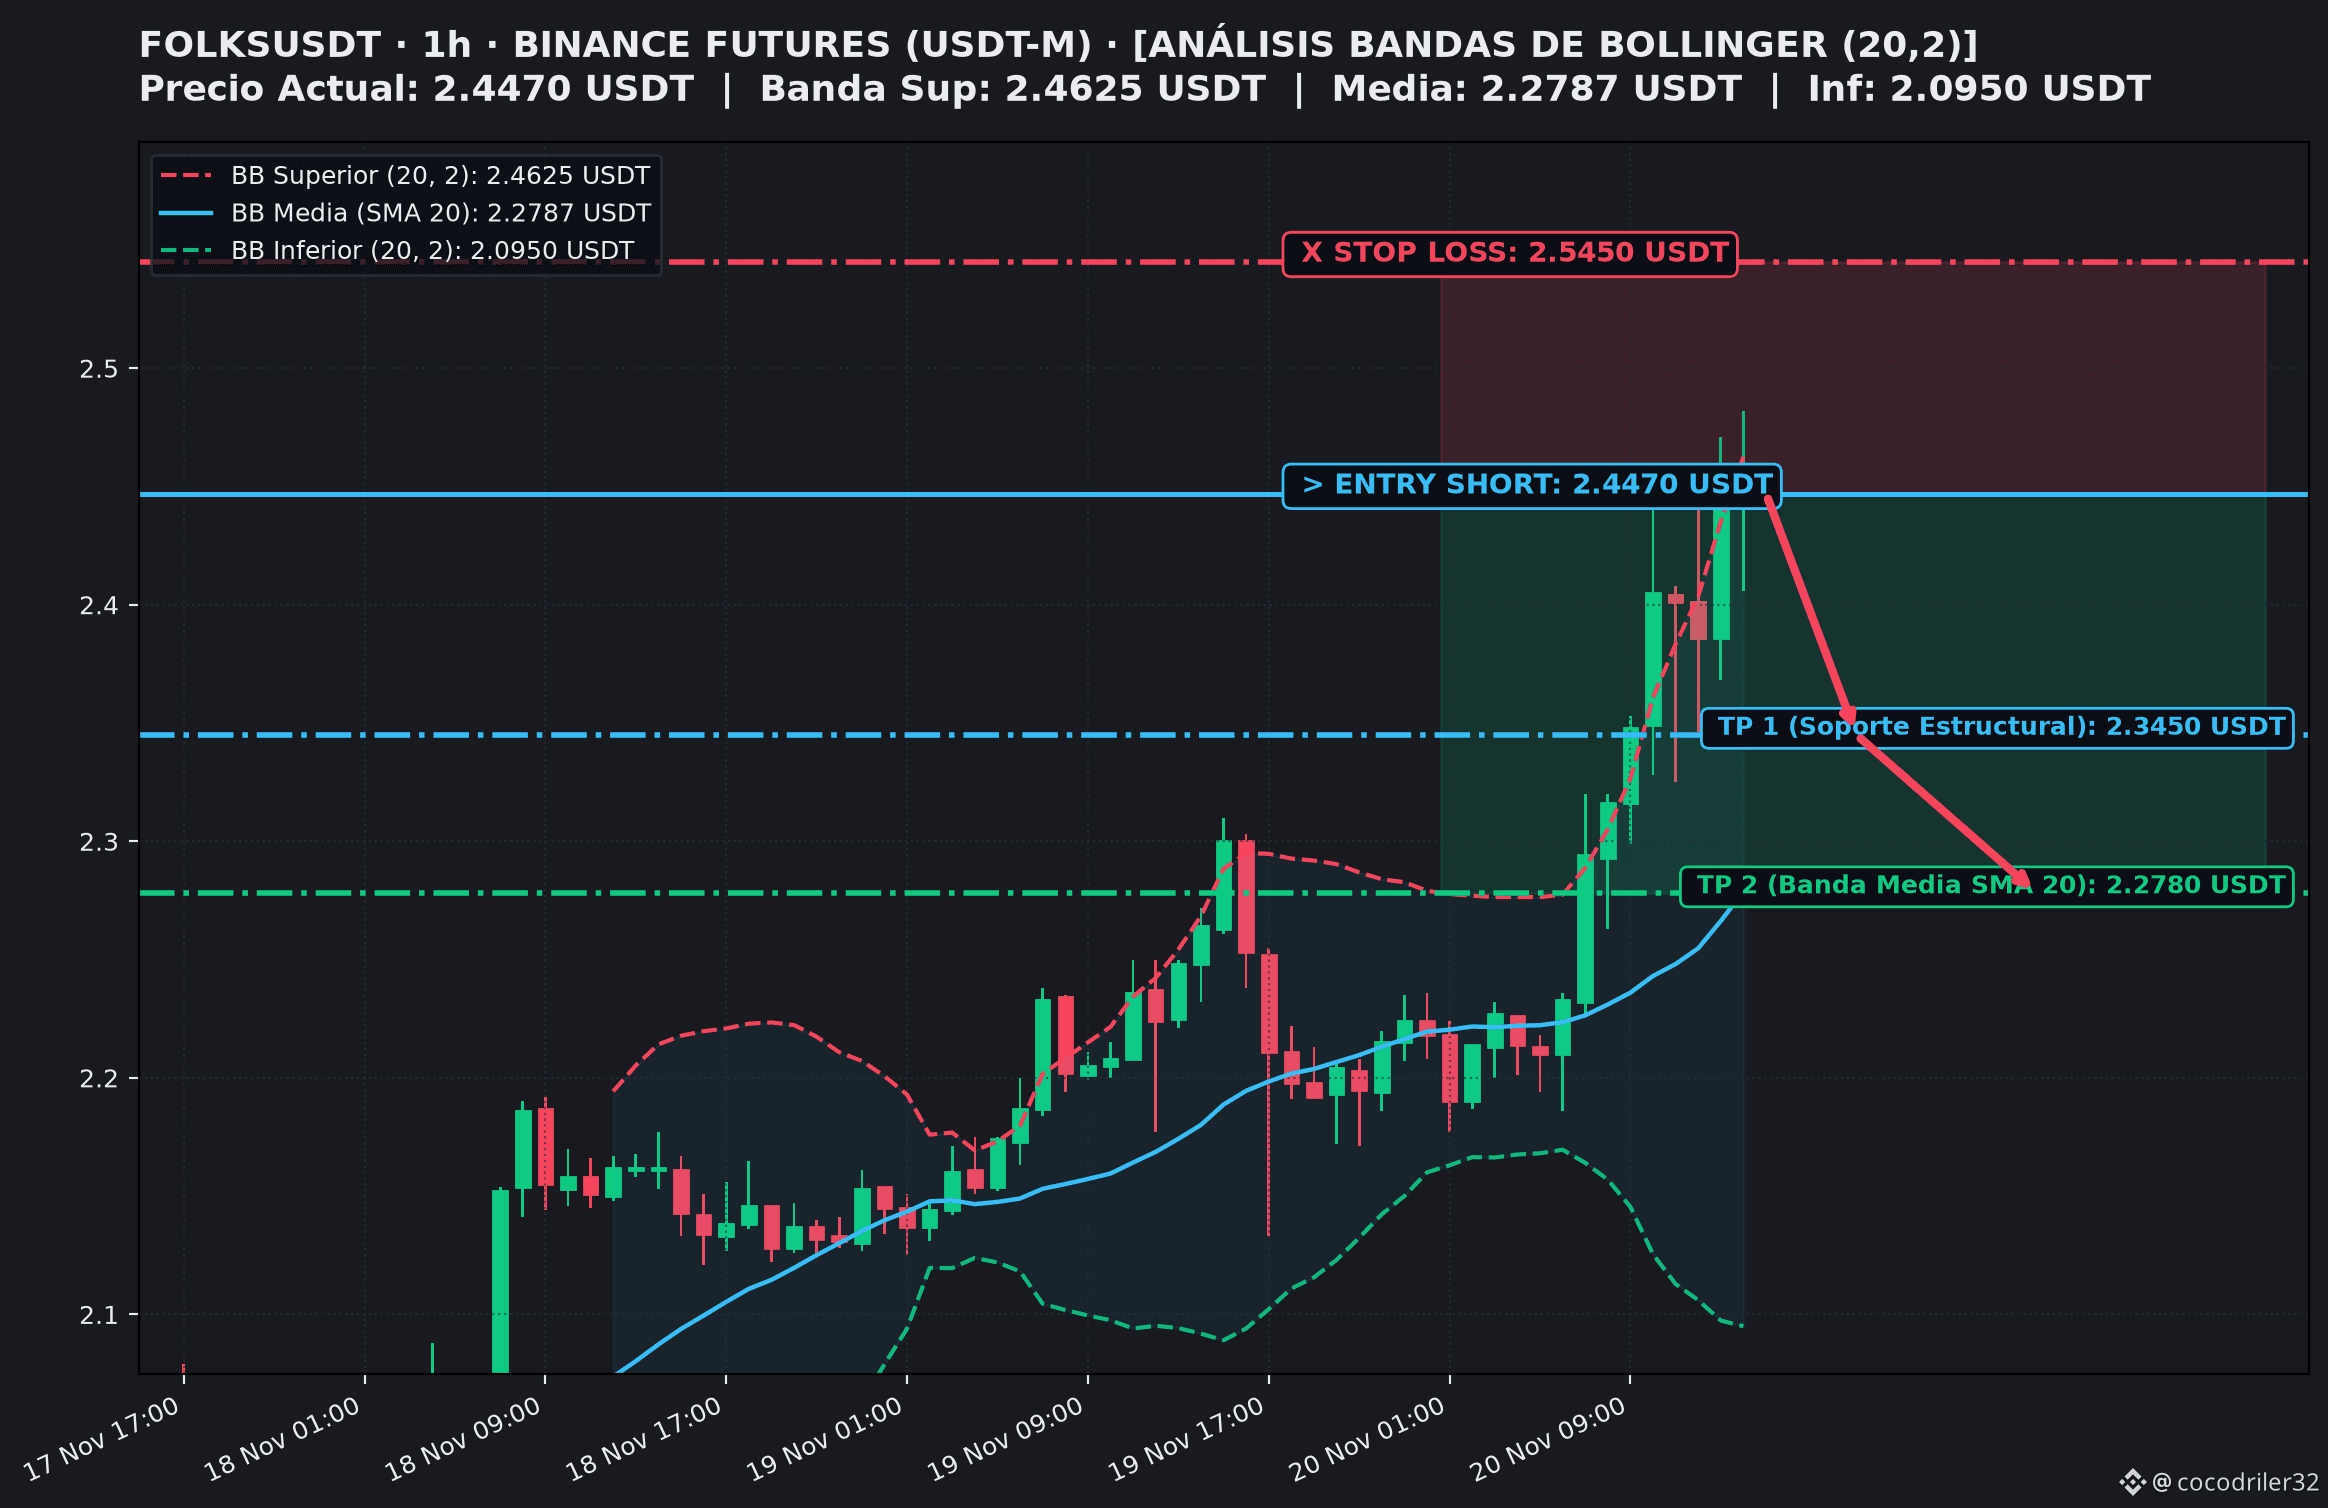
ANALYSIS $FOLKS (1H): Distribution Ceiling at the Upper Band and Short Setup 📉⚡
The FOLKSUSDT pair (Binance Futures) has reached a critical resistance zone after a bullish impulse drove the price to repeatedly test the Upper Bollinger Band (2.4625 USDT). For the last 5 consecutive hours, the price has left multiple rejection wicks between 2.4500 and 2.4820 USDT, with noticeably declining volume and the 1H RSI above 81, signaling clear exhaustion in buying momentum and an imminent reversion to the mean.
📌 Key Setup Points (Short / Reversal at the Top):
🎯 Entry Point: 2.4470 USDT (continued rejection at the Upper Bollinger Band)
🛑 Stop Loss: 2.5450 USDT (generous and protected, strategically placed above the local high of 2.4820 USDT and the psychological barrier at 2.5000 USDT)
💰 Target 1 (TP1): 2.3450 USDT (structural support and the base of the consolidation range)
🚀 Target 2 (TP2): 2.2780 USDT (reversion toward the Middle Band / SMA 20)
⚖️ R:R Ratio: 1:1.04 at TP1 | 1:1.72 at TP2
🧠 Technical Rationale and Risk Management:
- Multiple-Wick Ceiling: Bulls have repeatedly failed to close candles above 2.45 USDT, indicating passive absorption and volume divergence.
- Wide Stop Loss to Avoid Stop Hunts: Set at 2.5450 USDT, with nearly 10 cents of buffer above the peak to avoid liquidations from hunting wicks before the correction.
- Trading Plan: Take partial profits upon reaching TP1 (2.3450 USDT) and immediately move the Stop Loss to the entry price (Breakeven).
👉 Do you follow price action in assets showing divergence and wick-based ceilings? Follow us for more daily technical analysis on Binance Square!
👇 Do you think FOLKS will correct down to the SMA 20 at 2.278 USDT, or will it try to break 2.50 USDT? Comment below!
#BinanceSquare #CryptoTrading #BollingerBands #FuturesTrading $BTC $FOLKS
ANALYSIS $FOLKS (1H): Distribution Ceiling at the Upper Band and Short Setup 📉⚡
The FOLKSUSDT pair (Binance Futures) has reached a critical resistance zone after a bullish impulse drove the price to repeatedly test the Upper Bollinger Band (2.4625 USDT). For the last 5 consecutive hours, the price has left multiple rejection wicks between 2.4500 and 2.4820 USDT, with noticeably declining volume and the 1H RSI above 81, signaling clear exhaustion in buying momentum and an imminent reversion to the mean.
📌 Key Setup Points (Short / Reversal at the Top):
🎯 Entry Point: 2.4470 USDT (continued rejection at the Upper Bollinger Band)
🛑 Stop Loss: 2.5450 USDT (generous and protected, strategically placed above the local high of 2.4820 USDT and the psychological barrier at 2.5000 USDT)
💰 Target 1 (TP1): 2.3450 USDT (structural support and the base of the consolidation range)
🚀 Target 2 (TP2): 2.2780 USDT (reversion toward the Middle Band / SMA 20)
⚖️ R:R Ratio: 1:1.04 at TP1 | 1:1.72 at TP2
🧠 Technical Rationale and Risk Management:
- Multiple-Wick Ceiling: Bulls have repeatedly failed to close candles above 2.45 USDT, indicating passive absorption and volume divergence.
- Wide Stop Loss to Avoid Stop Hunts: Set at 2.5450 USDT, with nearly 10 cents of buffer above the peak to avoid liquidations from hunting wicks before the correction.
- Trading Plan: Take partial profits upon reaching TP1 (2.3450 USDT) and immediately move the Stop Loss to the entry price (Breakeven).
👉 Do you follow price action in assets showing divergence and wick-based ceilings? Follow us for more daily technical analysis on Binance Square!
👇 Do you think FOLKS will correct down to the SMA 20 at 2.278 USDT, or will it try to break 2.50 USDT? Comment below!
#BinanceSquare #CryptoTrading #BollingerBands #FuturesTrading $BTC $FOLKS
The FOLKSUSDT pair (Binance Futures) has reached a critical resistance zone after a bullish impulse drove the price to repeatedly test the Upper Bollinger Band (2.4625 USDT). For the last 5 consecutive hours, the price has left multiple rejection wicks between 2.4500 and 2.4820 USDT, with noticeably declining volume and the 1H RSI above 81, signaling clear exhaustion in buying momentum and an imminent reversion to the mean.
📌 Key Setup Points (Short / Reversal at the Top):
🎯 Entry Point: 2.4470 USDT (continued rejection at the Upper Bollinger Band)
🛑 Stop Loss: 2.5450 USDT (generous and protected, strategically placed above the local high of 2.4820 USDT and the psychological barrier at 2.5000 USDT)
💰 Target 1 (TP1): 2.3450 USDT (structural support and the base of the consolidation range)
🚀 Target 2 (TP2): 2.2780 USDT (reversion toward the Middle Band / SMA 20)
⚖️ R:R Ratio: 1:1.04 at TP1 | 1:1.72 at TP2
🧠 Technical Rationale and Risk Management:
- Multiple-Wick Ceiling: Bulls have repeatedly failed to close candles above 2.45 USDT, indicating passive absorption and volume divergence.
- Wide Stop Loss to Avoid Stop Hunts: Set at 2.5450 USDT, with nearly 10 cents of buffer above the peak to avoid liquidations from hunting wicks before the correction.
- Trading Plan: Take partial profits upon reaching TP1 (2.3450 USDT) and immediately move the Stop Loss to the entry price (Breakeven).
👉 Do you follow price action in assets showing divergence and wick-based ceilings? Follow us for more daily technical analysis on Binance Square!
👇 Do you think FOLKS will correct down to the SMA 20 at 2.278 USDT, or will it try to break 2.50 USDT? Comment below!
#BinanceSquare #CryptoTrading #BollingerBands #FuturesTrading $BTC $FOLKS
1
113
·
--
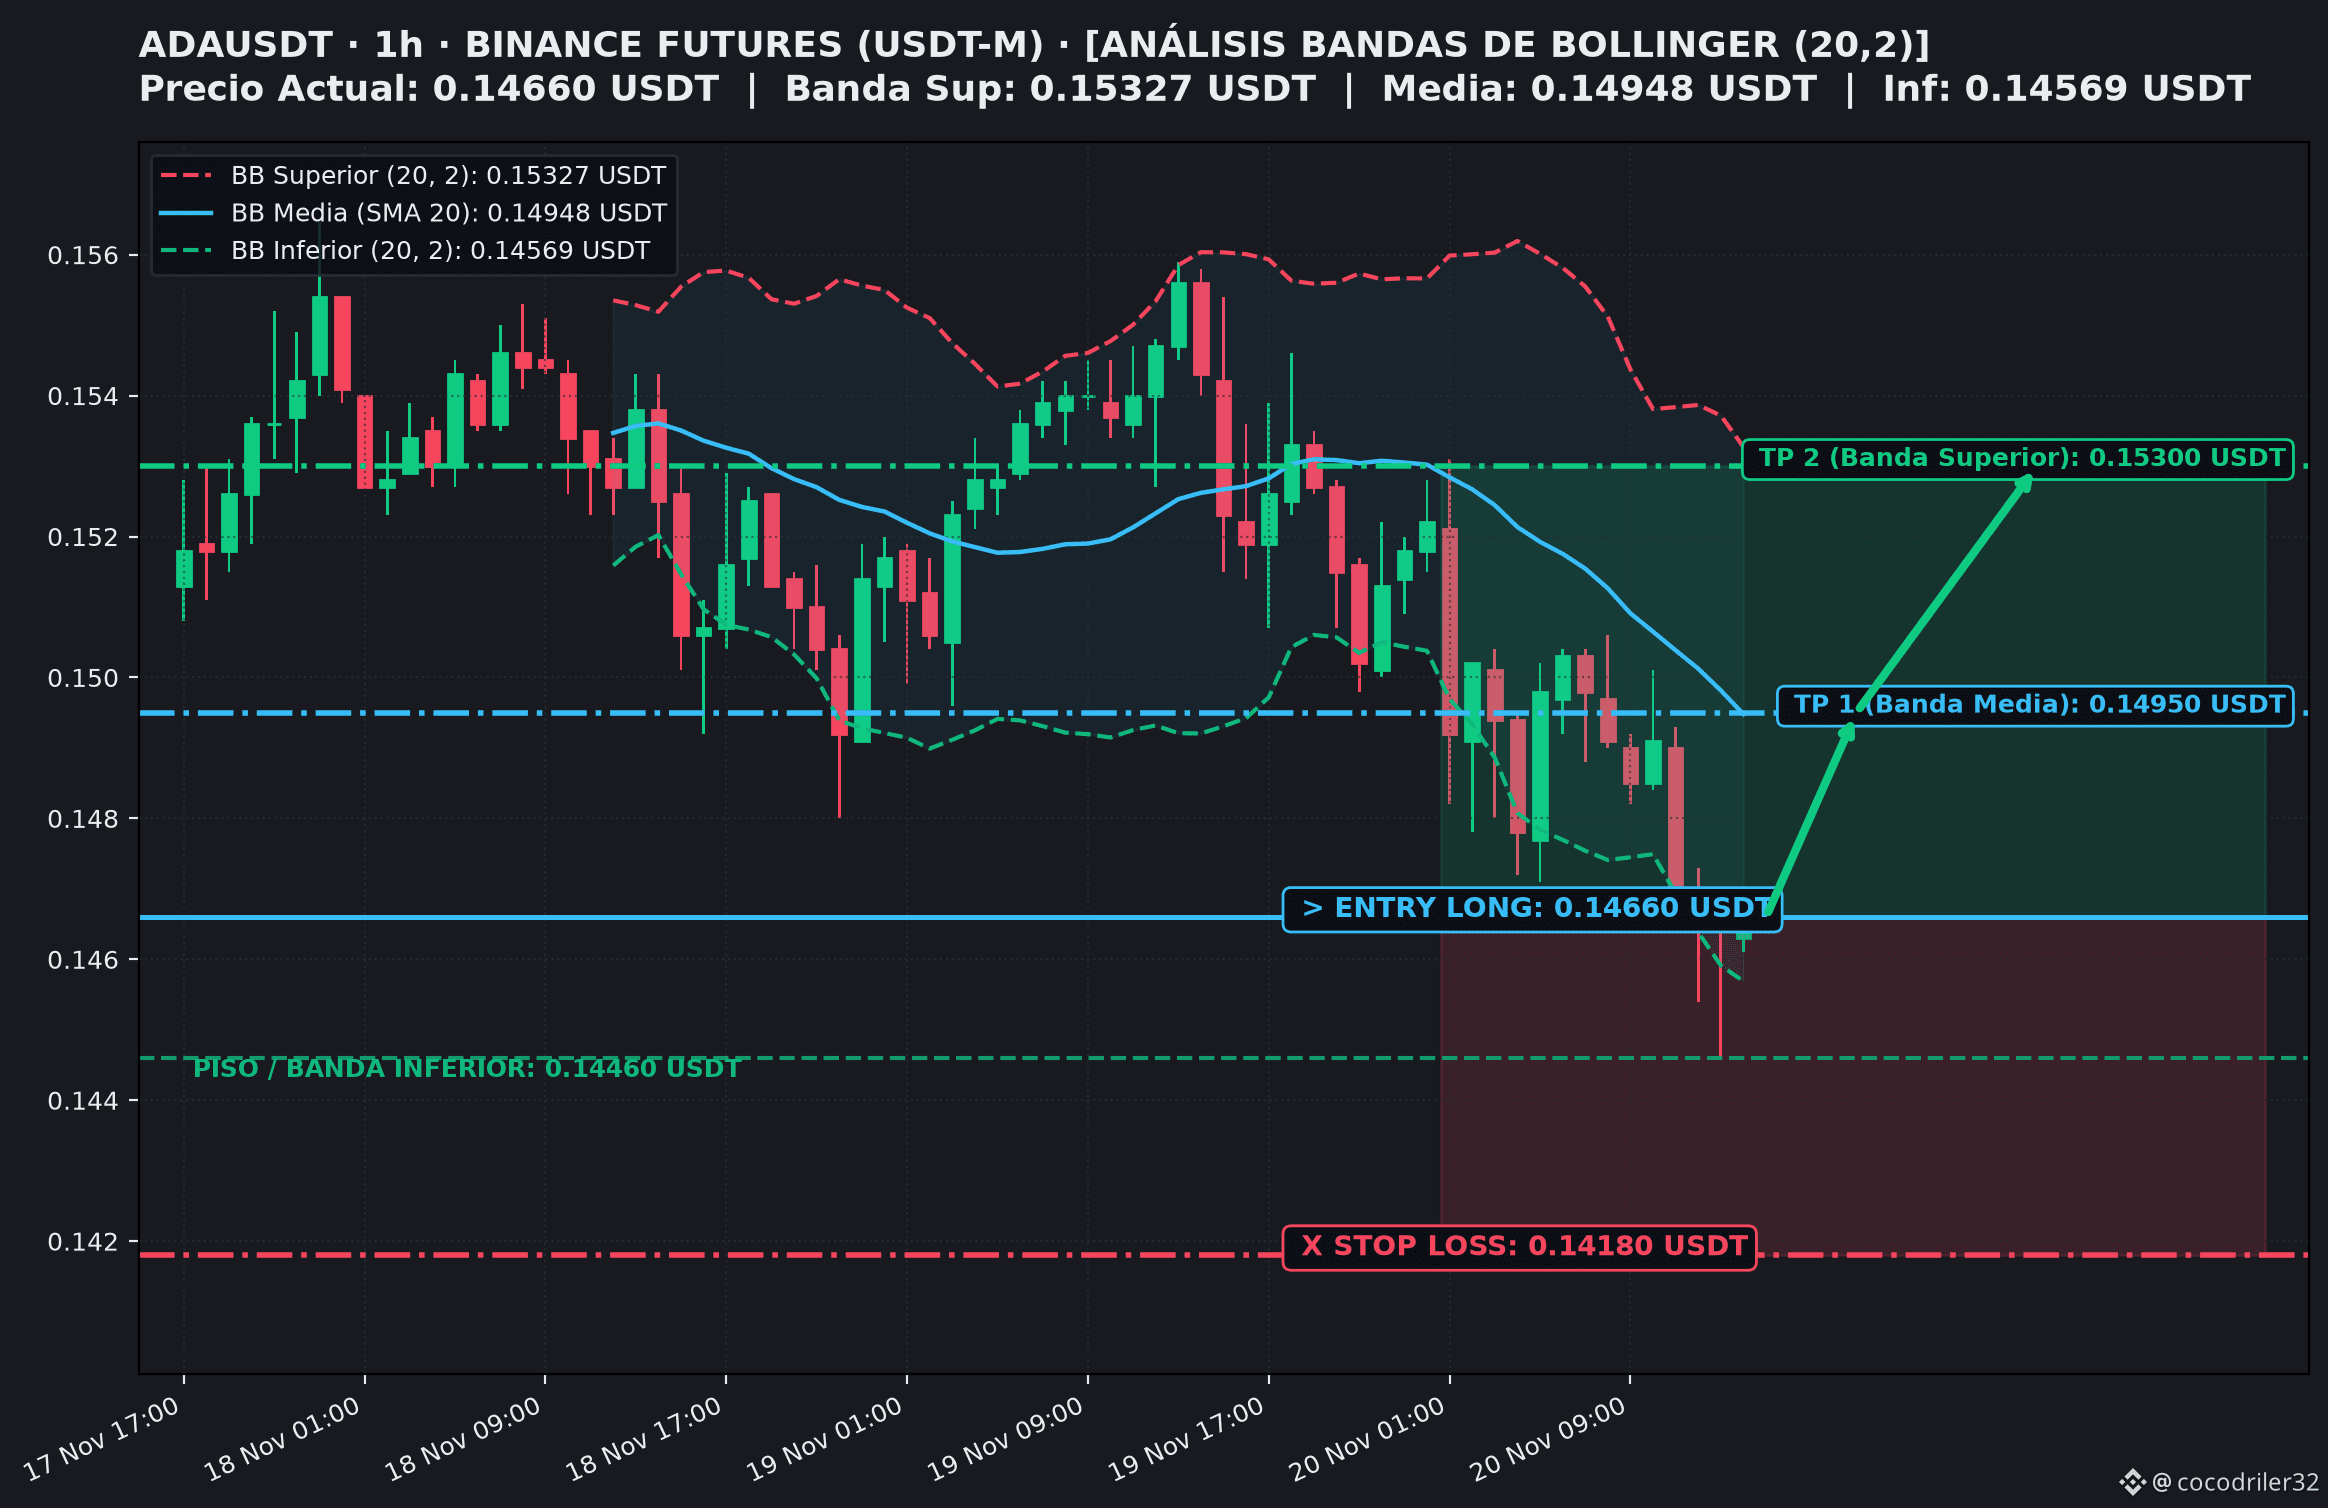
ANALYSIS $ADA (1H): Double Test of the Lower Band and Oversold Long Setup 📈⚡
The ADAUSDT pair (Binance Futures) has completed a corrective phase, breaking through the Lower Bollinger Band (0.14569 USDT) and pushing the 1H RSI into extreme oversold territory below 30 points (29.7 pts). After recording two consecutive buying-absorption wicks in the 0.1446–0.1454 USDT zone on climactic volume, followed by a contraction in selling, the asset confirms supply exhaustion and opens up an opportunity for a technical rebound toward the moving average.
📌 Key Setup Points (Long / Support Bounce):
🎯 Entry Point: 0.14660 USDT (consolidation and confirmation of absorption at the Lower Band)
🛑 Stop Loss: 0.14180 USDT (generous and protected, strategically placed below the 0.14460 USDT sweep low and the 0.14200 USDT level)
💰 Target 1 (TP1): 0.14950 USDT (reversal toward the Middle Band / SMA 20)
🚀 Target 2 (TP2): 0.15300 USDT (bullish expansion toward the Upper Bollinger Band)
⚖️ R:R Ratio: 1:0.60 at TP1 | 1:1.33 at TP2 (conservative approach, prioritizing partial profit-taking at the SMA 20)
🧠 Technical Rationale and Risk Management:
- Absorption at the Lower Band: The rejection, marked by lower wicks at 0.1446 USDT, shows institutional buyers defending the range floor.
- Stop Loss to Avoid Stop Hunts: Placed at 0.14180 USDT, providing a wide safety margin below recent lows to cushion against any manipulation or liquidity sweep.
- Trading Plan: Take partial profits when TP1 (0.14950 USDT) is reached and immediately move the Stop Loss to the entry price (Breakeven).
👉 Are you following Cardano price action and technical rebound zones in major altcoins? Follow us for more daily analysis on Binance Square!
👇 Do you think ADA will quickly recover to 0.153 USDT, or will it continue moving sideways at support? Let us know what you think!
#BinanceSquare #CryptoTrading #BollingerBands #FuturesTrading $BTC $ADA
ANALYSIS $ADA (1H): Double Test of the Lower Band and Oversold Long Setup 📈⚡
The ADAUSDT pair (Binance Futures) has completed a corrective phase, breaking through the Lower Bollinger Band (0.14569 USDT) and pushing the 1H RSI into extreme oversold territory below 30 points (29.7 pts). After recording two consecutive buying-absorption wicks in the 0.1446–0.1454 USDT zone on climactic volume, followed by a contraction in selling, the asset confirms supply exhaustion and opens up an opportunity for a technical rebound toward the moving average.
📌 Key Setup Points (Long / Support Bounce):
🎯 Entry Point: 0.14660 USDT (consolidation and confirmation of absorption at the Lower Band)
🛑 Stop Loss: 0.14180 USDT (generous and protected, strategically placed below the 0.14460 USDT sweep low and the 0.14200 USDT level)
💰 Target 1 (TP1): 0.14950 USDT (reversal toward the Middle Band / SMA 20)
🚀 Target 2 (TP2): 0.15300 USDT (bullish expansion toward the Upper Bollinger Band)
⚖️ R:R Ratio: 1:0.60 at TP1 | 1:1.33 at TP2 (conservative approach, prioritizing partial profit-taking at the SMA 20)
🧠 Technical Rationale and Risk Management:
- Absorption at the Lower Band: The rejection, marked by lower wicks at 0.1446 USDT, shows institutional buyers defending the range floor.
- Stop Loss to Avoid Stop Hunts: Placed at 0.14180 USDT, providing a wide safety margin below recent lows to cushion against any manipulation or liquidity sweep.
- Trading Plan: Take partial profits when TP1 (0.14950 USDT) is reached and immediately move the Stop Loss to the entry price (Breakeven).
👉 Are you following Cardano price action and technical rebound zones in major altcoins? Follow us for more daily analysis on Binance Square!
👇 Do you think ADA will quickly recover to 0.153 USDT, or will it continue moving sideways at support? Let us know what you think!
#BinanceSquare #CryptoTrading #BollingerBands #FuturesTrading $BTC $ADA
The ADAUSDT pair (Binance Futures) has completed a corrective phase, breaking through the Lower Bollinger Band (0.14569 USDT) and pushing the 1H RSI into extreme oversold territory below 30 points (29.7 pts). After recording two consecutive buying-absorption wicks in the 0.1446–0.1454 USDT zone on climactic volume, followed by a contraction in selling, the asset confirms supply exhaustion and opens up an opportunity for a technical rebound toward the moving average.
📌 Key Setup Points (Long / Support Bounce):
🎯 Entry Point: 0.14660 USDT (consolidation and confirmation of absorption at the Lower Band)
🛑 Stop Loss: 0.14180 USDT (generous and protected, strategically placed below the 0.14460 USDT sweep low and the 0.14200 USDT level)
💰 Target 1 (TP1): 0.14950 USDT (reversal toward the Middle Band / SMA 20)
🚀 Target 2 (TP2): 0.15300 USDT (bullish expansion toward the Upper Bollinger Band)
⚖️ R:R Ratio: 1:0.60 at TP1 | 1:1.33 at TP2 (conservative approach, prioritizing partial profit-taking at the SMA 20)
🧠 Technical Rationale and Risk Management:
- Absorption at the Lower Band: The rejection, marked by lower wicks at 0.1446 USDT, shows institutional buyers defending the range floor.
- Stop Loss to Avoid Stop Hunts: Placed at 0.14180 USDT, providing a wide safety margin below recent lows to cushion against any manipulation or liquidity sweep.
- Trading Plan: Take partial profits when TP1 (0.14950 USDT) is reached and immediately move the Stop Loss to the entry price (Breakeven).
👉 Are you following Cardano price action and technical rebound zones in major altcoins? Follow us for more daily analysis on Binance Square!
👇 Do you think ADA will quickly recover to 0.153 USDT, or will it continue moving sideways at support? Let us know what you think!
#BinanceSquare #CryptoTrading #BollingerBands #FuturesTrading $BTC $ADA
1
127

·
--
RSI, MACD, Bollinger Bands, and EMAs help spot trend shifts without guessing the market. RSI measures momentum. A reading over 70 suggests the asset is overbought; under 30 signals oversold. On $BTC, an RSI of 68 on Monday could mean a short pullback is likely. MACD compares two EMAs. When the fast line crosses above the slow line, a bullish momentum may begin. A negative histogram that turns positive shows a potential trend change. Bollinger Bands use a 20‑period SMA with ±2 standard deviations. When $ETH touches the upper band, it may be overextended. A squeeze—bands close together—often precedes a big move. EMAs smooth . A 12‑EMA crossing above a 26‑EMA creates a bullish signal; a 200‑EMA is a long‑term support line. Use these tools together to spot entry points. CryptoTrading #TechnicalAnalysis #RSI #BollingerBands
RSI, MACD, Bollinger Bands, and EMAs help spot trend shifts without guessing the market. RSI measures momentum. A reading over 70 suggests the asset is overbought; under 30 signals oversold. On $BTC , an RSI of 68 on Monday could mean a short pullback is likely. MACD compares two EMAs. When the fast line crosses above the slow line, a bullish momentum may begin. A negative histogram that turns positive shows a potential trend change. Bollinger Bands use a 20‑period SMA with ±2 standard deviations. When $ETH touches the upper band, it may be overextended. A squeeze—bands close together—often precedes a big move. EMAs smooth . A 12‑EMA crossing above a 26‑EMA creates a bullish signal; a 200‑EMA is a long‑term support line. Use these tools together to spot entry points. CryptoTrading #TechnicalAnalysis #RSI #BollingerBands
80
·
--
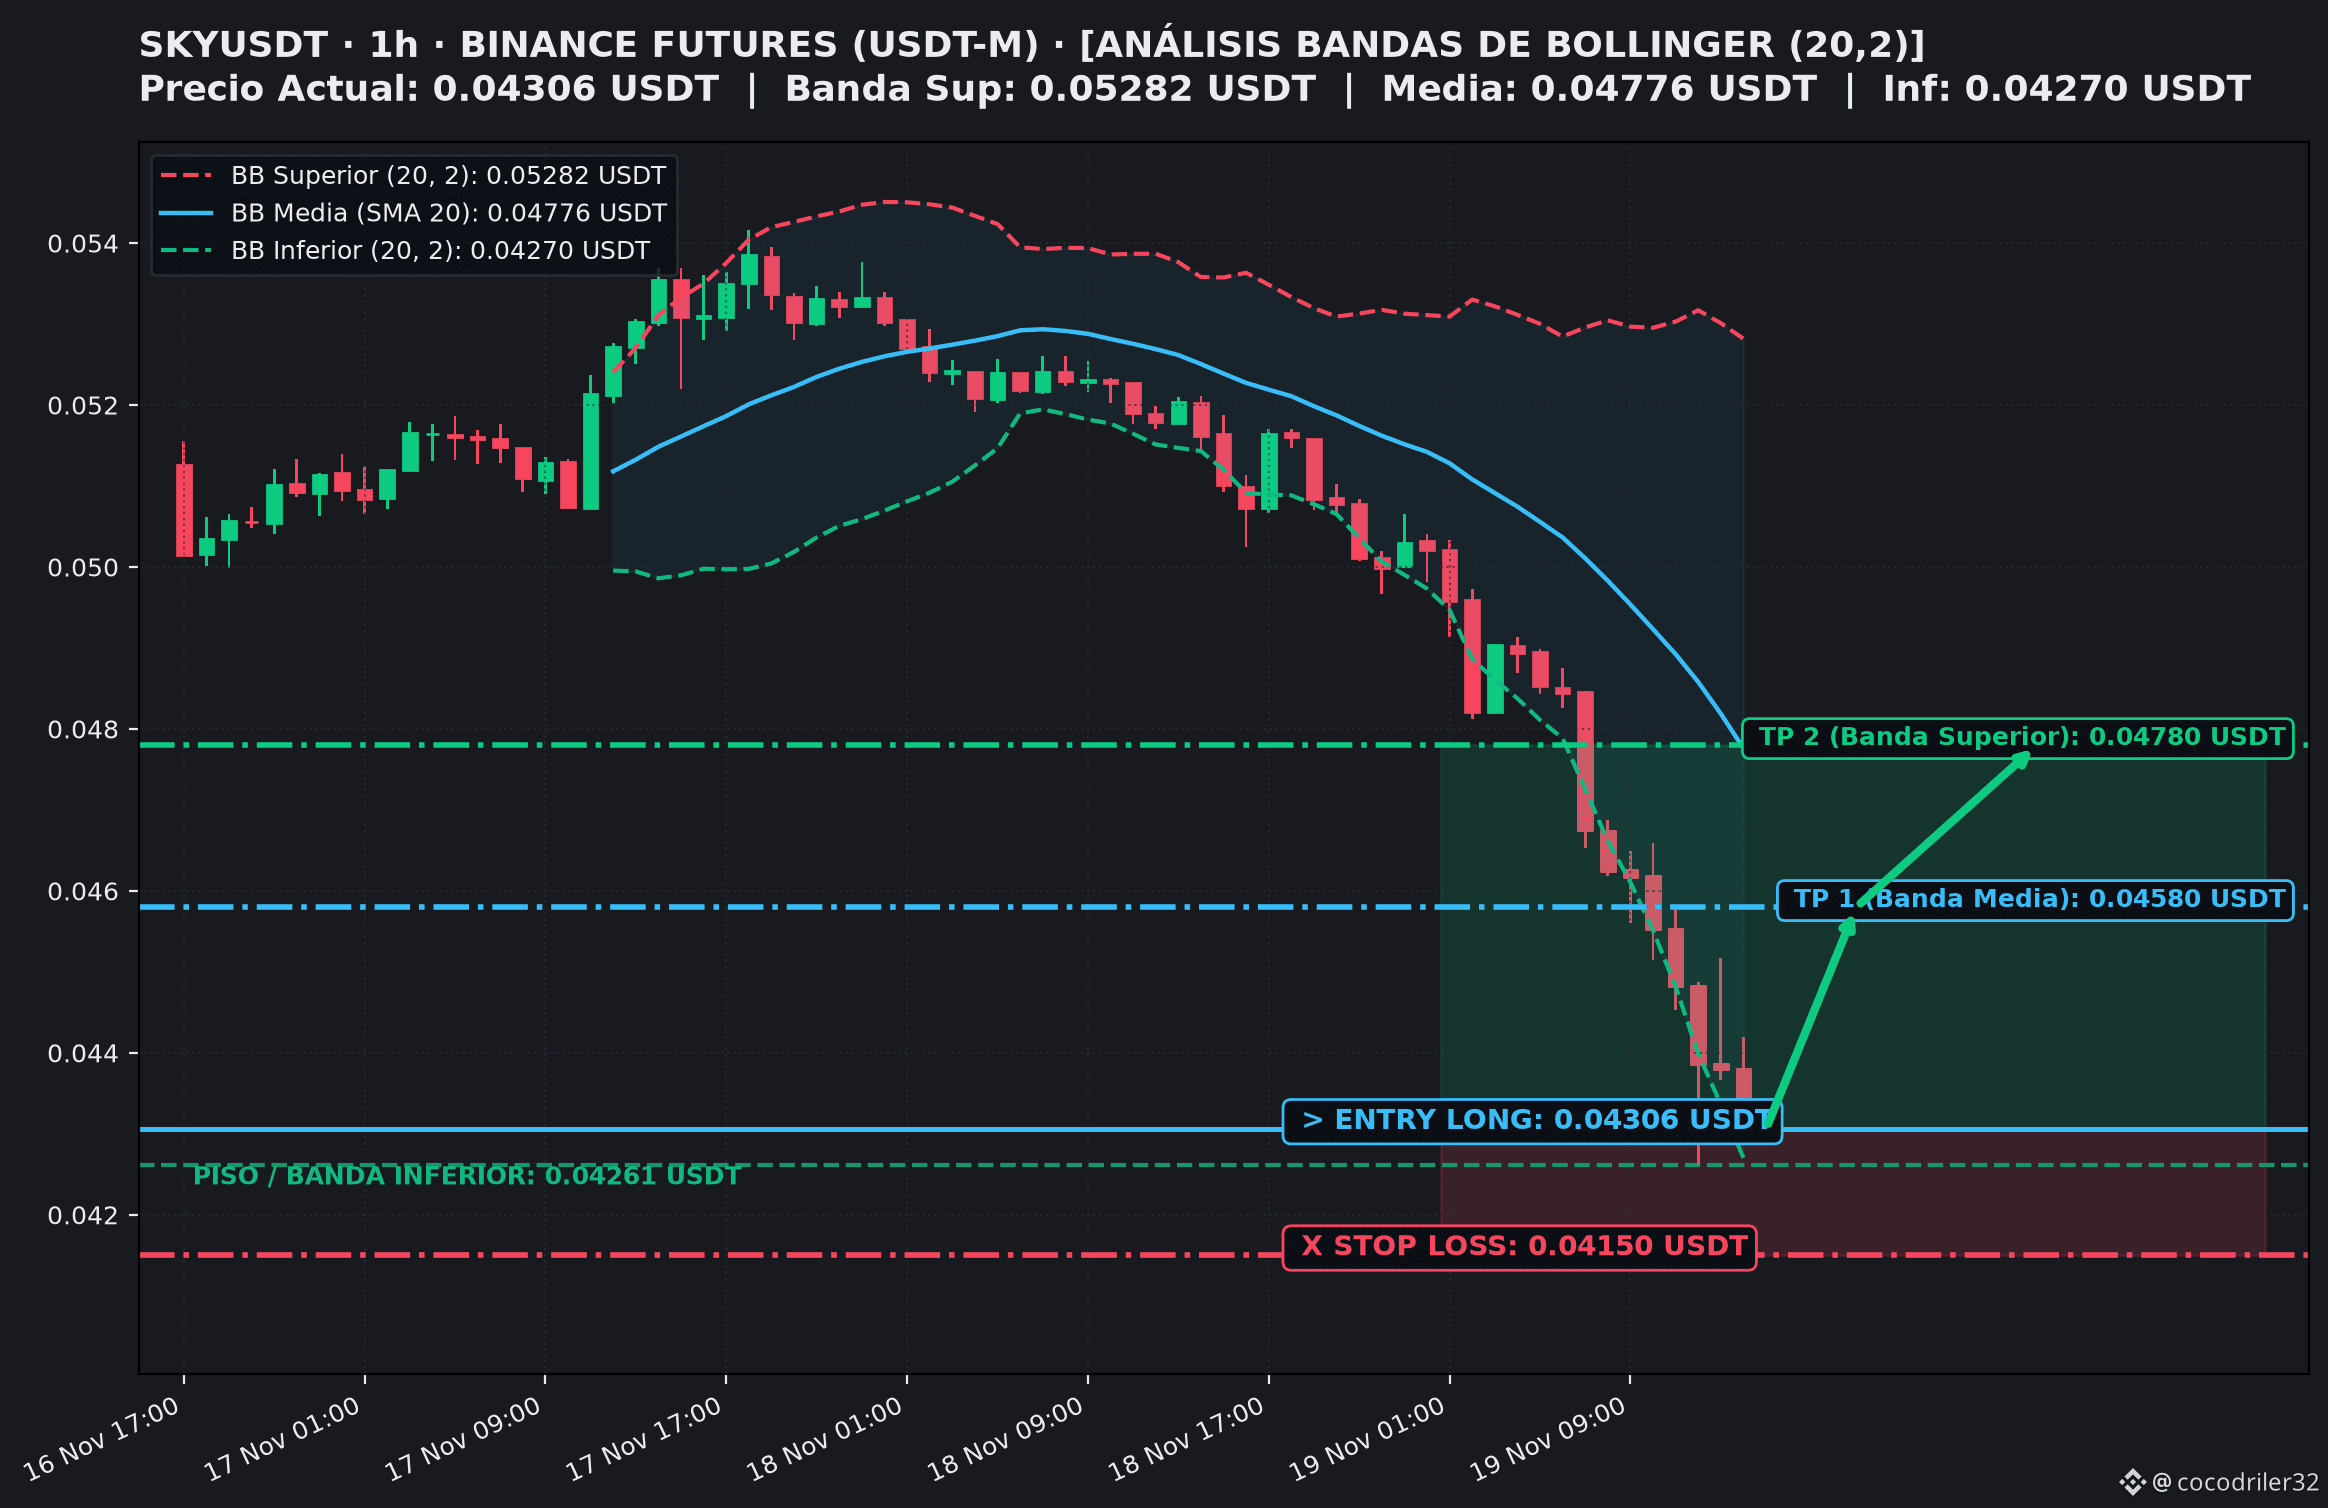
ANALYSIS $SKY (1H): Lower Bollinger Band Capitulation and an Oversold Long Setup 📈⚡
The SKYUSDT pair (Binance Futures) has experienced a sharp corrective drop that pierced the Lower Bollinger Band (0.04270 USDT), pushing the 1H RSI to extreme capitulation levels below 10 points (9.44 pts). After recording an absorption wick with peak volume at 0.04261 USDT, selling pressure is showing clear signs of exhaustion, opening a high-probability window for a technical bounce toward the moving average.
📌 Key Setup Details (Long / Support Bounce):
🎯 Entry Point: 0.04306 USDT (absorption and consolidation above the Lower Bollinger Band)
🛑 Stop Loss: 0.04150 USDT (with room to breathe and protected, below the capitulation low of 0.04261 USDT and the psychological support at 0.04200 USDT)
💰 Target 1 (TP1): 0.04580 USDT (first resistance level and technical retracement)
🚀 Target 2 (TP2): 0.04780 USDT (reversal toward the Middle Band / SMA 20)
⚖️ R:R Ratio: 1:1.76 at TP1 | 1:3.04 at TP2
🧠 Technical Rationale and Risk Management:
- Extreme Oversold Conditions on 1H: With an RSI below 10 points, the statistical probability of a bullish reversal toward the SMA 20 is extremely high.
- Stop Loss to Avoid Stop Hunts: Set at 0.04150 USDT to absorb any attempt to hunt liquidity below 0.04261 USDT before the bullish momentum consolidates.
- Trading Plan: Take partial profits at TP1 (0.04580 USDT) and move the Stop Loss to the entry price (Breakeven).
👉 Do you follow technical bounce setups in oversold assets? Follow us for more daily analysis on Binance Square!
👇 Do you think SKY will bounce straight to 0.0478 USDT or make a new low? Leave a comment below!
#BinanceSquare #CryptoTrading #BollingerBands #FuturesTrading $BTC $SKY
ANALYSIS $SKY (1H): Lower Bollinger Band Capitulation and an Oversold Long Setup 📈⚡
The SKYUSDT pair (Binance Futures) has experienced a sharp corrective drop that pierced the Lower Bollinger Band (0.04270 USDT), pushing the 1H RSI to extreme capitulation levels below 10 points (9.44 pts). After recording an absorption wick with peak volume at 0.04261 USDT, selling pressure is showing clear signs of exhaustion, opening a high-probability window for a technical bounce toward the moving average.
📌 Key Setup Details (Long / Support Bounce):
🎯 Entry Point: 0.04306 USDT (absorption and consolidation above the Lower Bollinger Band)
🛑 Stop Loss: 0.04150 USDT (with room to breathe and protected, below the capitulation low of 0.04261 USDT and the psychological support at 0.04200 USDT)
💰 Target 1 (TP1): 0.04580 USDT (first resistance level and technical retracement)
🚀 Target 2 (TP2): 0.04780 USDT (reversal toward the Middle Band / SMA 20)
⚖️ R:R Ratio: 1:1.76 at TP1 | 1:3.04 at TP2
🧠 Technical Rationale and Risk Management:
- Extreme Oversold Conditions on 1H: With an RSI below 10 points, the statistical probability of a bullish reversal toward the SMA 20 is extremely high.
- Stop Loss to Avoid Stop Hunts: Set at 0.04150 USDT to absorb any attempt to hunt liquidity below 0.04261 USDT before the bullish momentum consolidates.
- Trading Plan: Take partial profits at TP1 (0.04580 USDT) and move the Stop Loss to the entry price (Breakeven).
👉 Do you follow technical bounce setups in oversold assets? Follow us for more daily analysis on Binance Square!
👇 Do you think SKY will bounce straight to 0.0478 USDT or make a new low? Leave a comment below!
#BinanceSquare #CryptoTrading #BollingerBands #FuturesTrading $BTC $SKY
The SKYUSDT pair (Binance Futures) has experienced a sharp corrective drop that pierced the Lower Bollinger Band (0.04270 USDT), pushing the 1H RSI to extreme capitulation levels below 10 points (9.44 pts). After recording an absorption wick with peak volume at 0.04261 USDT, selling pressure is showing clear signs of exhaustion, opening a high-probability window for a technical bounce toward the moving average.
📌 Key Setup Details (Long / Support Bounce):
🎯 Entry Point: 0.04306 USDT (absorption and consolidation above the Lower Bollinger Band)
🛑 Stop Loss: 0.04150 USDT (with room to breathe and protected, below the capitulation low of 0.04261 USDT and the psychological support at 0.04200 USDT)
💰 Target 1 (TP1): 0.04580 USDT (first resistance level and technical retracement)
🚀 Target 2 (TP2): 0.04780 USDT (reversal toward the Middle Band / SMA 20)
⚖️ R:R Ratio: 1:1.76 at TP1 | 1:3.04 at TP2
🧠 Technical Rationale and Risk Management:
- Extreme Oversold Conditions on 1H: With an RSI below 10 points, the statistical probability of a bullish reversal toward the SMA 20 is extremely high.
- Stop Loss to Avoid Stop Hunts: Set at 0.04150 USDT to absorb any attempt to hunt liquidity below 0.04261 USDT before the bullish momentum consolidates.
- Trading Plan: Take partial profits at TP1 (0.04580 USDT) and move the Stop Loss to the entry price (Breakeven).
👉 Do you follow technical bounce setups in oversold assets? Follow us for more daily analysis on Binance Square!
👇 Do you think SKY will bounce straight to 0.0478 USDT or make a new low? Leave a comment below!
#BinanceSquare #CryptoTrading #BollingerBands #FuturesTrading $BTC $SKY
2
277
·
--
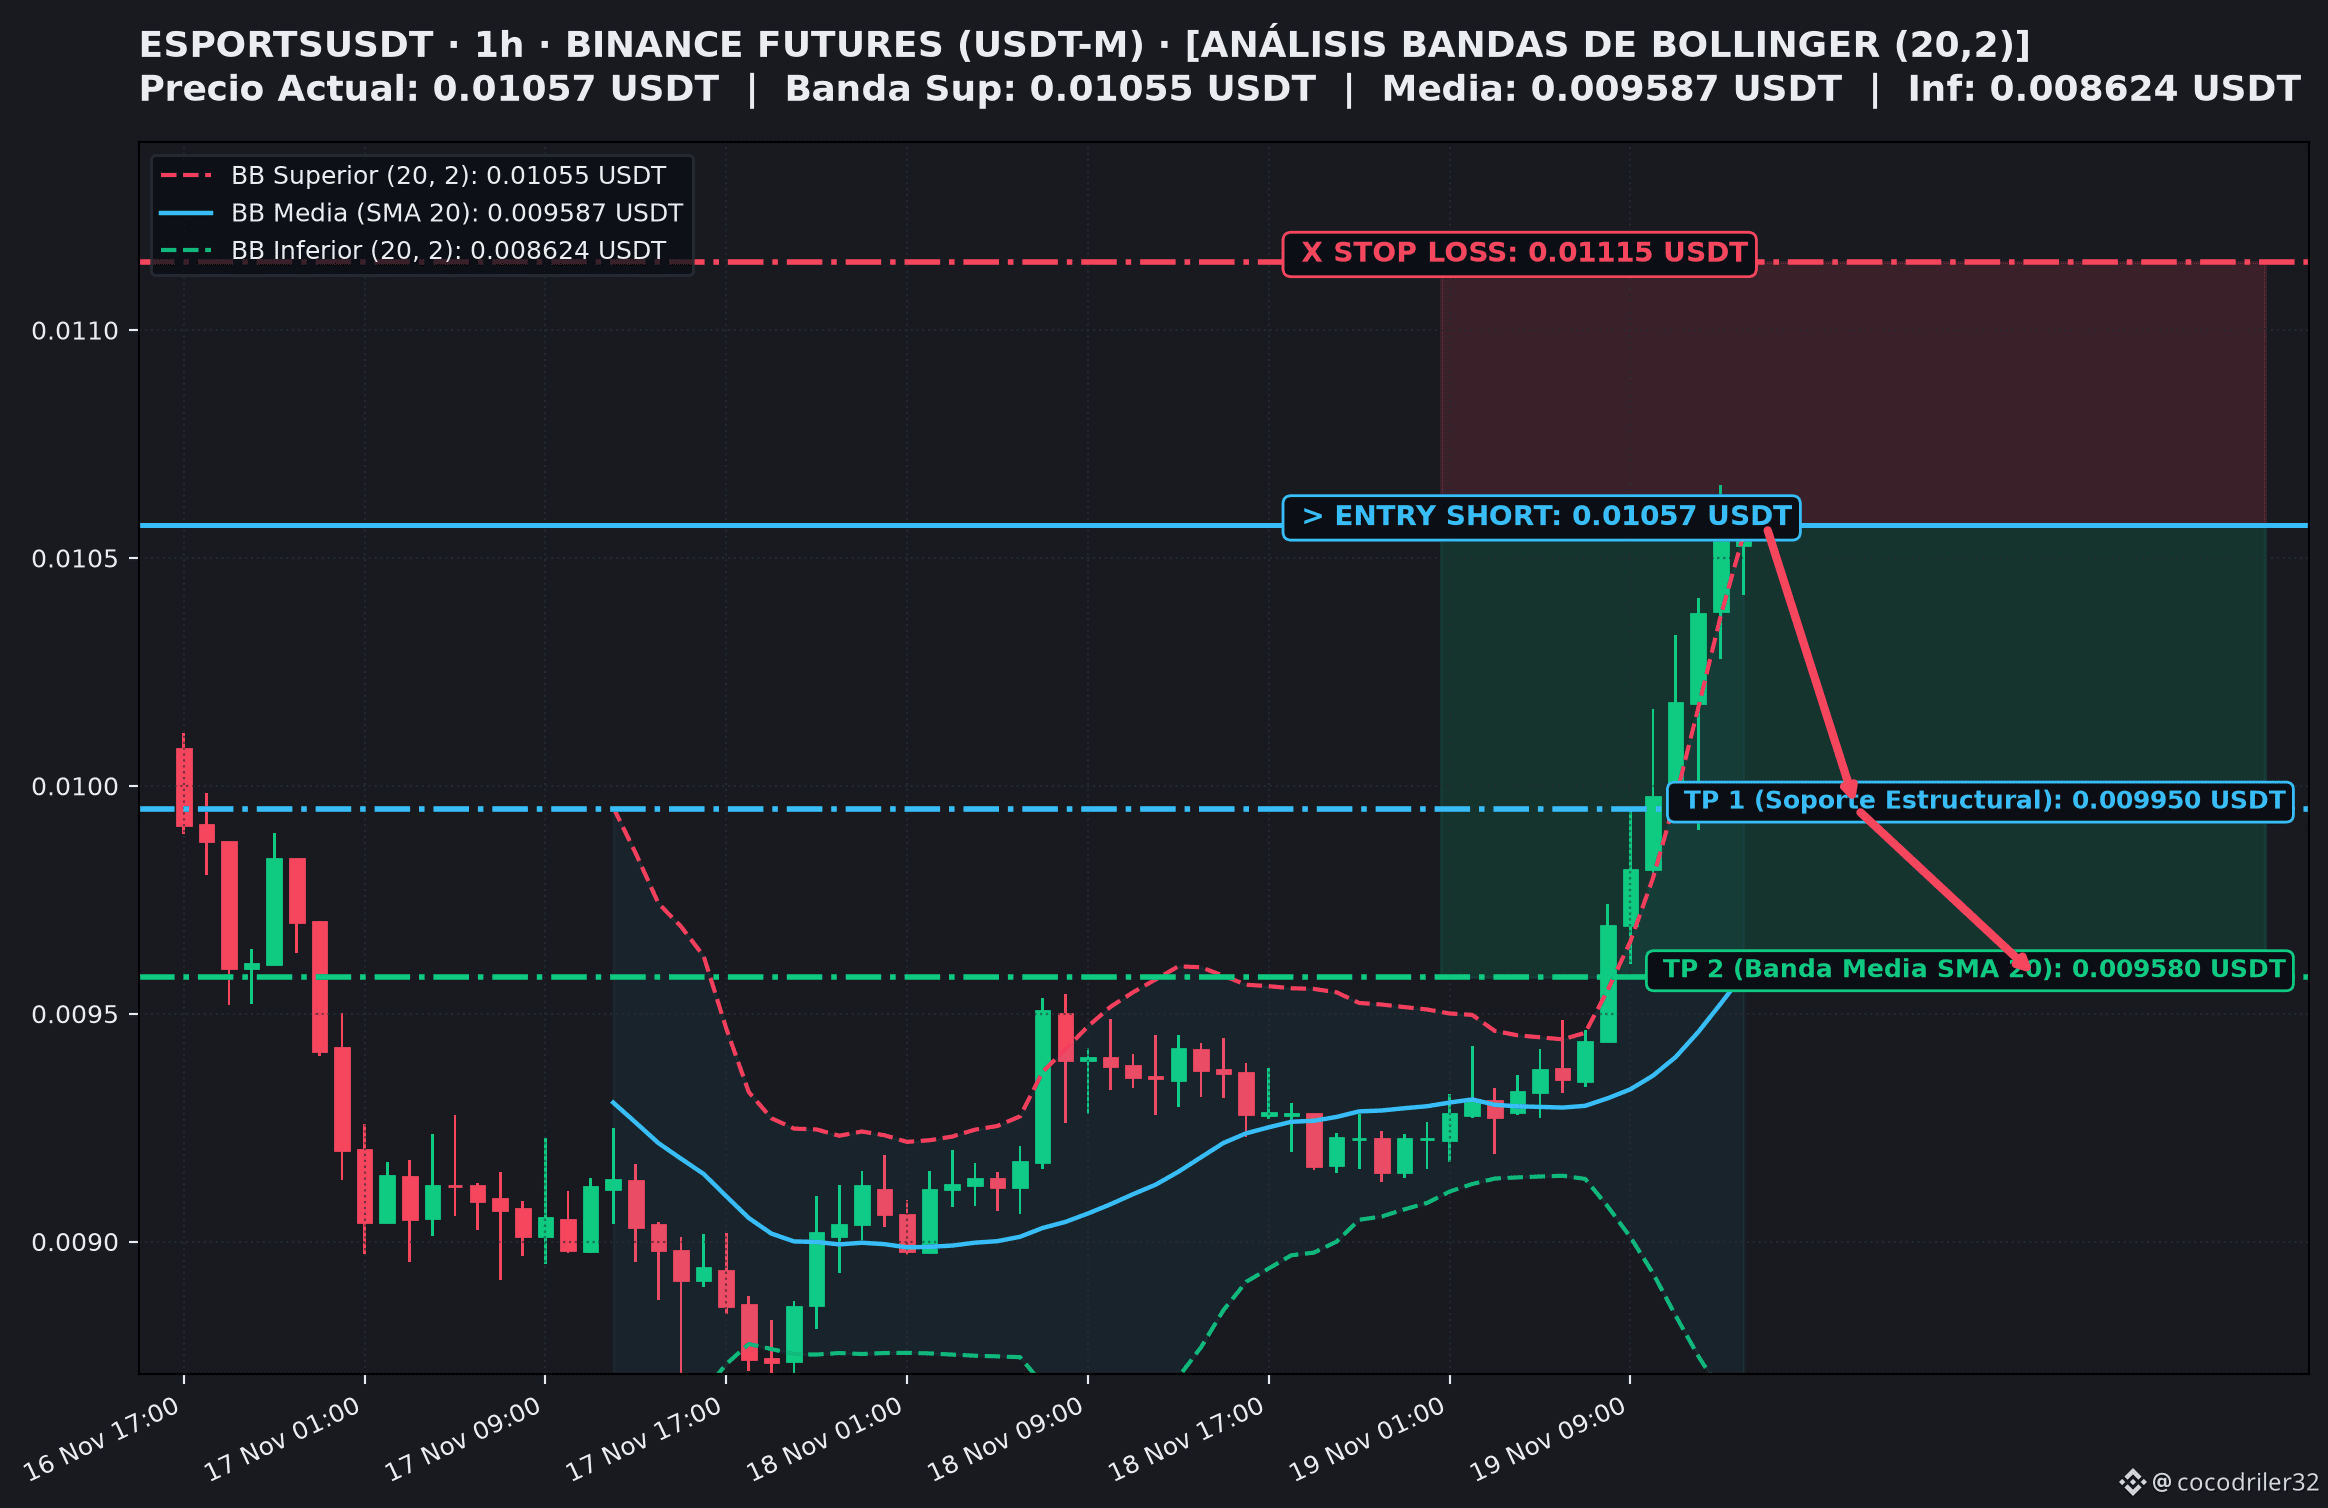
ANALYSIS $ESPORTS (1H): Extreme Overbought Conditions at the Upper Band and Short Setup 📉⚡
The ESPORTSUSDT pair (Binance Futures) has staged a rapid vertical rally of more than 14% in just a few hours, piercing the Upper Bollinger Band (0.01055 USDT) and pushing the 1H RSI to a historic extreme overbought level (above 96 points). After forming a rejection wick at 0.010659 USDT with declining volume on lower timeframes (15m), the asset is showing clear signs of buyer exhaustion and presents an opportunity for a reversion to the mean.
📌 Setup Highlights (Short / Exhaustion Correction):
🎯 Entry Point: 0.010570 USDT (rejection and absorption at the Upper Bollinger Band)
🛑 Stop Loss: 0.011150 USDT (wide and protected, placed well above the local high of 0.010659 USDT to cushion against stop-hunt wicks)
💰 Target 1 (TP1): 0.009950 USDT (re-entry into the channel and previous structural support)
🚀 Target 2 (TP2): 0.009580 USDT (reversion toward the Middle Band / SMA 20)
⚖️ R:R Ratio: 1:1.08 at TP1 | 1:1.72 at TP2
🧠 Technical Rationale and Risk Management:
- Critical Overbought Conditions (RSI > 96): Statistically, parabolic expansions that pierce the upper band with such extreme overbought conditions tend to end with a sharp correction toward the moving average.
- Stop Loss with a Buffer Against Stop Hunts: Set at 0.011150 USDT, allowing almost 5.5% of room above the recent peak to prevent volatility from closing the position before the pullback.
- Trading Plan: Secure partial profits at TP1 (0.009950 USDT) and move the Stop Loss to the entry price (breakeven).
👉 Do you monitor overextension anomalies in low-cap altcoins? Follow us for up-to-date technical analysis!
👇 Do you think ESPORTS will correct straight to the SMA 20 at 0.00958 USDT, or attempt another upward spike? Leave us a comment!
#BinanceSquare #CryptoTrading #BollingerBands #FuturesTrading $BTC $ESPORTS
ANALYSIS $ESPORTS (1H): Extreme Overbought Conditions at the Upper Band and Short Setup 📉⚡
The ESPORTSUSDT pair (Binance Futures) has staged a rapid vertical rally of more than 14% in just a few hours, piercing the Upper Bollinger Band (0.01055 USDT) and pushing the 1H RSI to a historic extreme overbought level (above 96 points). After forming a rejection wick at 0.010659 USDT with declining volume on lower timeframes (15m), the asset is showing clear signs of buyer exhaustion and presents an opportunity for a reversion to the mean.
📌 Setup Highlights (Short / Exhaustion Correction):
🎯 Entry Point: 0.010570 USDT (rejection and absorption at the Upper Bollinger Band)
🛑 Stop Loss: 0.011150 USDT (wide and protected, placed well above the local high of 0.010659 USDT to cushion against stop-hunt wicks)
💰 Target 1 (TP1): 0.009950 USDT (re-entry into the channel and previous structural support)
🚀 Target 2 (TP2): 0.009580 USDT (reversion toward the Middle Band / SMA 20)
⚖️ R:R Ratio: 1:1.08 at TP1 | 1:1.72 at TP2
🧠 Technical Rationale and Risk Management:
- Critical Overbought Conditions (RSI > 96): Statistically, parabolic expansions that pierce the upper band with such extreme overbought conditions tend to end with a sharp correction toward the moving average.
- Stop Loss with a Buffer Against Stop Hunts: Set at 0.011150 USDT, allowing almost 5.5% of room above the recent peak to prevent volatility from closing the position before the pullback.
- Trading Plan: Secure partial profits at TP1 (0.009950 USDT) and move the Stop Loss to the entry price (breakeven).
👉 Do you monitor overextension anomalies in low-cap altcoins? Follow us for up-to-date technical analysis!
👇 Do you think ESPORTS will correct straight to the SMA 20 at 0.00958 USDT, or attempt another upward spike? Leave us a comment!
#BinanceSquare #CryptoTrading #BollingerBands #FuturesTrading $BTC $ESPORTS
The ESPORTSUSDT pair (Binance Futures) has staged a rapid vertical rally of more than 14% in just a few hours, piercing the Upper Bollinger Band (0.01055 USDT) and pushing the 1H RSI to a historic extreme overbought level (above 96 points). After forming a rejection wick at 0.010659 USDT with declining volume on lower timeframes (15m), the asset is showing clear signs of buyer exhaustion and presents an opportunity for a reversion to the mean.
📌 Setup Highlights (Short / Exhaustion Correction):
🎯 Entry Point: 0.010570 USDT (rejection and absorption at the Upper Bollinger Band)
🛑 Stop Loss: 0.011150 USDT (wide and protected, placed well above the local high of 0.010659 USDT to cushion against stop-hunt wicks)
💰 Target 1 (TP1): 0.009950 USDT (re-entry into the channel and previous structural support)
🚀 Target 2 (TP2): 0.009580 USDT (reversion toward the Middle Band / SMA 20)
⚖️ R:R Ratio: 1:1.08 at TP1 | 1:1.72 at TP2
🧠 Technical Rationale and Risk Management:
- Critical Overbought Conditions (RSI > 96): Statistically, parabolic expansions that pierce the upper band with such extreme overbought conditions tend to end with a sharp correction toward the moving average.
- Stop Loss with a Buffer Against Stop Hunts: Set at 0.011150 USDT, allowing almost 5.5% of room above the recent peak to prevent volatility from closing the position before the pullback.
- Trading Plan: Secure partial profits at TP1 (0.009950 USDT) and move the Stop Loss to the entry price (breakeven).
👉 Do you monitor overextension anomalies in low-cap altcoins? Follow us for up-to-date technical analysis!
👇 Do you think ESPORTS will correct straight to the SMA 20 at 0.00958 USDT, or attempt another upward spike? Leave us a comment!
#BinanceSquare #CryptoTrading #BollingerBands #FuturesTrading $BTC $ESPORTS
3
242

Bollinger Bands are designed to visualize volatility around a moving average.
The bands expand when price volatility increases and contract when volatility decreases. A narrowing band can indicate a quieter market, while a wider band reflects larger recent price fluctuations.
However, a breakout beyond an outer band does not automatically mean the price will continue in that direction. Markets can remain near an outer band during strong trends, and false breakouts are possible.
For volatile tokens such as $SHELL, Bollinger Bands are best used as a volatility reference alongside volume, trend structure, and other indicators.
#BollingerBands #Volatility #TechnicalAnalysis
Bollinger Bands are designed to visualize volatility around a moving average.
The bands expand when price volatility increases and contract when volatility decreases. A narrowing band can indicate a quieter market, while a wider band reflects larger recent price fluctuations.
However, a breakout beyond an outer band does not automatically mean the price will continue in that direction. Markets can remain near an outer band during strong trends, and false breakouts are possible.
For volatile tokens such as $SHELL , Bollinger Bands are best used as a volatility reference alongside volume, trend structure, and other indicators.
#BollingerBands #Volatility #TechnicalAnalysis
The bands expand when price volatility increases and contract when volatility decreases. A narrowing band can indicate a quieter market, while a wider band reflects larger recent price fluctuations.
However, a breakout beyond an outer band does not automatically mean the price will continue in that direction. Markets can remain near an outer band during strong trends, and false breakouts are possible.
For volatile tokens such as $SHELL , Bollinger Bands are best used as a volatility reference alongside volume, trend structure, and other indicators.
#BollingerBands #Volatility #TechnicalAnalysis

12
Bollinger Bands use a moving average and standard deviation to visualize recent price volatility.
When the bands widen, it generally indicates that price fluctuations have increased. When they narrow, the market has experienced a period of relatively lower volatility.
However, a narrow band does not guarantee an immediate breakout, and touching the upper or lower band does not guarantee a reversal.
For volatile tokens such as $SHELL, these bands can expand rapidly during sharp market moves.
They are best used as a volatility reference alongside volume and market structure, not as an independent buy or sell signal.
#BollingerBands #Volatility #TechnicalAnalysis
Bollinger Bands use a moving average and standard deviation to visualize recent price volatility.
When the bands widen, it generally indicates that price fluctuations have increased. When they narrow, the market has experienced a period of relatively lower volatility.
However, a narrow band does not guarantee an immediate breakout, and touching the upper or lower band does not guarantee a reversal.
For volatile tokens such as $SHELL , these bands can expand rapidly during sharp market moves.
They are best used as a volatility reference alongside volume and market structure, not as an independent buy or sell signal.
#BollingerBands #Volatility #TechnicalAnalysis
When the bands widen, it generally indicates that price fluctuations have increased. When they narrow, the market has experienced a period of relatively lower volatility.
However, a narrow band does not guarantee an immediate breakout, and touching the upper or lower band does not guarantee a reversal.
For volatile tokens such as $SHELL , these bands can expand rapidly during sharp market moves.
They are best used as a volatility reference alongside volume and market structure, not as an independent buy or sell signal.
#BollingerBands #Volatility #TechnicalAnalysis
9
·
--
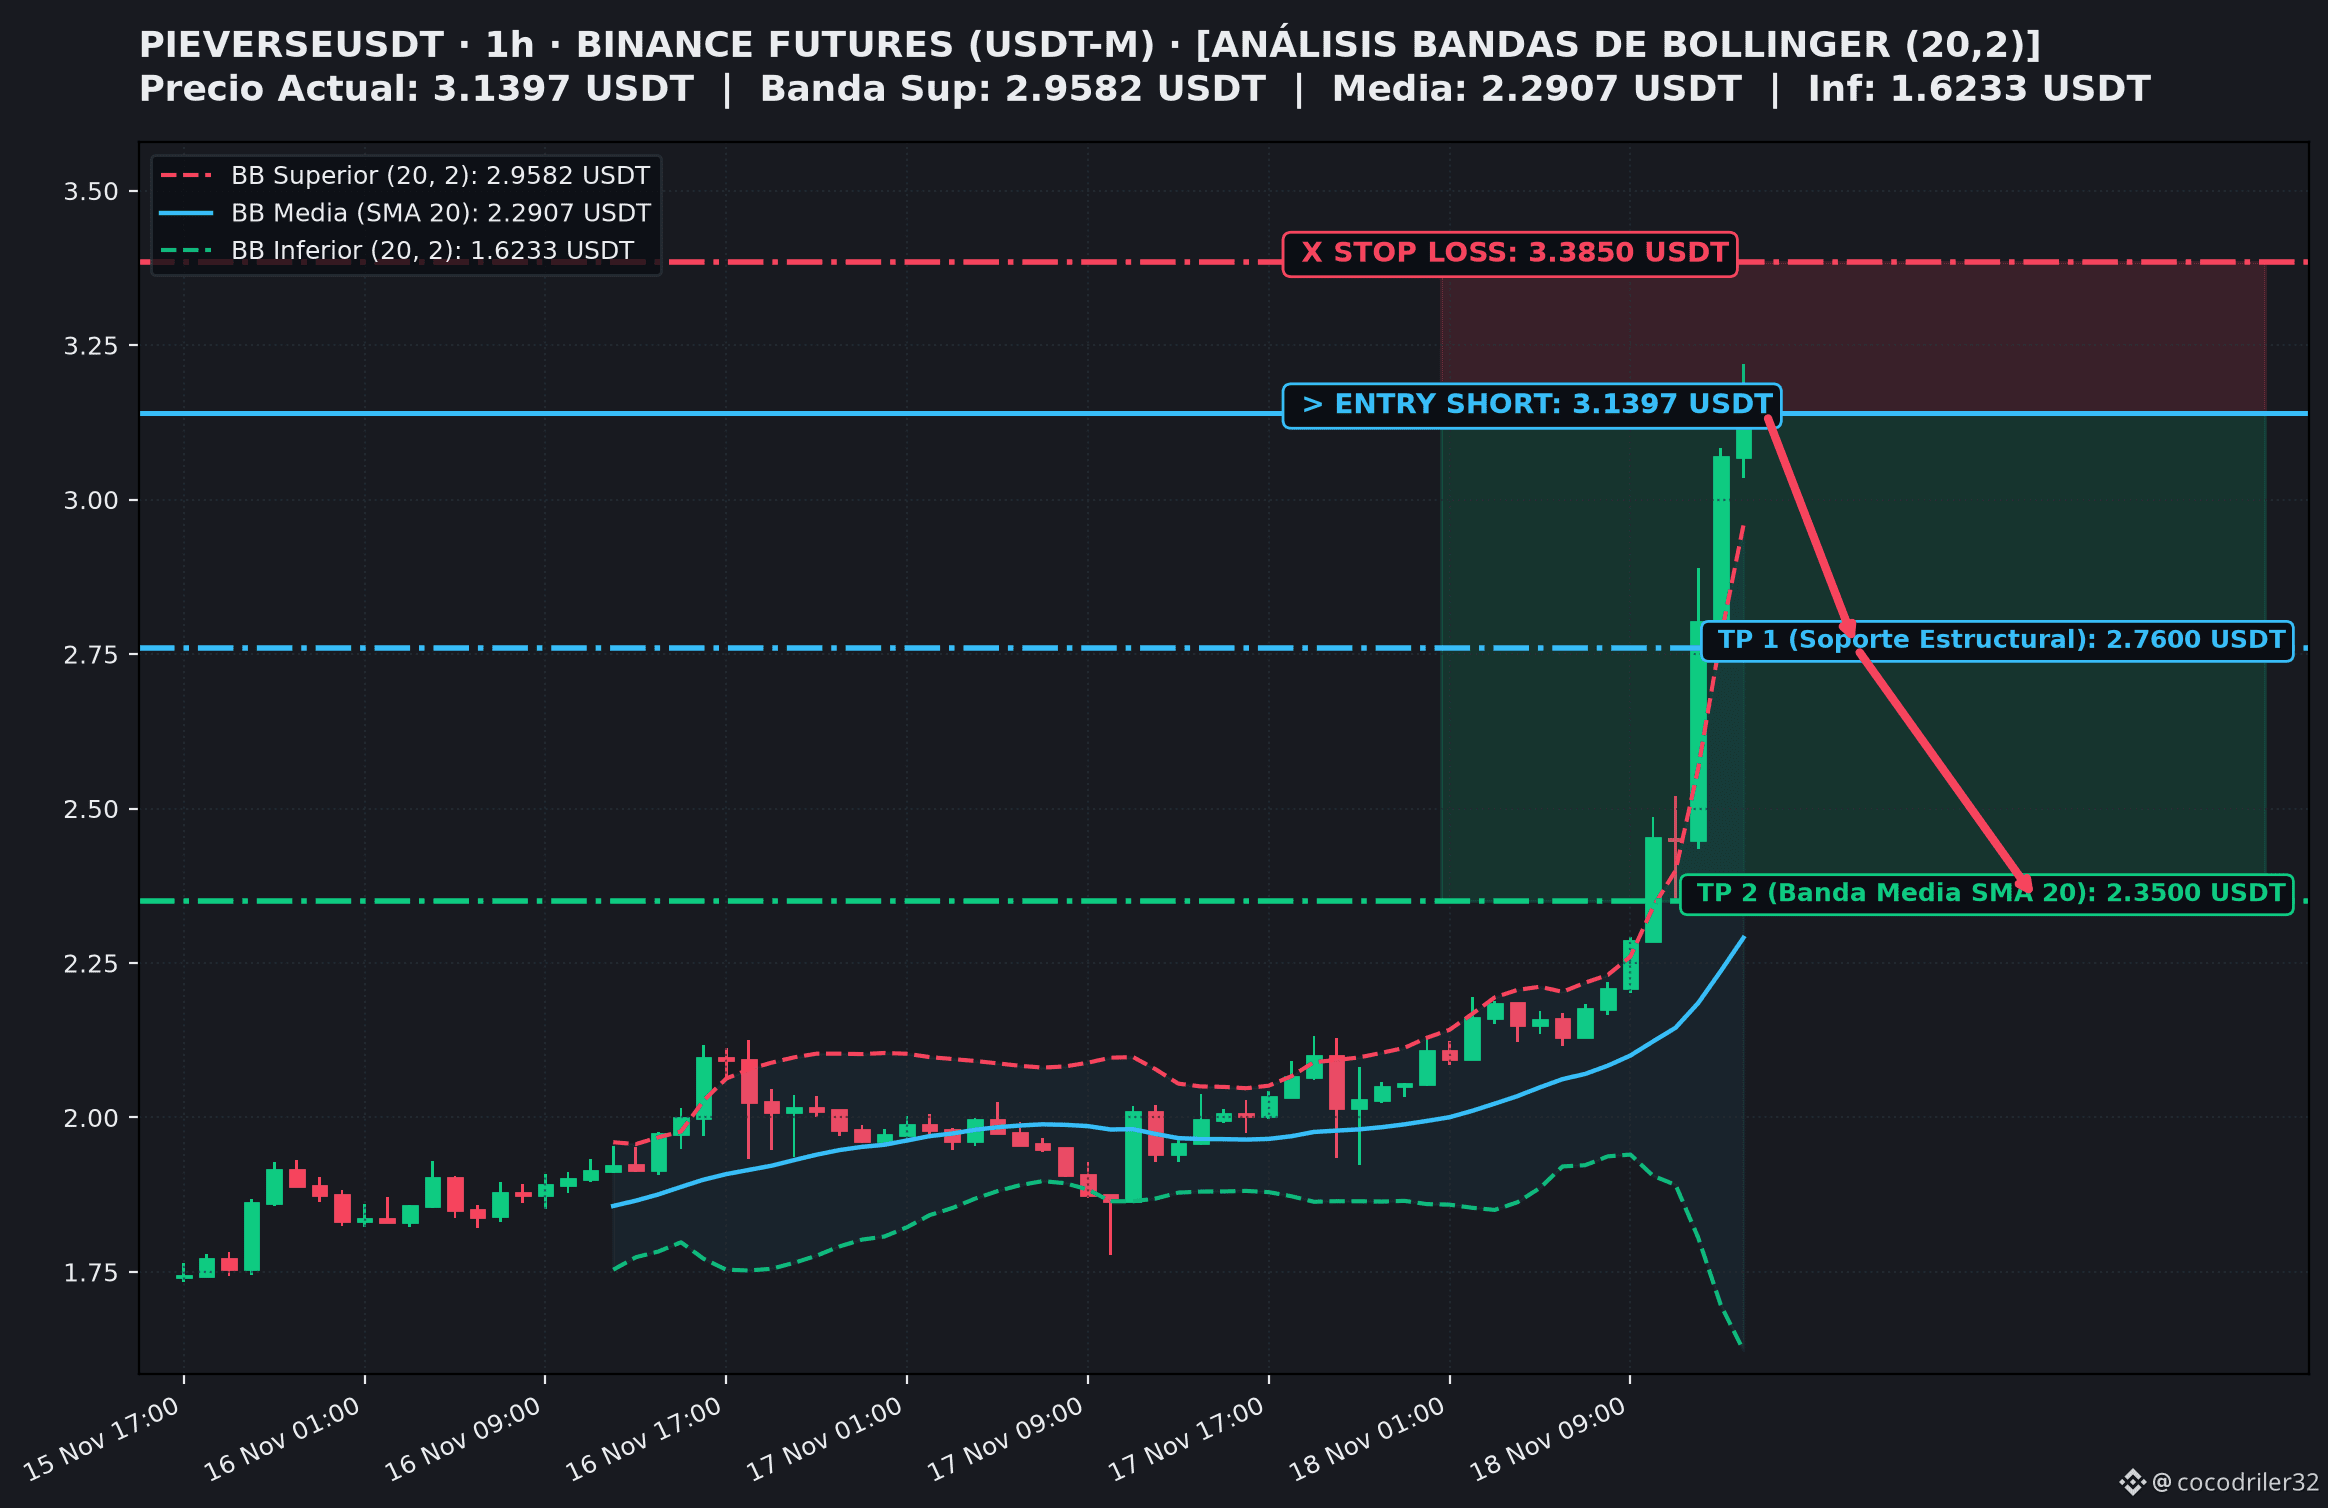
ANALYSIS $PIEVERSE (1H): Parabolic Overextension (+55%) and Short Setup with a Wide Stop 📉⚡
The PIEVERSEUSDT pair (Binance Futures) has recorded a vertical rally of over +55% in 24h, decisively breaking above its Upper Bollinger Band (2.9582 USDT) and reaching an RSI above 93 on the 1H timeframe. After marking highs at 3.2189 USDT, price action shows clear signs of buying exhaustion and a high probability of a correction toward the mean.
📌 Key Setup Points (Short / Mean Reversion):
🎯 Entry Point: 3.1397 USDT (overextension zone outside the bands)
🛑 Stop Loss: 3.3850 USDT (wide and protected, above the local high and wick zone)
💰 Target 1 (TP1): 2.7600 USDT (structural support and base of the previous acceleration)
🚀 Target 2 (TP2): 2.3500 USDT (reversion toward the Middle Band / SMA 20)
⚖️ R:R Ratio: 1:1.55 at TP1 | 1:3.22 at TP2
🧠 Technical Rationale and Risk Management:
- Bollinger Statistical Anomaly: Price rarely sustains a vertical move outside the Upper Band without experiencing a pullback toward the SMA 20 to normalize volume.
- Protected Stop Loss: Set with plenty of room above 3.3000 USDT to prevent liquidity-sweep wicks from triggering an exit before the decline unfolds.
- Position Management: Take partial profits at TP1 and move the Stop Loss to the entry price (Breakeven) to secure the trade.
👉 Do you keep a close eye on memecoins and highly volatile futures tokens? Follow us for updated analysis and daily setups!
👇 Do you think PIEVERSE will retrace toward 2.35 USDT or try another push above 3.20 USDT? Share your opinion in the comments!
#BinanceSquare #CryptoTrading #BollingerBands #FuturesTrading $BTC $PIEVERSE
ANALYSIS $PIEVERSE (1H): Parabolic Overextension (+55%) and Short Setup with a Wide Stop 📉⚡
The PIEVERSEUSDT pair (Binance Futures) has recorded a vertical rally of over +55% in 24h, decisively breaking above its Upper Bollinger Band (2.9582 USDT) and reaching an RSI above 93 on the 1H timeframe. After marking highs at 3.2189 USDT, price action shows clear signs of buying exhaustion and a high probability of a correction toward the mean.
📌 Key Setup Points (Short / Mean Reversion):
🎯 Entry Point: 3.1397 USDT (overextension zone outside the bands)
🛑 Stop Loss: 3.3850 USDT (wide and protected, above the local high and wick zone)
💰 Target 1 (TP1): 2.7600 USDT (structural support and base of the previous acceleration)
🚀 Target 2 (TP2): 2.3500 USDT (reversion toward the Middle Band / SMA 20)
⚖️ R:R Ratio: 1:1.55 at TP1 | 1:3.22 at TP2
🧠 Technical Rationale and Risk Management:
- Bollinger Statistical Anomaly: Price rarely sustains a vertical move outside the Upper Band without experiencing a pullback toward the SMA 20 to normalize volume.
- Protected Stop Loss: Set with plenty of room above 3.3000 USDT to prevent liquidity-sweep wicks from triggering an exit before the decline unfolds.
- Position Management: Take partial profits at TP1 and move the Stop Loss to the entry price (Breakeven) to secure the trade.
👉 Do you keep a close eye on memecoins and highly volatile futures tokens? Follow us for updated analysis and daily setups!
👇 Do you think PIEVERSE will retrace toward 2.35 USDT or try another push above 3.20 USDT? Share your opinion in the comments!
#BinanceSquare #CryptoTrading #BollingerBands #FuturesTrading $BTC $PIEVERSE
The PIEVERSEUSDT pair (Binance Futures) has recorded a vertical rally of over +55% in 24h, decisively breaking above its Upper Bollinger Band (2.9582 USDT) and reaching an RSI above 93 on the 1H timeframe. After marking highs at 3.2189 USDT, price action shows clear signs of buying exhaustion and a high probability of a correction toward the mean.
📌 Key Setup Points (Short / Mean Reversion):
🎯 Entry Point: 3.1397 USDT (overextension zone outside the bands)
🛑 Stop Loss: 3.3850 USDT (wide and protected, above the local high and wick zone)
💰 Target 1 (TP1): 2.7600 USDT (structural support and base of the previous acceleration)
🚀 Target 2 (TP2): 2.3500 USDT (reversion toward the Middle Band / SMA 20)
⚖️ R:R Ratio: 1:1.55 at TP1 | 1:3.22 at TP2
🧠 Technical Rationale and Risk Management:
- Bollinger Statistical Anomaly: Price rarely sustains a vertical move outside the Upper Band without experiencing a pullback toward the SMA 20 to normalize volume.
- Protected Stop Loss: Set with plenty of room above 3.3000 USDT to prevent liquidity-sweep wicks from triggering an exit before the decline unfolds.
- Position Management: Take partial profits at TP1 and move the Stop Loss to the entry price (Breakeven) to secure the trade.
👉 Do you keep a close eye on memecoins and highly volatile futures tokens? Follow us for updated analysis and daily setups!
👇 Do you think PIEVERSE will retrace toward 2.35 USDT or try another push above 3.20 USDT? Share your opinion in the comments!
#BinanceSquare #CryptoTrading #BollingerBands #FuturesTrading $BTC $PIEVERSE
3
1.3k
·
--
ANALYSIS $ZEC (1H): Rejection at the Lower Band and Long Setup on Mean Reversion 📈⚡
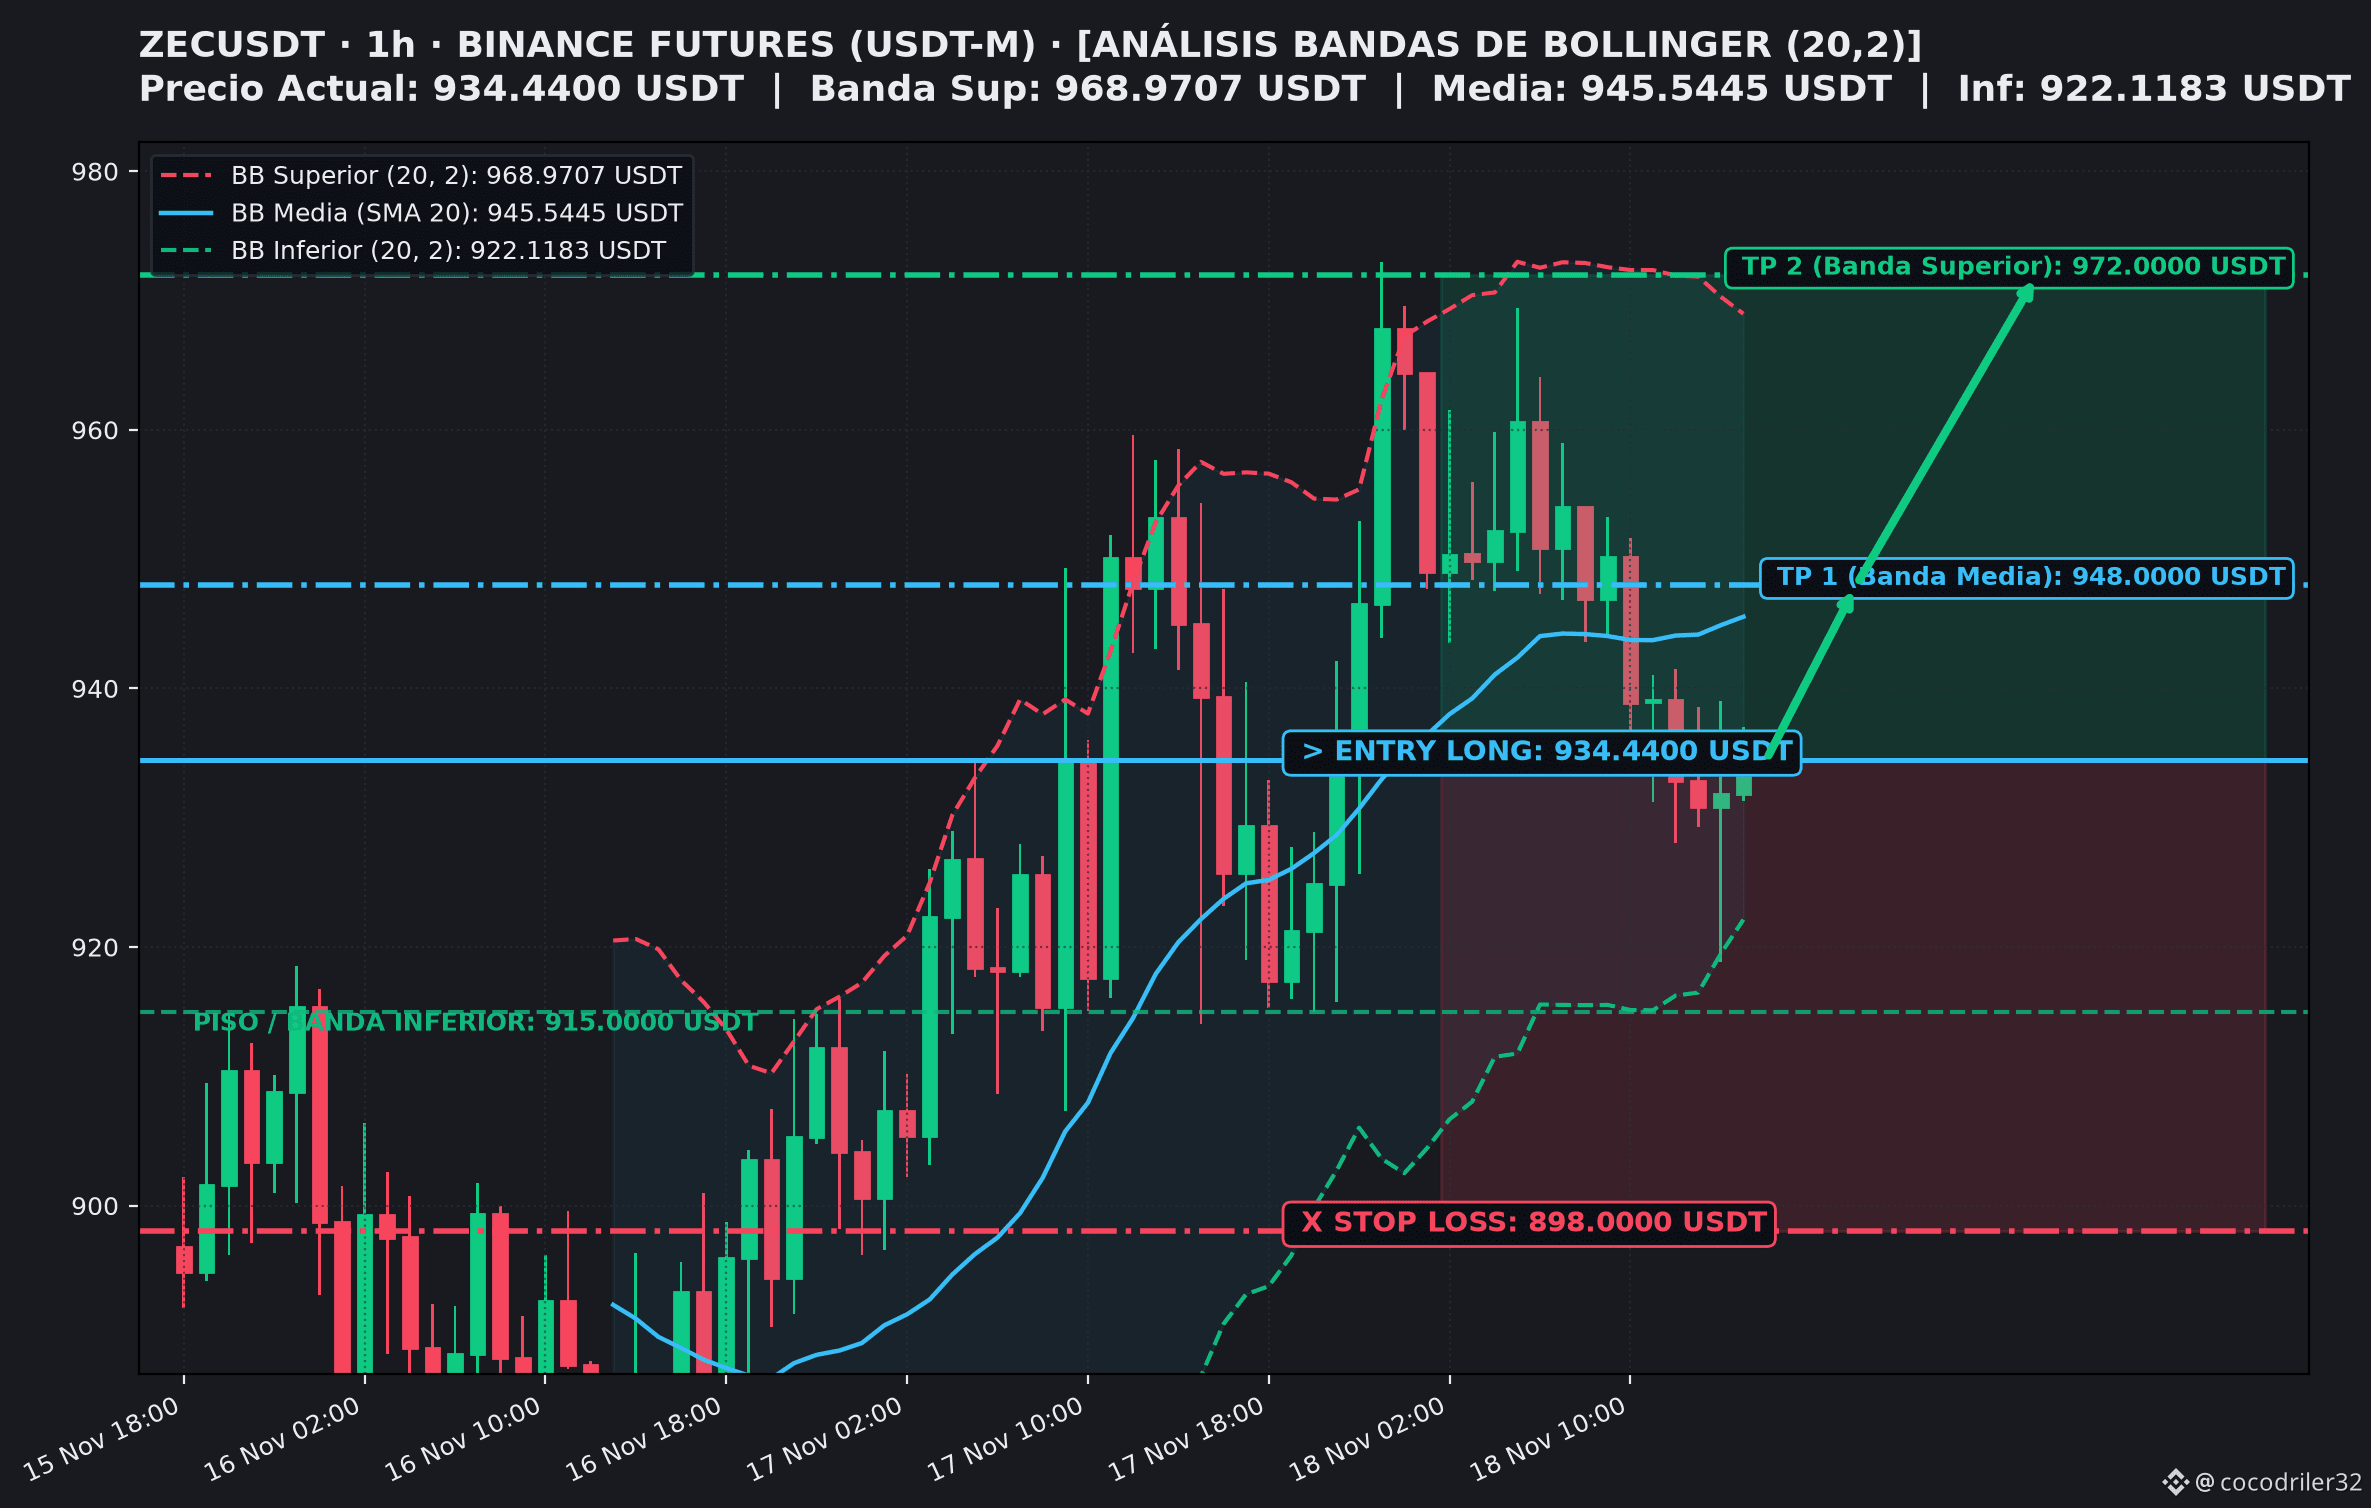
The ZECUSDT pair (Binance Futures) has pulled back toward the lower Bollinger Band (922.12 USDT) and the key support zone at 915.00 USDT. After printing buying-absorption wicks and testing oversold levels on the 1H chart, the price confirms that selling pressure is fading and is preparing for a technical rebound toward the moving average and the top of the range.
📌 Key Setup Points (Long / Support Bounce):
🎯 Entry Point: 934.44 USDT (bounce confirmation above the lower band)
🛑 Stop Loss: 898.00 USDT (with ample room and protection, below the psychological 900.00 USDT level and previous sweep wicks)
💰 Target 1 (TP1): 948.00 USDT (recovery of the middle band / SMA 20)
🚀 Target 2 (TP2): 972.00 USDT (extension toward the upper Bollinger Band and resistance zone)
⚖️ R:R Ratio: 1:1.03 at TP2 (conservative management, prioritizing partial profit-taking)
🧠 Technical Rationale and Risk Management:
- Absorption at the Lower Band: A double test with bearish rejection in the 915.00–922.00 USDT zone, validating the base as solid structural support.
- Stop Loss with Sweep Protection: Set at 898.00 USDT to prevent liquidity hunts or quick wicks from closing the position prematurely.
- Trading Plan: When TP1 at 948.00 USDT is reached, secure partial profits and move the Stop Loss to the entry price (breakeven) to trade toward TP2 without risk.
👉 Are you keeping a close eye on ZEC price action and assets at key support zones? Follow us for more daily analysis!
👇 Do you think ZEC will break strongly above 972 USDT and target 1000 USDT, or will it retest the base? Let us know in the comments!
#BinanceSquare #CryptoTrading #BollingerBands #FuturesTrading $BTC $ZEC
ANALYSIS $ZEC (1H): Rejection at the Lower Band and Long Setup on Mean Reversion 📈⚡
The ZECUSDT pair (Binance Futures) has pulled back toward the lower Bollinger Band (922.12 USDT) and the key support zone at 915.00 USDT. After printing buying-absorption wicks and testing oversold levels on the 1H chart, the price confirms that selling pressure is fading and is preparing for a technical rebound toward the moving average and the top of the range.
📌 Key Setup Points (Long / Support Bounce):
🎯 Entry Point: 934.44 USDT (bounce confirmation above the lower band)
🛑 Stop Loss: 898.00 USDT (with ample room and protection, below the psychological 900.00 USDT level and previous sweep wicks)
💰 Target 1 (TP1): 948.00 USDT (recovery of the middle band / SMA 20)
🚀 Target 2 (TP2): 972.00 USDT (extension toward the upper Bollinger Band and resistance zone)
⚖️ R:R Ratio: 1:1.03 at TP2 (conservative management, prioritizing partial profit-taking)
🧠 Technical Rationale and Risk Management:
- Absorption at the Lower Band: A double test with bearish rejection in the 915.00–922.00 USDT zone, validating the base as solid structural support.
- Stop Loss with Sweep Protection: Set at 898.00 USDT to prevent liquidity hunts or quick wicks from closing the position prematurely.
- Trading Plan: When TP1 at 948.00 USDT is reached, secure partial profits and move the Stop Loss to the entry price (breakeven) to trade toward TP2 without risk.
👉 Are you keeping a close eye on ZEC price action and assets at key support zones? Follow us for more daily analysis!
👇 Do you think ZEC will break strongly above 972 USDT and target 1000 USDT, or will it retest the base? Let us know in the comments!
#BinanceSquare #CryptoTrading #BollingerBands #FuturesTrading $BTC $ZEC
The ZECUSDT pair (Binance Futures) has pulled back toward the lower Bollinger Band (922.12 USDT) and the key support zone at 915.00 USDT. After printing buying-absorption wicks and testing oversold levels on the 1H chart, the price confirms that selling pressure is fading and is preparing for a technical rebound toward the moving average and the top of the range.
📌 Key Setup Points (Long / Support Bounce):
🎯 Entry Point: 934.44 USDT (bounce confirmation above the lower band)
🛑 Stop Loss: 898.00 USDT (with ample room and protection, below the psychological 900.00 USDT level and previous sweep wicks)
💰 Target 1 (TP1): 948.00 USDT (recovery of the middle band / SMA 20)
🚀 Target 2 (TP2): 972.00 USDT (extension toward the upper Bollinger Band and resistance zone)
⚖️ R:R Ratio: 1:1.03 at TP2 (conservative management, prioritizing partial profit-taking)
🧠 Technical Rationale and Risk Management:
- Absorption at the Lower Band: A double test with bearish rejection in the 915.00–922.00 USDT zone, validating the base as solid structural support.
- Stop Loss with Sweep Protection: Set at 898.00 USDT to prevent liquidity hunts or quick wicks from closing the position prematurely.
- Trading Plan: When TP1 at 948.00 USDT is reached, secure partial profits and move the Stop Loss to the entry price (breakeven) to trade toward TP2 without risk.
👉 Are you keeping a close eye on ZEC price action and assets at key support zones? Follow us for more daily analysis!
👇 Do you think ZEC will break strongly above 972 USDT and target 1000 USDT, or will it retest the base? Let us know in the comments!
#BinanceSquare #CryptoTrading #BollingerBands #FuturesTrading $BTC $ZEC
4
453
·
--
ANALYSIS $ETH (1H): Double Bottom and Long Reversal Setup at the Lower Band 📈⚡
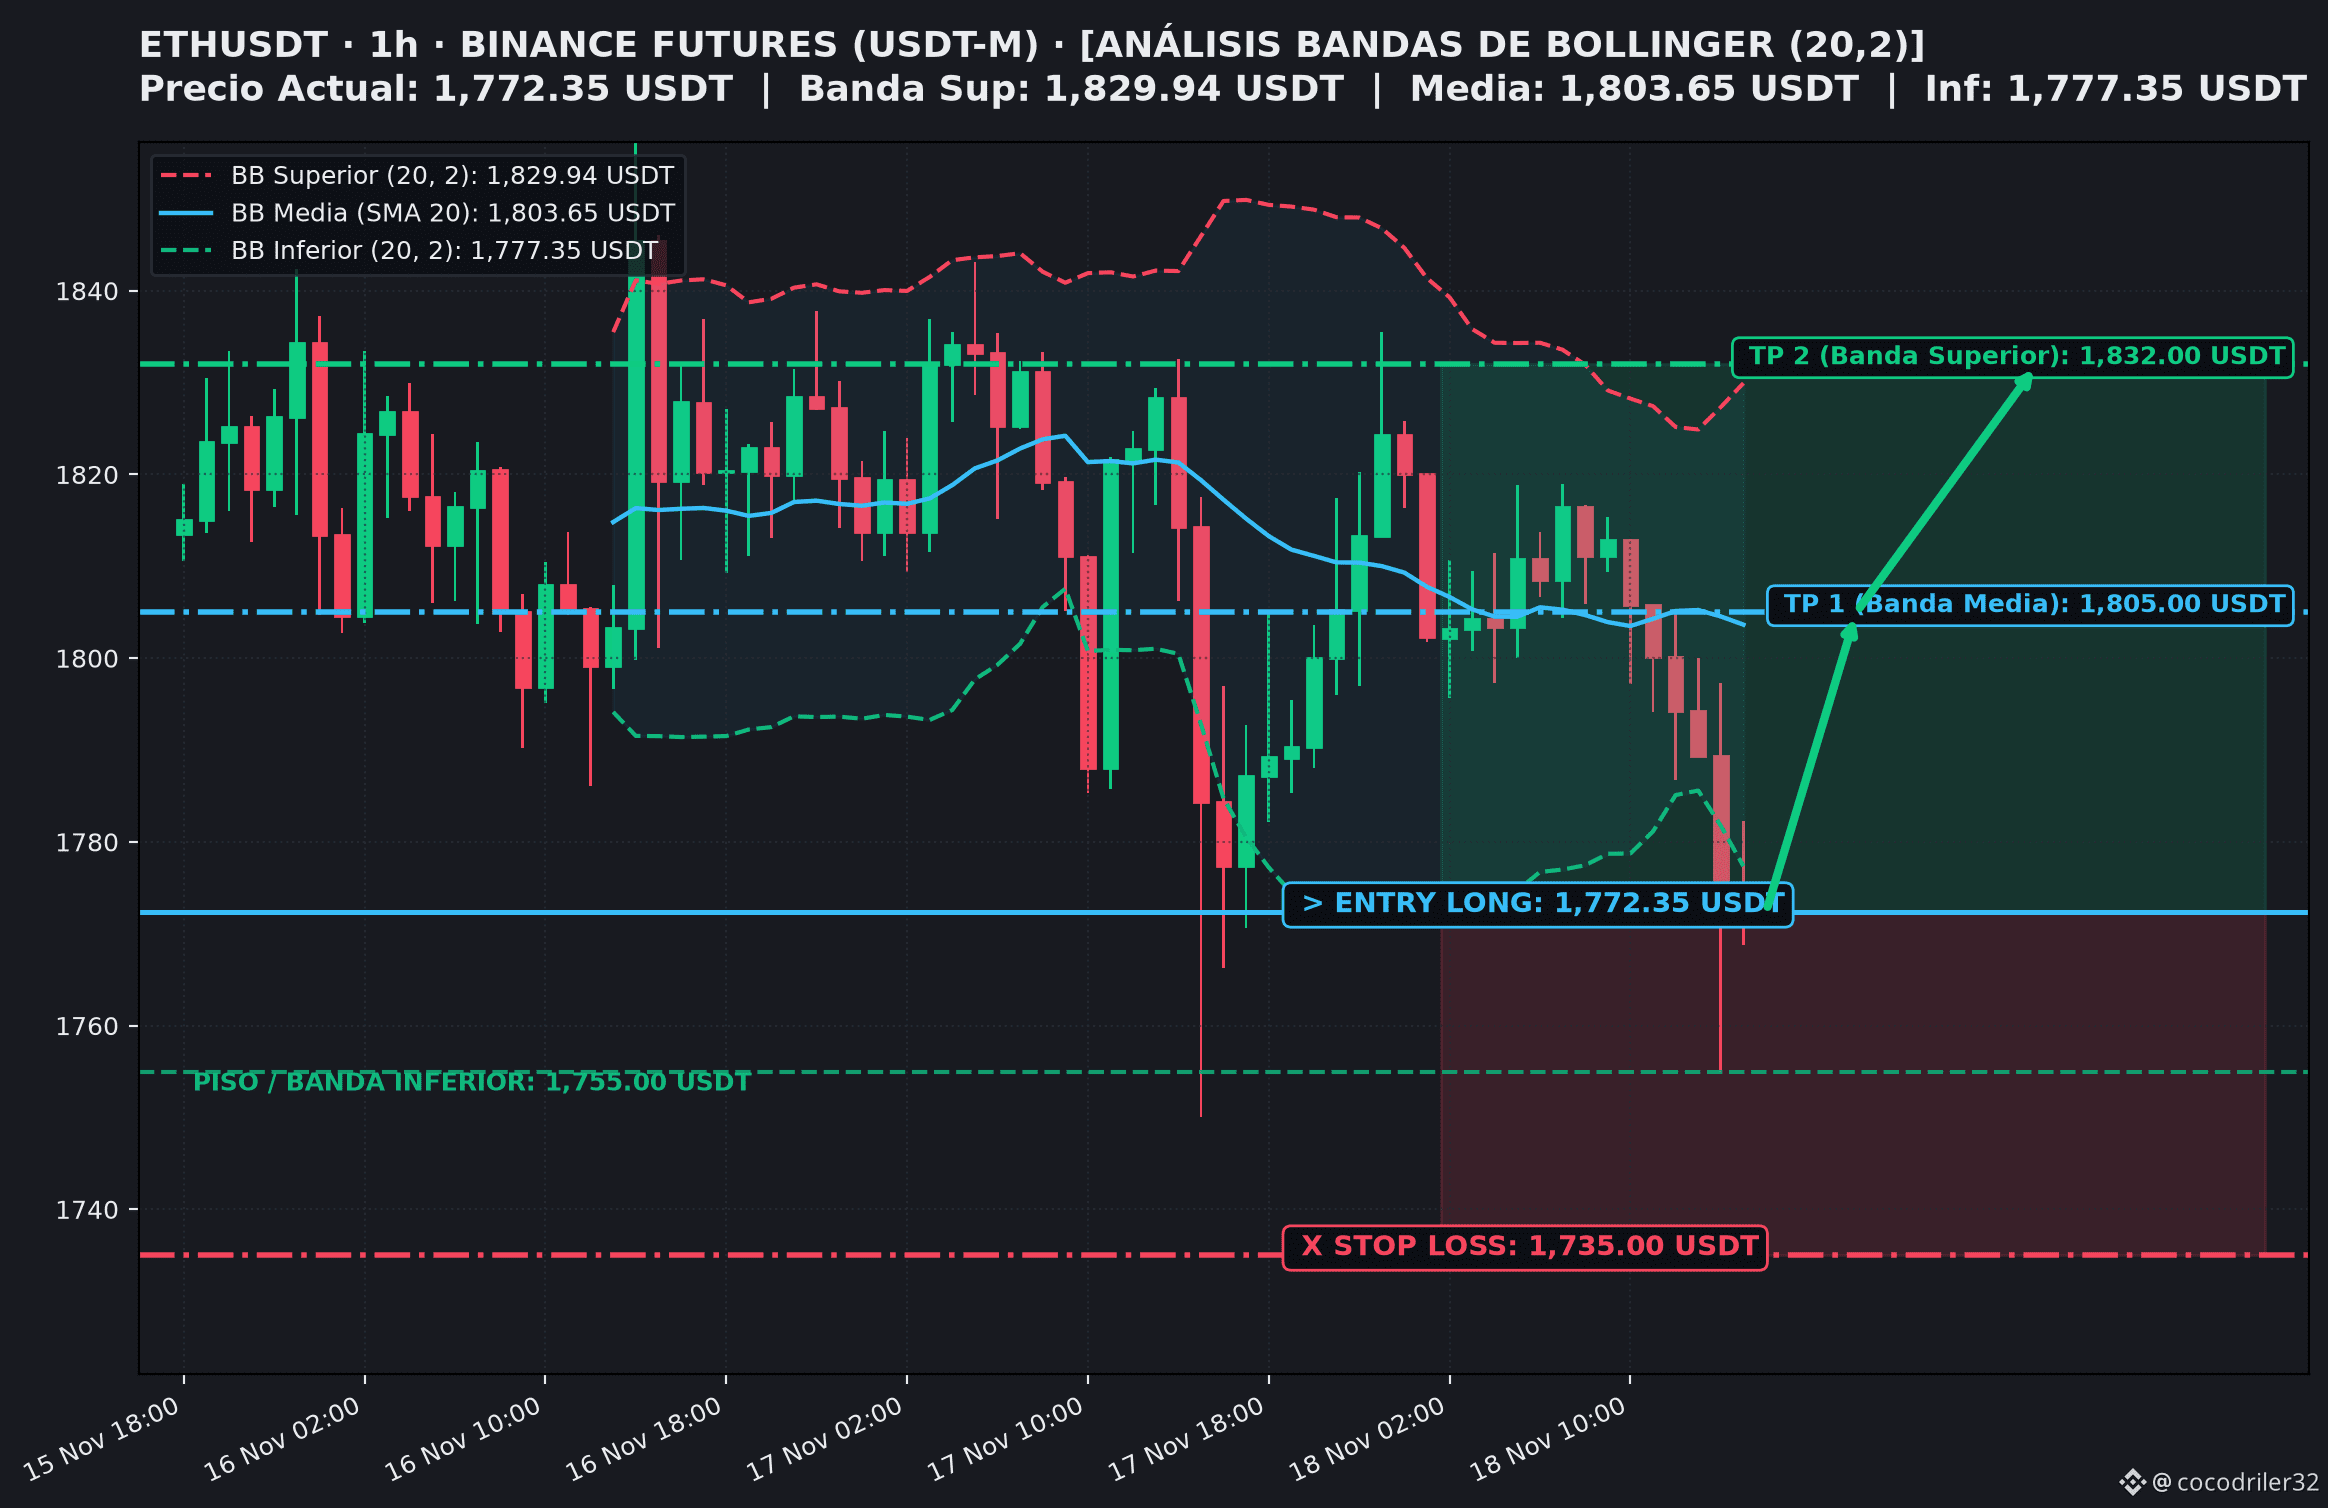
The ETHUSDT pair (Binance Futures) has completed a clear double-bottom pattern on the 1H timeframe, testing the critical support zone at 1,750.00 - 1,755.00 USDT and temporarily breaking below the Lower Bollinger Band (1,777.35 USDT). After forming absorption wicks amid strong buying volume and with the RSI in extreme oversold territory (< 28 pts), the market confirms seller exhaustion and looks for a technical reversal to the mean.
📌 Key Setup Points (Long / Support Bounce):
🎯 Entry Point: 1,772.35 USDT (confirmation of buying absorption after testing the Lower Band)
🛑 Stop Loss: 1,735.00 USDT (wide and protected, below the double bottom at 1,750.00 USDT to avoid liquidity hunts)
💰 Target 1 (TP1): 1,805.00 USDT (reversal toward the Middle Band / SMA 20)
🚀 Target 2 (TP2): 1,832.00 USDT (bullish expansion toward the Upper Bollinger Band)
⚖️ R:R Ratio: 1:0.87 at TP1 | 1:1.59 at TP2 (conservative approach, securing partial profits at the moving average)
🧠 Technical Rationale and Risk Management:
- Structural Double Bottom: Two consecutive tests at 1,750.00 and 1,755.00 USDT were aggressively rejected by buyers, establishing a solid floor.
- Wide Anti-Wick Stop Loss: Set at 1,735.00 USDT, providing a buffer of more than 15 USDT below the sweep low to prevent short-term manipulation from closing the trade.
- Trading Plan: Take partial profits when TP1 (1,805.00 USDT) is reached and immediately move the Stop Loss to the entry price (Breakeven).
👉 Do you trade bounces at major Ethereum support levels? Follow us for more daily technical analysis!
👇 Do you think ETH will strongly break above 1,805 USDT and reach new highs, or will it test 1,750 USDT again? Share your thoughts!
#BinanceSquare #CryptoTrading #BollingerBands #FuturesTrading $BTC $ETH
ANALYSIS $ETH (1H): Double Bottom and Long Reversal Setup at the Lower Band 📈⚡
The ETHUSDT pair (Binance Futures) has completed a clear double-bottom pattern on the 1H timeframe, testing the critical support zone at 1,750.00 - 1,755.00 USDT and temporarily breaking below the Lower Bollinger Band (1,777.35 USDT). After forming absorption wicks amid strong buying volume and with the RSI in extreme oversold territory (< 28 pts), the market confirms seller exhaustion and looks for a technical reversal to the mean.
📌 Key Setup Points (Long / Support Bounce):
🎯 Entry Point: 1,772.35 USDT (confirmation of buying absorption after testing the Lower Band)
🛑 Stop Loss: 1,735.00 USDT (wide and protected, below the double bottom at 1,750.00 USDT to avoid liquidity hunts)
💰 Target 1 (TP1): 1,805.00 USDT (reversal toward the Middle Band / SMA 20)
🚀 Target 2 (TP2): 1,832.00 USDT (bullish expansion toward the Upper Bollinger Band)
⚖️ R:R Ratio: 1:0.87 at TP1 | 1:1.59 at TP2 (conservative approach, securing partial profits at the moving average)
🧠 Technical Rationale and Risk Management:
- Structural Double Bottom: Two consecutive tests at 1,750.00 and 1,755.00 USDT were aggressively rejected by buyers, establishing a solid floor.
- Wide Anti-Wick Stop Loss: Set at 1,735.00 USDT, providing a buffer of more than 15 USDT below the sweep low to prevent short-term manipulation from closing the trade.
- Trading Plan: Take partial profits when TP1 (1,805.00 USDT) is reached and immediately move the Stop Loss to the entry price (Breakeven).
👉 Do you trade bounces at major Ethereum support levels? Follow us for more daily technical analysis!
👇 Do you think ETH will strongly break above 1,805 USDT and reach new highs, or will it test 1,750 USDT again? Share your thoughts!
#BinanceSquare #CryptoTrading #BollingerBands #FuturesTrading $BTC $ETH
The ETHUSDT pair (Binance Futures) has completed a clear double-bottom pattern on the 1H timeframe, testing the critical support zone at 1,750.00 - 1,755.00 USDT and temporarily breaking below the Lower Bollinger Band (1,777.35 USDT). After forming absorption wicks amid strong buying volume and with the RSI in extreme oversold territory (< 28 pts), the market confirms seller exhaustion and looks for a technical reversal to the mean.
📌 Key Setup Points (Long / Support Bounce):
🎯 Entry Point: 1,772.35 USDT (confirmation of buying absorption after testing the Lower Band)
🛑 Stop Loss: 1,735.00 USDT (wide and protected, below the double bottom at 1,750.00 USDT to avoid liquidity hunts)
💰 Target 1 (TP1): 1,805.00 USDT (reversal toward the Middle Band / SMA 20)
🚀 Target 2 (TP2): 1,832.00 USDT (bullish expansion toward the Upper Bollinger Band)
⚖️ R:R Ratio: 1:0.87 at TP1 | 1:1.59 at TP2 (conservative approach, securing partial profits at the moving average)
🧠 Technical Rationale and Risk Management:
- Structural Double Bottom: Two consecutive tests at 1,750.00 and 1,755.00 USDT were aggressively rejected by buyers, establishing a solid floor.
- Wide Anti-Wick Stop Loss: Set at 1,735.00 USDT, providing a buffer of more than 15 USDT below the sweep low to prevent short-term manipulation from closing the trade.
- Trading Plan: Take partial profits when TP1 (1,805.00 USDT) is reached and immediately move the Stop Loss to the entry price (Breakeven).
👉 Do you trade bounces at major Ethereum support levels? Follow us for more daily technical analysis!
👇 Do you think ETH will strongly break above 1,805 USDT and reach new highs, or will it test 1,750 USDT again? Share your thoughts!
#BinanceSquare #CryptoTrading #BollingerBands #FuturesTrading $BTC $ETH
2
167
·
--
ANALYSIS $FF (1H): Double Top at the Upper Band and Short Setup with a Wide Stop 📉⚡
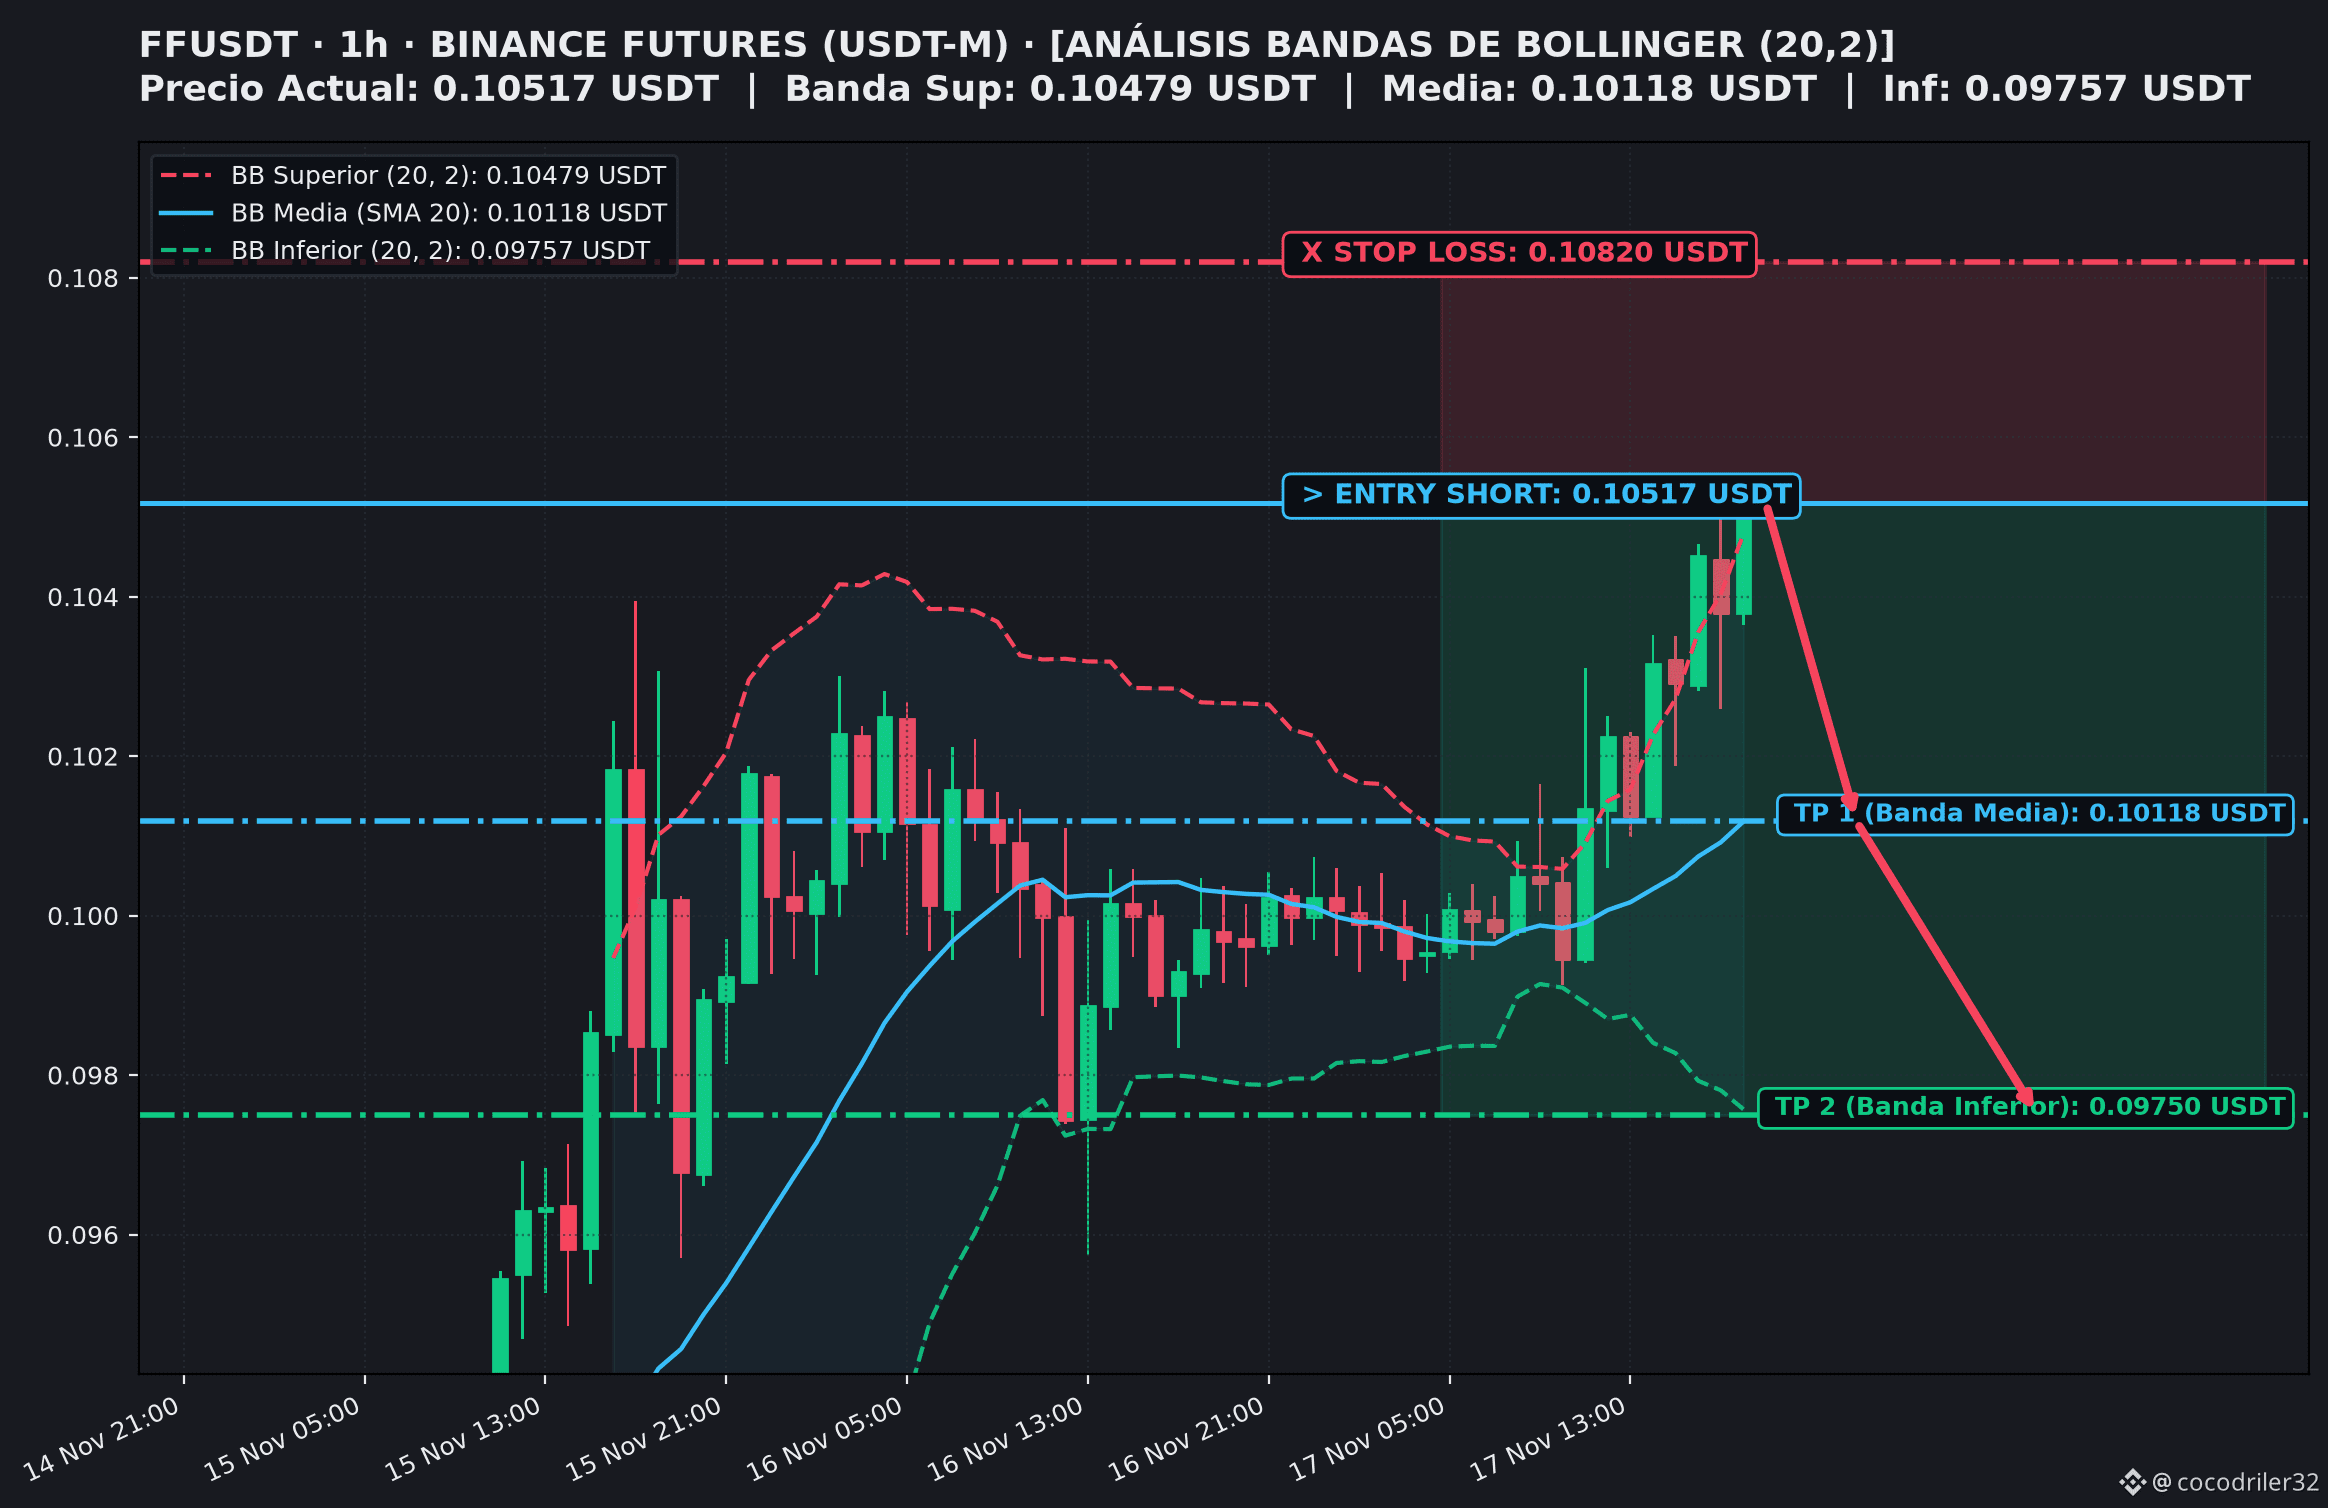
The FFUSDT pair (Binance Futures) is showing clear signs of buyer exhaustion after forming a double top with rejection wicks at 0.10537 USDT, trading above its Upper Bollinger Band (0.10479 USDT). With the RSI above 73 on the 1H timeframe, the asset is entering a zone favorable for a reversion to the mean.
📌 Key Setup Points (Short / Mean Reversion):
🎯 Entry Point: 0.10517 USDT (overextended rejection zone outside the bands)
🛑 Stop Loss: 0.10820 USDT (wide and protected, above the local double top)
💰 Target 1 (TP1): 0.10118 USDT (natural move back toward the Middle Band / SMA 20)
🚀 Target 2 (TP2): 0.09750 USDT (corrective extension toward the Lower Band)
⚖️ R:R Ratio: 1:1.32 at TP1 | 1:2.53 at TP2
🧠 Technical Rationale and Risk Management:
- Double Top at the Upper Band: Unable to establish new highs above 0.1053 USDT, leaving wicks showing selling pressure.
- Wide Stop Loss: Set with extra room as a precaution to prevent liquidity-sweep wicks from affecting the position before the pullback.
- Position Management: Take partial profits when price reaches the SMA 20 (TP1) and move the Stop Loss to the entry price (breakeven).
👉 Are you keeping a close eye on opportunities in futures and trending tokens? Follow us for market alerts and daily analysis!
👇 Do you think FF will correct straight toward 0.101 USDT, or will it make another attempt at the highs? Share your opinion in the comments!
#BinanceSquare #CryptoTrading #BollingerBands #FuturesTrading $BTC $FF
ANALYSIS $FF (1H): Double Top at the Upper Band and Short Setup with a Wide Stop 📉⚡
The FFUSDT pair (Binance Futures) is showing clear signs of buyer exhaustion after forming a double top with rejection wicks at 0.10537 USDT, trading above its Upper Bollinger Band (0.10479 USDT). With the RSI above 73 on the 1H timeframe, the asset is entering a zone favorable for a reversion to the mean.
📌 Key Setup Points (Short / Mean Reversion):
🎯 Entry Point: 0.10517 USDT (overextended rejection zone outside the bands)
🛑 Stop Loss: 0.10820 USDT (wide and protected, above the local double top)
💰 Target 1 (TP1): 0.10118 USDT (natural move back toward the Middle Band / SMA 20)
🚀 Target 2 (TP2): 0.09750 USDT (corrective extension toward the Lower Band)
⚖️ R:R Ratio: 1:1.32 at TP1 | 1:2.53 at TP2
🧠 Technical Rationale and Risk Management:
- Double Top at the Upper Band: Unable to establish new highs above 0.1053 USDT, leaving wicks showing selling pressure.
- Wide Stop Loss: Set with extra room as a precaution to prevent liquidity-sweep wicks from affecting the position before the pullback.
- Position Management: Take partial profits when price reaches the SMA 20 (TP1) and move the Stop Loss to the entry price (breakeven).
👉 Are you keeping a close eye on opportunities in futures and trending tokens? Follow us for market alerts and daily analysis!
👇 Do you think FF will correct straight toward 0.101 USDT, or will it make another attempt at the highs? Share your opinion in the comments!
#BinanceSquare #CryptoTrading #BollingerBands #FuturesTrading $BTC $FF
The FFUSDT pair (Binance Futures) is showing clear signs of buyer exhaustion after forming a double top with rejection wicks at 0.10537 USDT, trading above its Upper Bollinger Band (0.10479 USDT). With the RSI above 73 on the 1H timeframe, the asset is entering a zone favorable for a reversion to the mean.
📌 Key Setup Points (Short / Mean Reversion):
🎯 Entry Point: 0.10517 USDT (overextended rejection zone outside the bands)
🛑 Stop Loss: 0.10820 USDT (wide and protected, above the local double top)
💰 Target 1 (TP1): 0.10118 USDT (natural move back toward the Middle Band / SMA 20)
🚀 Target 2 (TP2): 0.09750 USDT (corrective extension toward the Lower Band)
⚖️ R:R Ratio: 1:1.32 at TP1 | 1:2.53 at TP2
🧠 Technical Rationale and Risk Management:
- Double Top at the Upper Band: Unable to establish new highs above 0.1053 USDT, leaving wicks showing selling pressure.
- Wide Stop Loss: Set with extra room as a precaution to prevent liquidity-sweep wicks from affecting the position before the pullback.
- Position Management: Take partial profits when price reaches the SMA 20 (TP1) and move the Stop Loss to the entry price (breakeven).
👉 Are you keeping a close eye on opportunities in futures and trending tokens? Follow us for market alerts and daily analysis!
👇 Do you think FF will correct straight toward 0.101 USDT, or will it make another attempt at the highs? Share your opinion in the comments!
#BinanceSquare #CryptoTrading #BollingerBands #FuturesTrading $BTC $FF
3
400
·
--
ANALYSIS $BREV (1H): Parabolic Overextension (+60%) and Short Setup with a Wide Stop 📉⚡
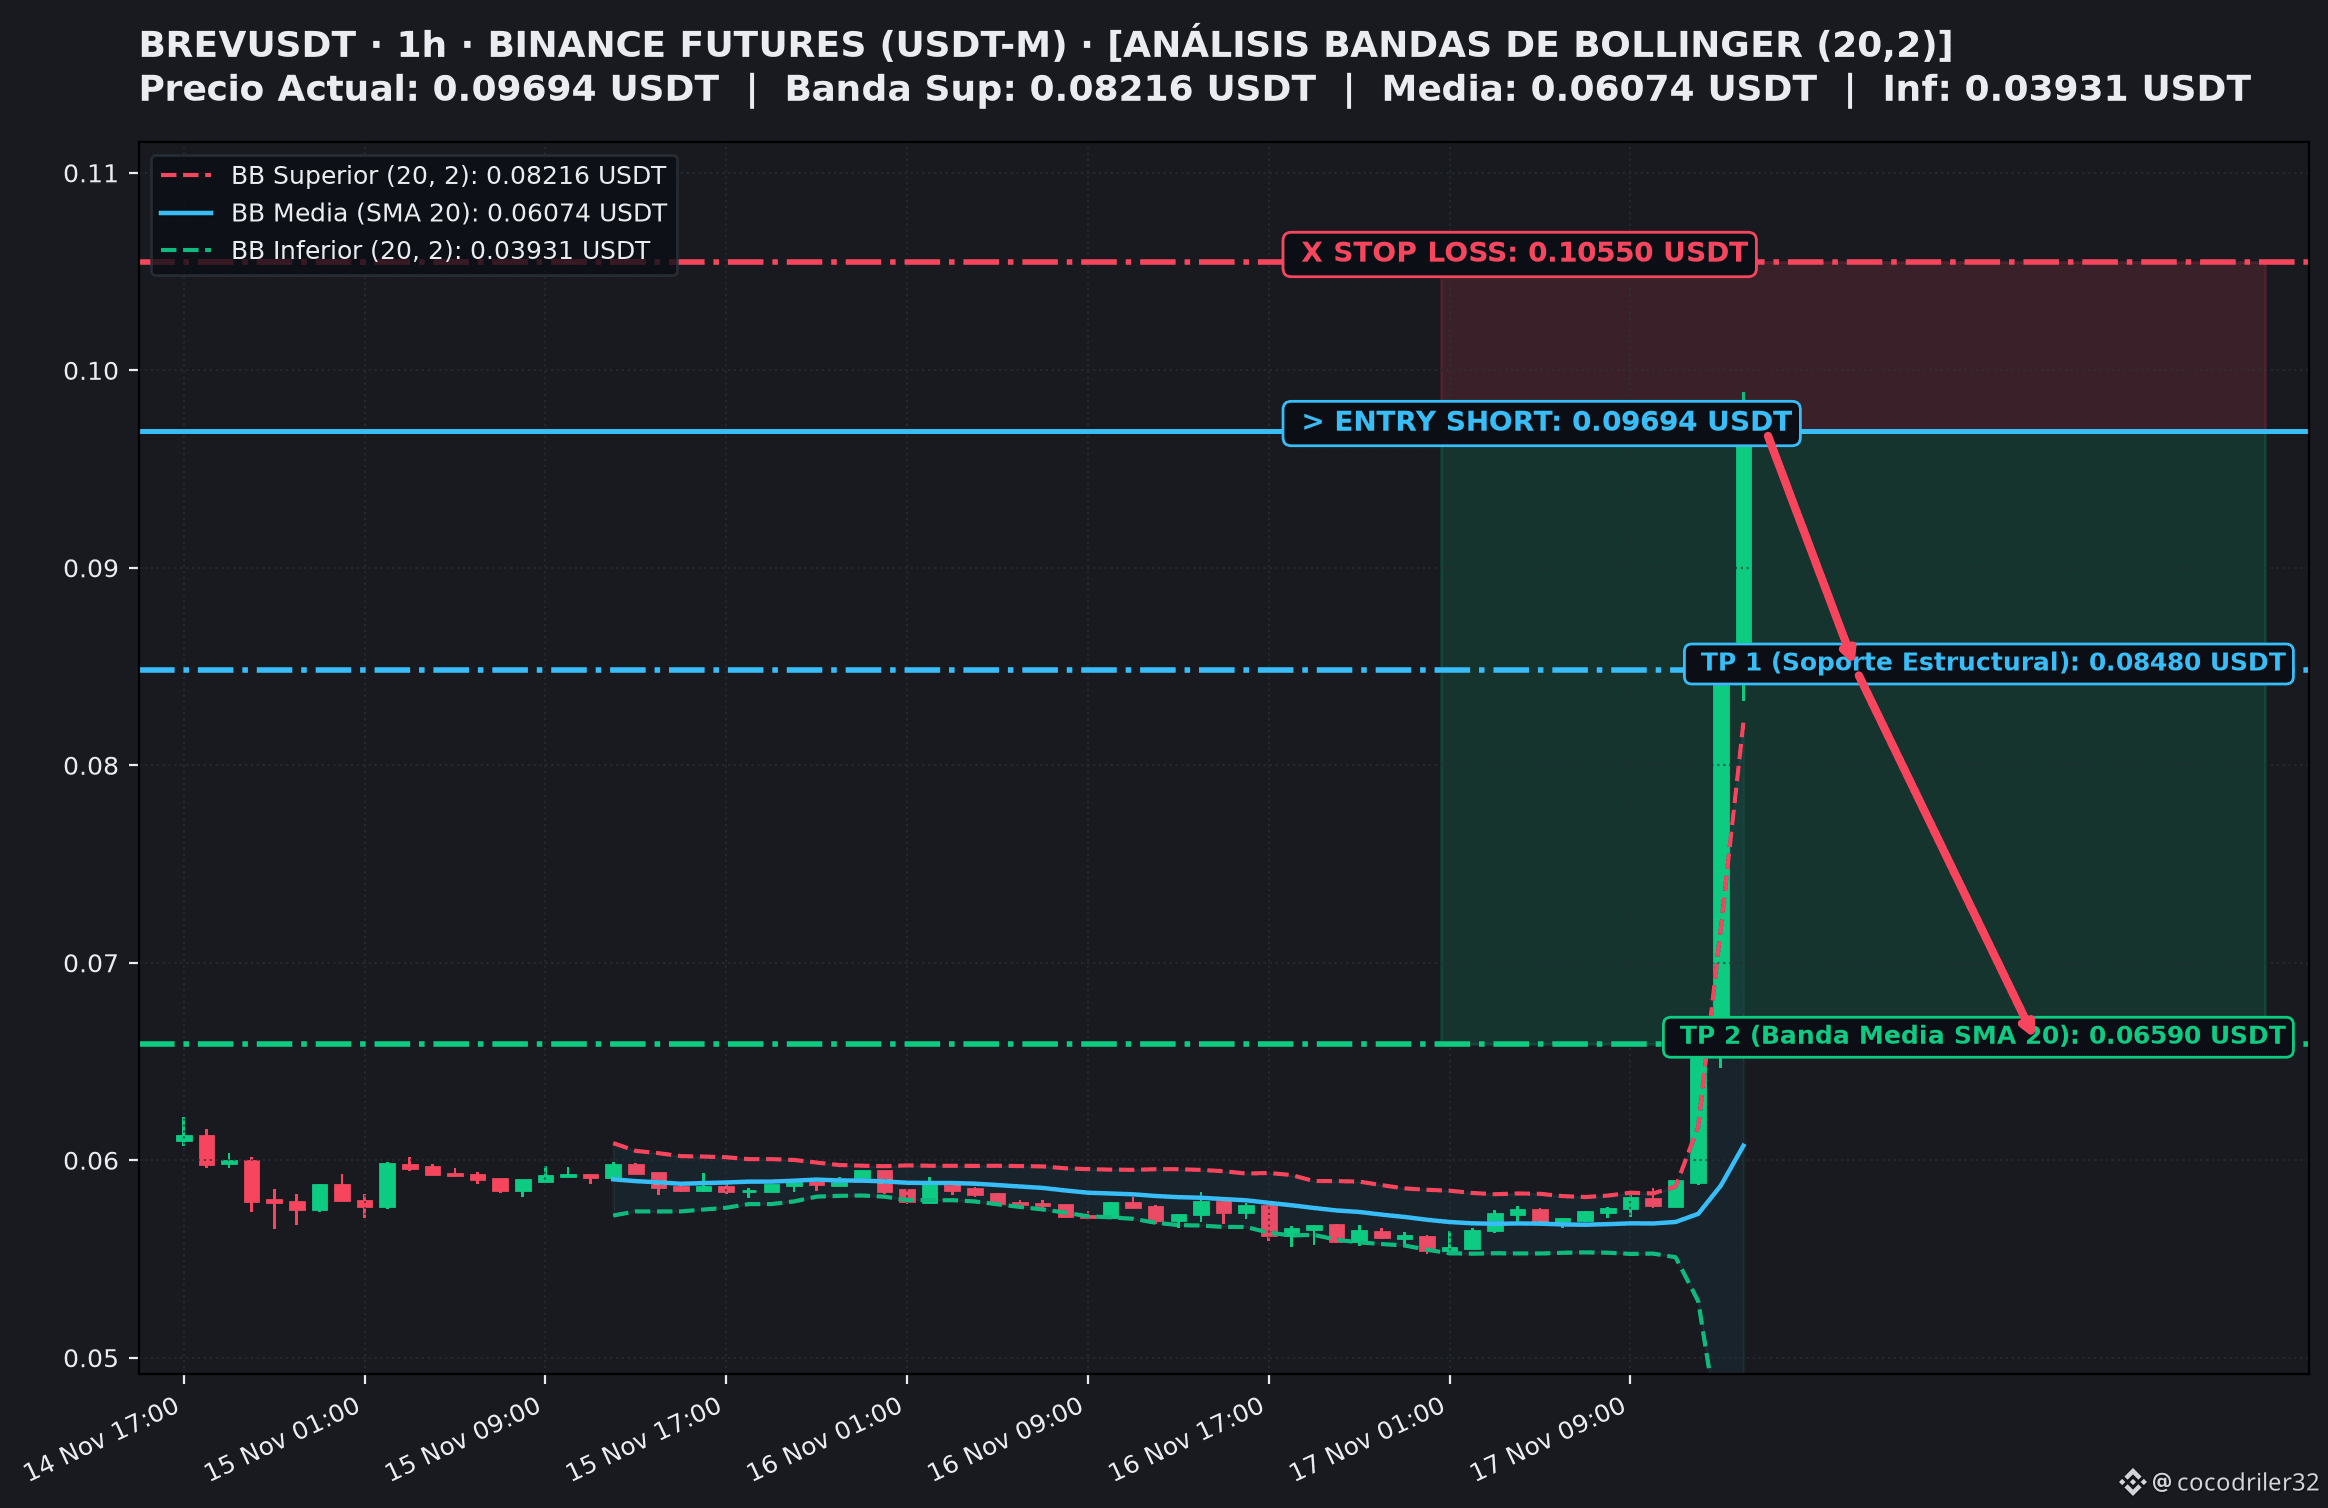
The BREVUSDT pair (Binance Futures) has surged vertically by more than +60% in recent hours, trading completely outside its Upper Bollinger Band (0.08216 USDT). With the RSI above 97 on the 1H timeframe, the asset has entered an extreme buying-climax zone, with a high probability of a corrective pullback toward the mean.
📌 Setup Key Points (Short / Mean Reversion):
🎯 Entry Point: 0.09694 USDT (overextension zone outside the bands)
🛑 Stop Loss: 0.10550 USDT (wide and protected, above the psychological 0.10 USDT barrier)
💰 Target 1 (TP1): 0.08480 USDT (structural support and previous breakout level)
🚀 Target 2 (TP2): 0.06590 USDT (reversion toward the Middle Band / SMA 20)
⚖️ R:R Ratio: 1:1.42 at TP1 | 1:3.62 at TP2
🧠 Technical Rationale and Risk Management:
- Statistical Bollinger Anomaly: Less than 2% of the time can price sustain a vertical move outside the Upper Band without reverting toward the SMA 20.
- Protected Stop Loss: Set with a wide margin above 0.1000 USDT to avoid liquidity hunts and volatility wicks before the pullback develops.
- Position Management: Secure profits at TP1 and move the Stop Loss to the entry price (Breakeven) once the correction is confirmed to have begun.
👉 Do you trade trending, high-volatility tokens in futures? Follow us for market alerts and daily setups!
👇 Do you think BREV will correct toward 0.065 USDT or try to hold above 0.10 USDT? Let us know in the comments!
#BinanceSquare #CryptoTrading #BollingerBands #FuturesTrading $BTC $BREV
ANALYSIS $BREV (1H): Parabolic Overextension (+60%) and Short Setup with a Wide Stop 📉⚡
The BREVUSDT pair (Binance Futures) has surged vertically by more than +60% in recent hours, trading completely outside its Upper Bollinger Band (0.08216 USDT). With the RSI above 97 on the 1H timeframe, the asset has entered an extreme buying-climax zone, with a high probability of a corrective pullback toward the mean.
📌 Setup Key Points (Short / Mean Reversion):
🎯 Entry Point: 0.09694 USDT (overextension zone outside the bands)
🛑 Stop Loss: 0.10550 USDT (wide and protected, above the psychological 0.10 USDT barrier)
💰 Target 1 (TP1): 0.08480 USDT (structural support and previous breakout level)
🚀 Target 2 (TP2): 0.06590 USDT (reversion toward the Middle Band / SMA 20)
⚖️ R:R Ratio: 1:1.42 at TP1 | 1:3.62 at TP2
🧠 Technical Rationale and Risk Management:
- Statistical Bollinger Anomaly: Less than 2% of the time can price sustain a vertical move outside the Upper Band without reverting toward the SMA 20.
- Protected Stop Loss: Set with a wide margin above 0.1000 USDT to avoid liquidity hunts and volatility wicks before the pullback develops.
- Position Management: Secure profits at TP1 and move the Stop Loss to the entry price (Breakeven) once the correction is confirmed to have begun.
👉 Do you trade trending, high-volatility tokens in futures? Follow us for market alerts and daily setups!
👇 Do you think BREV will correct toward 0.065 USDT or try to hold above 0.10 USDT? Let us know in the comments!
#BinanceSquare #CryptoTrading #BollingerBands #FuturesTrading $BTC $BREV
The BREVUSDT pair (Binance Futures) has surged vertically by more than +60% in recent hours, trading completely outside its Upper Bollinger Band (0.08216 USDT). With the RSI above 97 on the 1H timeframe, the asset has entered an extreme buying-climax zone, with a high probability of a corrective pullback toward the mean.
📌 Setup Key Points (Short / Mean Reversion):
🎯 Entry Point: 0.09694 USDT (overextension zone outside the bands)
🛑 Stop Loss: 0.10550 USDT (wide and protected, above the psychological 0.10 USDT barrier)
💰 Target 1 (TP1): 0.08480 USDT (structural support and previous breakout level)
🚀 Target 2 (TP2): 0.06590 USDT (reversion toward the Middle Band / SMA 20)
⚖️ R:R Ratio: 1:1.42 at TP1 | 1:3.62 at TP2
🧠 Technical Rationale and Risk Management:
- Statistical Bollinger Anomaly: Less than 2% of the time can price sustain a vertical move outside the Upper Band without reverting toward the SMA 20.
- Protected Stop Loss: Set with a wide margin above 0.1000 USDT to avoid liquidity hunts and volatility wicks before the pullback develops.
- Position Management: Secure profits at TP1 and move the Stop Loss to the entry price (Breakeven) once the correction is confirmed to have begun.
👉 Do you trade trending, high-volatility tokens in futures? Follow us for market alerts and daily setups!
👇 Do you think BREV will correct toward 0.065 USDT or try to hold above 0.10 USDT? Let us know in the comments!
#BinanceSquare #CryptoTrading #BollingerBands #FuturesTrading $BTC $BREV
1
2
948
·
--
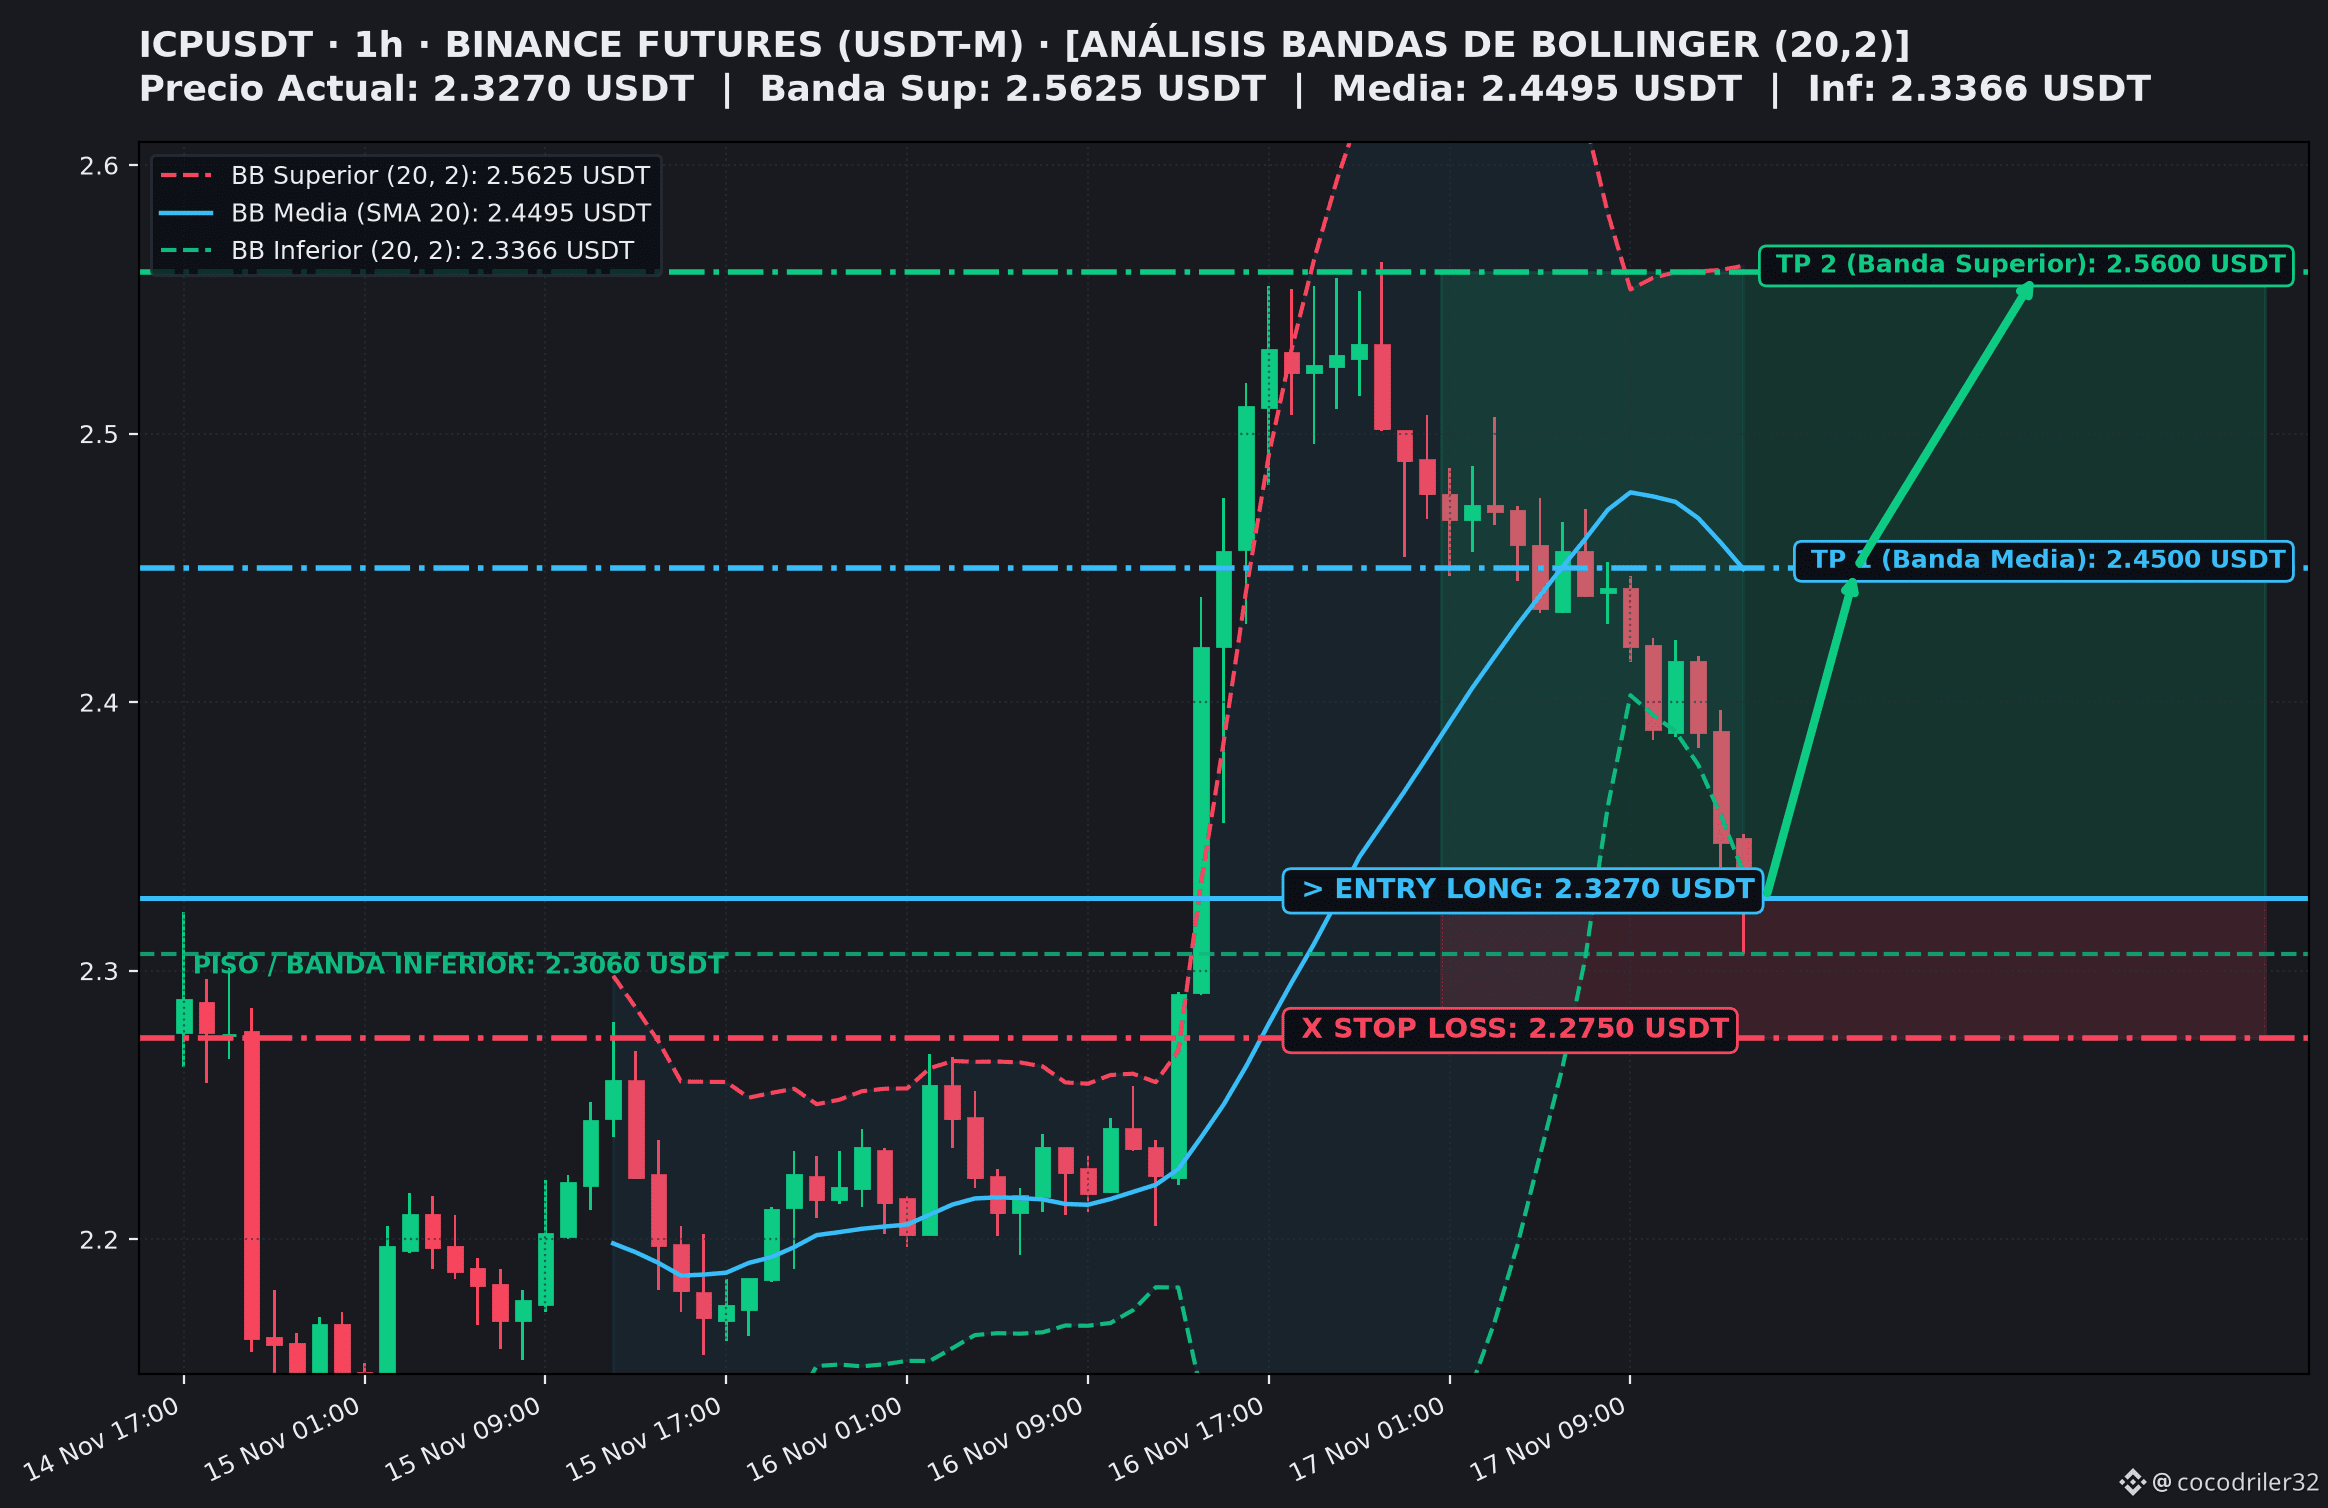
ANALYSIS $ICP (1H): Bounce at the Lower Band and Long Setup in Extreme Oversold Conditions 📈⚡
The ICPUSDT pair (Binance Futures) has completed an orderly correction, breaking through the Lower Bollinger Band (2.3366 USDT) and reaching an RSI below 21 on the 1H timeframe. After absorbing selling pressure at the key support zone, the price is showing clear signs of bearish exhaustion and a move toward mean reversion.
📌 Setup Key Points (Long / Support Bounce):
🎯 Entry Point: 2.3270 USDT (breakthrough and test of the Lower Band)
🛑 Stop Loss: 2.2750 USDT (with ample room and protected, below the 2.3060 USDT low and 2.3000 USDT support)
💰 Target 1 (TP1): 2.4500 USDT (natural return toward the Middle Band / SMA 20)
🚀 Target 2 (TP2): 2.5600 USDT (bullish expansion toward the Upper Bollinger Band)
⚖️ R:R Ratio: 1:2.37 at TP1 | 1:4.48 at TP2
🧠 Technical Rationale and Risk Management:
- Extreme Oversold Conditions at the Bollinger Band: With the price below the Lower Band and an RSI at 20, statistical probability favors a relief bounce toward the SMA 20.
- Stop Loss with Ample Room: Strategically placed below 2.3000 USDT to prevent liquidity-sweep wicks from closing the position before the bullish move.
- Trading Plan: Secure partial profits at TP1 and move the Stop Loss to the entry price (Breakeven) to manage risk optimally.
👉 Interested in technical analysis of assets in oversold zones and daily setups? Follow us for more exclusive content!
👇 Do you think ICP will strongly recover to 2.45 USDT, or will it continue consolidating at the bottom? Let us know in the comments!
#BinanceSquare #CryptoTrading #BollingerBands #FuturesTrading $BTC $ICP
ANALYSIS $ICP (1H): Bounce at the Lower Band and Long Setup in Extreme Oversold Conditions 📈⚡
The ICPUSDT pair (Binance Futures) has completed an orderly correction, breaking through the Lower Bollinger Band (2.3366 USDT) and reaching an RSI below 21 on the 1H timeframe. After absorbing selling pressure at the key support zone, the price is showing clear signs of bearish exhaustion and a move toward mean reversion.
📌 Setup Key Points (Long / Support Bounce):
🎯 Entry Point: 2.3270 USDT (breakthrough and test of the Lower Band)
🛑 Stop Loss: 2.2750 USDT (with ample room and protected, below the 2.3060 USDT low and 2.3000 USDT support)
💰 Target 1 (TP1): 2.4500 USDT (natural return toward the Middle Band / SMA 20)
🚀 Target 2 (TP2): 2.5600 USDT (bullish expansion toward the Upper Bollinger Band)
⚖️ R:R Ratio: 1:2.37 at TP1 | 1:4.48 at TP2
🧠 Technical Rationale and Risk Management:
- Extreme Oversold Conditions at the Bollinger Band: With the price below the Lower Band and an RSI at 20, statistical probability favors a relief bounce toward the SMA 20.
- Stop Loss with Ample Room: Strategically placed below 2.3000 USDT to prevent liquidity-sweep wicks from closing the position before the bullish move.
- Trading Plan: Secure partial profits at TP1 and move the Stop Loss to the entry price (Breakeven) to manage risk optimally.
👉 Interested in technical analysis of assets in oversold zones and daily setups? Follow us for more exclusive content!
👇 Do you think ICP will strongly recover to 2.45 USDT, or will it continue consolidating at the bottom? Let us know in the comments!
#BinanceSquare #CryptoTrading #BollingerBands #FuturesTrading $BTC $ICP
The ICPUSDT pair (Binance Futures) has completed an orderly correction, breaking through the Lower Bollinger Band (2.3366 USDT) and reaching an RSI below 21 on the 1H timeframe. After absorbing selling pressure at the key support zone, the price is showing clear signs of bearish exhaustion and a move toward mean reversion.
📌 Setup Key Points (Long / Support Bounce):
🎯 Entry Point: 2.3270 USDT (breakthrough and test of the Lower Band)
🛑 Stop Loss: 2.2750 USDT (with ample room and protected, below the 2.3060 USDT low and 2.3000 USDT support)
💰 Target 1 (TP1): 2.4500 USDT (natural return toward the Middle Band / SMA 20)
🚀 Target 2 (TP2): 2.5600 USDT (bullish expansion toward the Upper Bollinger Band)
⚖️ R:R Ratio: 1:2.37 at TP1 | 1:4.48 at TP2
🧠 Technical Rationale and Risk Management:
- Extreme Oversold Conditions at the Bollinger Band: With the price below the Lower Band and an RSI at 20, statistical probability favors a relief bounce toward the SMA 20.
- Stop Loss with Ample Room: Strategically placed below 2.3000 USDT to prevent liquidity-sweep wicks from closing the position before the bullish move.
- Trading Plan: Secure partial profits at TP1 and move the Stop Loss to the entry price (Breakeven) to manage risk optimally.
👉 Interested in technical analysis of assets in oversold zones and daily setups? Follow us for more exclusive content!
👇 Do you think ICP will strongly recover to 2.45 USDT, or will it continue consolidating at the bottom? Let us know in the comments!
#BinanceSquare #CryptoTrading #BollingerBands #FuturesTrading $BTC $ICP
4
442
·
--
ANALYSIS $SPACE (1H): Double Top at the Upper Band and Short Setup with a Wide Stop 📉⚡
The SPACEUSDT pair (Binance Futures) has surged +45% in 24h, breaking above the Upper Bollinger Band (0.004051 USDT) and forming a clear double-top rejection, with wicks at 0.004337 USDT. With the 1H RSI near 90, the asset is entering overbought climax territory, increasing the likelihood of a reversal toward the mean.
📌 Key Setup Points (Short / Reversal with a Wide Stop):
🎯 Entry Point: 0.004240 USDT (overextended rejection zone outside the bands)
🛑 Stop Loss: 0.004580 USDT (wide and protected, above the liquidity-hunting wicks)
💰 Target 1 (TP1): 0.003650 USDT (structural support and base of the previous consolidation)
🚀 Target 2 (TP2): 0.003300 USDT (reversal toward the Middle Band / SMA 20)
⚖️ R:R Ratio: 1:1.74 at TP1 | 1:2.76 at TP2
🧠 Technical Rationale and Risk Management:
- Double Top and Exhaustion: Consecutive rejection around 0.00433 USDT, showing declining volume at the highs.
- Wide Stop Loss: Designed with an extra safety margin to avoid liquidity hunts or aggressive wicks before bearish consolidation.
- Execution Plan: Secure profits at TP1 and move the Stop Loss to the entry price (Breakeven) once the move toward the SMA 20 is confirmed.
👉 Do you trade highly volatile tokens in futures? Follow us for updated technical analysis and daily setups!
👇 Do you think SPACE will move toward the Middle Band at 0.00330 USDT, or attempt another run at 0.00450 USDT? Let us know in the comments!
#BinanceSquare #CryptoTrading #BollingerBands #FuturesTrading $BTC $SPACE
ANALYSIS $SPACE (1H): Double Top at the Upper Band and Short Setup with a Wide Stop 📉⚡
The SPACEUSDT pair (Binance Futures) has surged +45% in 24h, breaking above the Upper Bollinger Band (0.004051 USDT) and forming a clear double-top rejection, with wicks at 0.004337 USDT. With the 1H RSI near 90, the asset is entering overbought climax territory, increasing the likelihood of a reversal toward the mean.
📌 Key Setup Points (Short / Reversal with a Wide Stop):
🎯 Entry Point: 0.004240 USDT (overextended rejection zone outside the bands)
🛑 Stop Loss: 0.004580 USDT (wide and protected, above the liquidity-hunting wicks)
💰 Target 1 (TP1): 0.003650 USDT (structural support and base of the previous consolidation)
🚀 Target 2 (TP2): 0.003300 USDT (reversal toward the Middle Band / SMA 20)
⚖️ R:R Ratio: 1:1.74 at TP1 | 1:2.76 at TP2
🧠 Technical Rationale and Risk Management:
- Double Top and Exhaustion: Consecutive rejection around 0.00433 USDT, showing declining volume at the highs.
- Wide Stop Loss: Designed with an extra safety margin to avoid liquidity hunts or aggressive wicks before bearish consolidation.
- Execution Plan: Secure profits at TP1 and move the Stop Loss to the entry price (Breakeven) once the move toward the SMA 20 is confirmed.
👉 Do you trade highly volatile tokens in futures? Follow us for updated technical analysis and daily setups!
👇 Do you think SPACE will move toward the Middle Band at 0.00330 USDT, or attempt another run at 0.00450 USDT? Let us know in the comments!
#BinanceSquare #CryptoTrading #BollingerBands #FuturesTrading $BTC $SPACE
The SPACEUSDT pair (Binance Futures) has surged +45% in 24h, breaking above the Upper Bollinger Band (0.004051 USDT) and forming a clear double-top rejection, with wicks at 0.004337 USDT. With the 1H RSI near 90, the asset is entering overbought climax territory, increasing the likelihood of a reversal toward the mean.
📌 Key Setup Points (Short / Reversal with a Wide Stop):
🎯 Entry Point: 0.004240 USDT (overextended rejection zone outside the bands)
🛑 Stop Loss: 0.004580 USDT (wide and protected, above the liquidity-hunting wicks)
💰 Target 1 (TP1): 0.003650 USDT (structural support and base of the previous consolidation)
🚀 Target 2 (TP2): 0.003300 USDT (reversal toward the Middle Band / SMA 20)
⚖️ R:R Ratio: 1:1.74 at TP1 | 1:2.76 at TP2
🧠 Technical Rationale and Risk Management:
- Double Top and Exhaustion: Consecutive rejection around 0.00433 USDT, showing declining volume at the highs.
- Wide Stop Loss: Designed with an extra safety margin to avoid liquidity hunts or aggressive wicks before bearish consolidation.
- Execution Plan: Secure profits at TP1 and move the Stop Loss to the entry price (Breakeven) once the move toward the SMA 20 is confirmed.
👉 Do you trade highly volatile tokens in futures? Follow us for updated technical analysis and daily setups!
👇 Do you think SPACE will move toward the Middle Band at 0.00330 USDT, or attempt another run at 0.00450 USDT? Let us know in the comments!
#BinanceSquare #CryptoTrading #BollingerBands #FuturesTrading $BTC $SPACE
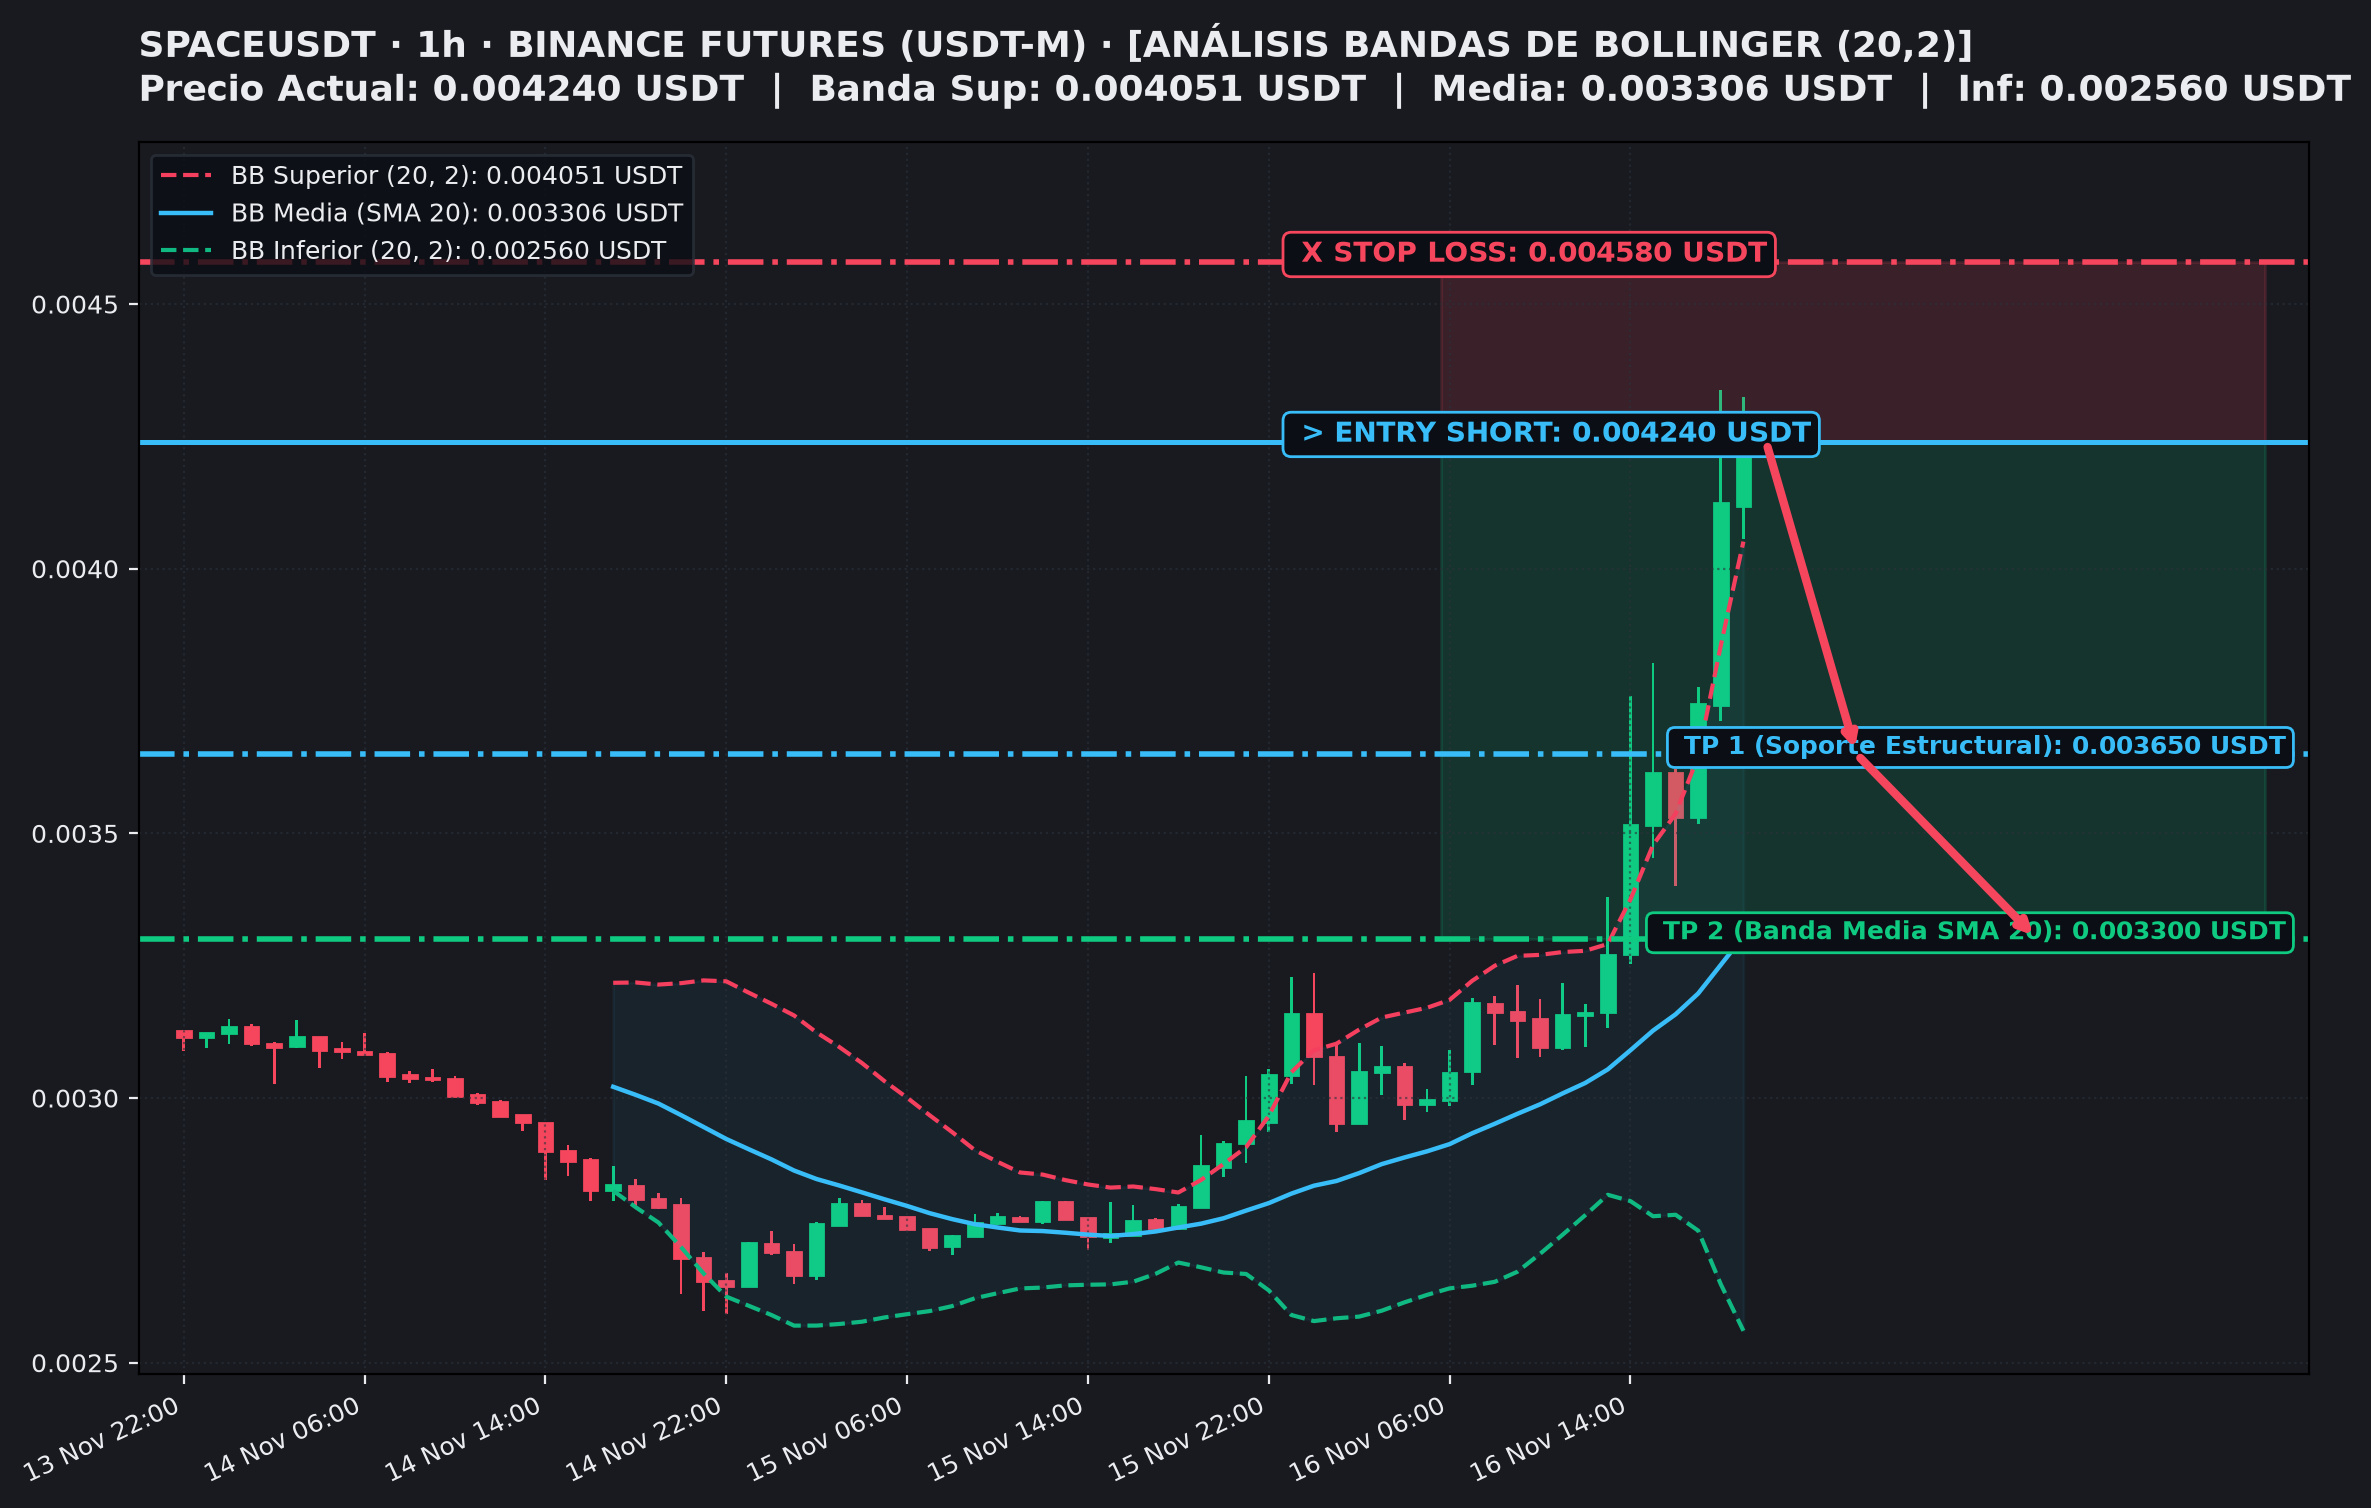
2
558
·
--
ANALYSIS $BLESS (1H): Parabolic Overextension and Short Signal at Extreme Resistance 📉⚡
The BLESSUSDT pair (Binance Futures) has recorded a vertical +100% surge over the past 24 hours, trading entirely above the Upper Bollinger Band (0.01665 USDT). With the RSI in extreme overbought territory (100 points), the price is showing clear signs of buyer exhaustion and a high probability of mean reversion.
📌 Key Setup Points (Short / Mean Reversion):
🎯 Entry Point: 0.01826 USDT (overextended rejection zone outside the bands)
🛑 Stop Loss: 0.01899 USDT (strict, above the recent all-time high)
💰 Target 1 (TP1): 0.01462 USDT (structural support and previous breakout zone)
🚀 Target 2 (TP2): 0.01097 USDT (reversion toward the Middle Band / SMA 20)
⚖️ R:R Ratio: 1:5.03 at TP1 | 1:10.0 at TP2
🧠 Technical Rationale with Bollinger Bands:
- Statistical Anomaly: The price can sustain a vertical move outside the Upper Band for less than 2% of the time without experiencing an aggressive correction toward the SMA 20.
- Volume Climax and Exhaustion: Wide-range candles with upper-wick rejections often signal massive profit-taking.
- Risk Management: Secure partial profits at TP1 and move the Stop Loss to the entry price (Breakeven) to protect the trade against high volatility.
👉 Interested in technical analysis of trending assets and daily setups? Follow us so you don't miss any market opportunities!
👇 Do you think BLESS will retrace toward the SMA 20 at 0.01097 USDT, or will its parabolic run continue? Let us know in the comments!
#BinanceSquare #CryptoTrading #BollingerBands #FuturesTrading $BTC $BLESS
ANALYSIS $BLESS (1H): Parabolic Overextension and Short Signal at Extreme Resistance 📉⚡
The BLESSUSDT pair (Binance Futures) has recorded a vertical +100% surge over the past 24 hours, trading entirely above the Upper Bollinger Band (0.01665 USDT). With the RSI in extreme overbought territory (100 points), the price is showing clear signs of buyer exhaustion and a high probability of mean reversion.
📌 Key Setup Points (Short / Mean Reversion):
🎯 Entry Point: 0.01826 USDT (overextended rejection zone outside the bands)
🛑 Stop Loss: 0.01899 USDT (strict, above the recent all-time high)
💰 Target 1 (TP1): 0.01462 USDT (structural support and previous breakout zone)
🚀 Target 2 (TP2): 0.01097 USDT (reversion toward the Middle Band / SMA 20)
⚖️ R:R Ratio: 1:5.03 at TP1 | 1:10.0 at TP2
🧠 Technical Rationale with Bollinger Bands:
- Statistical Anomaly: The price can sustain a vertical move outside the Upper Band for less than 2% of the time without experiencing an aggressive correction toward the SMA 20.
- Volume Climax and Exhaustion: Wide-range candles with upper-wick rejections often signal massive profit-taking.
- Risk Management: Secure partial profits at TP1 and move the Stop Loss to the entry price (Breakeven) to protect the trade against high volatility.
👉 Interested in technical analysis of trending assets and daily setups? Follow us so you don't miss any market opportunities!
👇 Do you think BLESS will retrace toward the SMA 20 at 0.01097 USDT, or will its parabolic run continue? Let us know in the comments!
#BinanceSquare #CryptoTrading #BollingerBands #FuturesTrading $BTC $BLESS
The BLESSUSDT pair (Binance Futures) has recorded a vertical +100% surge over the past 24 hours, trading entirely above the Upper Bollinger Band (0.01665 USDT). With the RSI in extreme overbought territory (100 points), the price is showing clear signs of buyer exhaustion and a high probability of mean reversion.
📌 Key Setup Points (Short / Mean Reversion):
🎯 Entry Point: 0.01826 USDT (overextended rejection zone outside the bands)
🛑 Stop Loss: 0.01899 USDT (strict, above the recent all-time high)
💰 Target 1 (TP1): 0.01462 USDT (structural support and previous breakout zone)
🚀 Target 2 (TP2): 0.01097 USDT (reversion toward the Middle Band / SMA 20)
⚖️ R:R Ratio: 1:5.03 at TP1 | 1:10.0 at TP2
🧠 Technical Rationale with Bollinger Bands:
- Statistical Anomaly: The price can sustain a vertical move outside the Upper Band for less than 2% of the time without experiencing an aggressive correction toward the SMA 20.
- Volume Climax and Exhaustion: Wide-range candles with upper-wick rejections often signal massive profit-taking.
- Risk Management: Secure partial profits at TP1 and move the Stop Loss to the entry price (Breakeven) to protect the trade against high volatility.
👉 Interested in technical analysis of trending assets and daily setups? Follow us so you don't miss any market opportunities!
👇 Do you think BLESS will retrace toward the SMA 20 at 0.01097 USDT, or will its parabolic run continue? Let us know in the comments!
#BinanceSquare #CryptoTrading #BollingerBands #FuturesTrading $BTC $BLESS
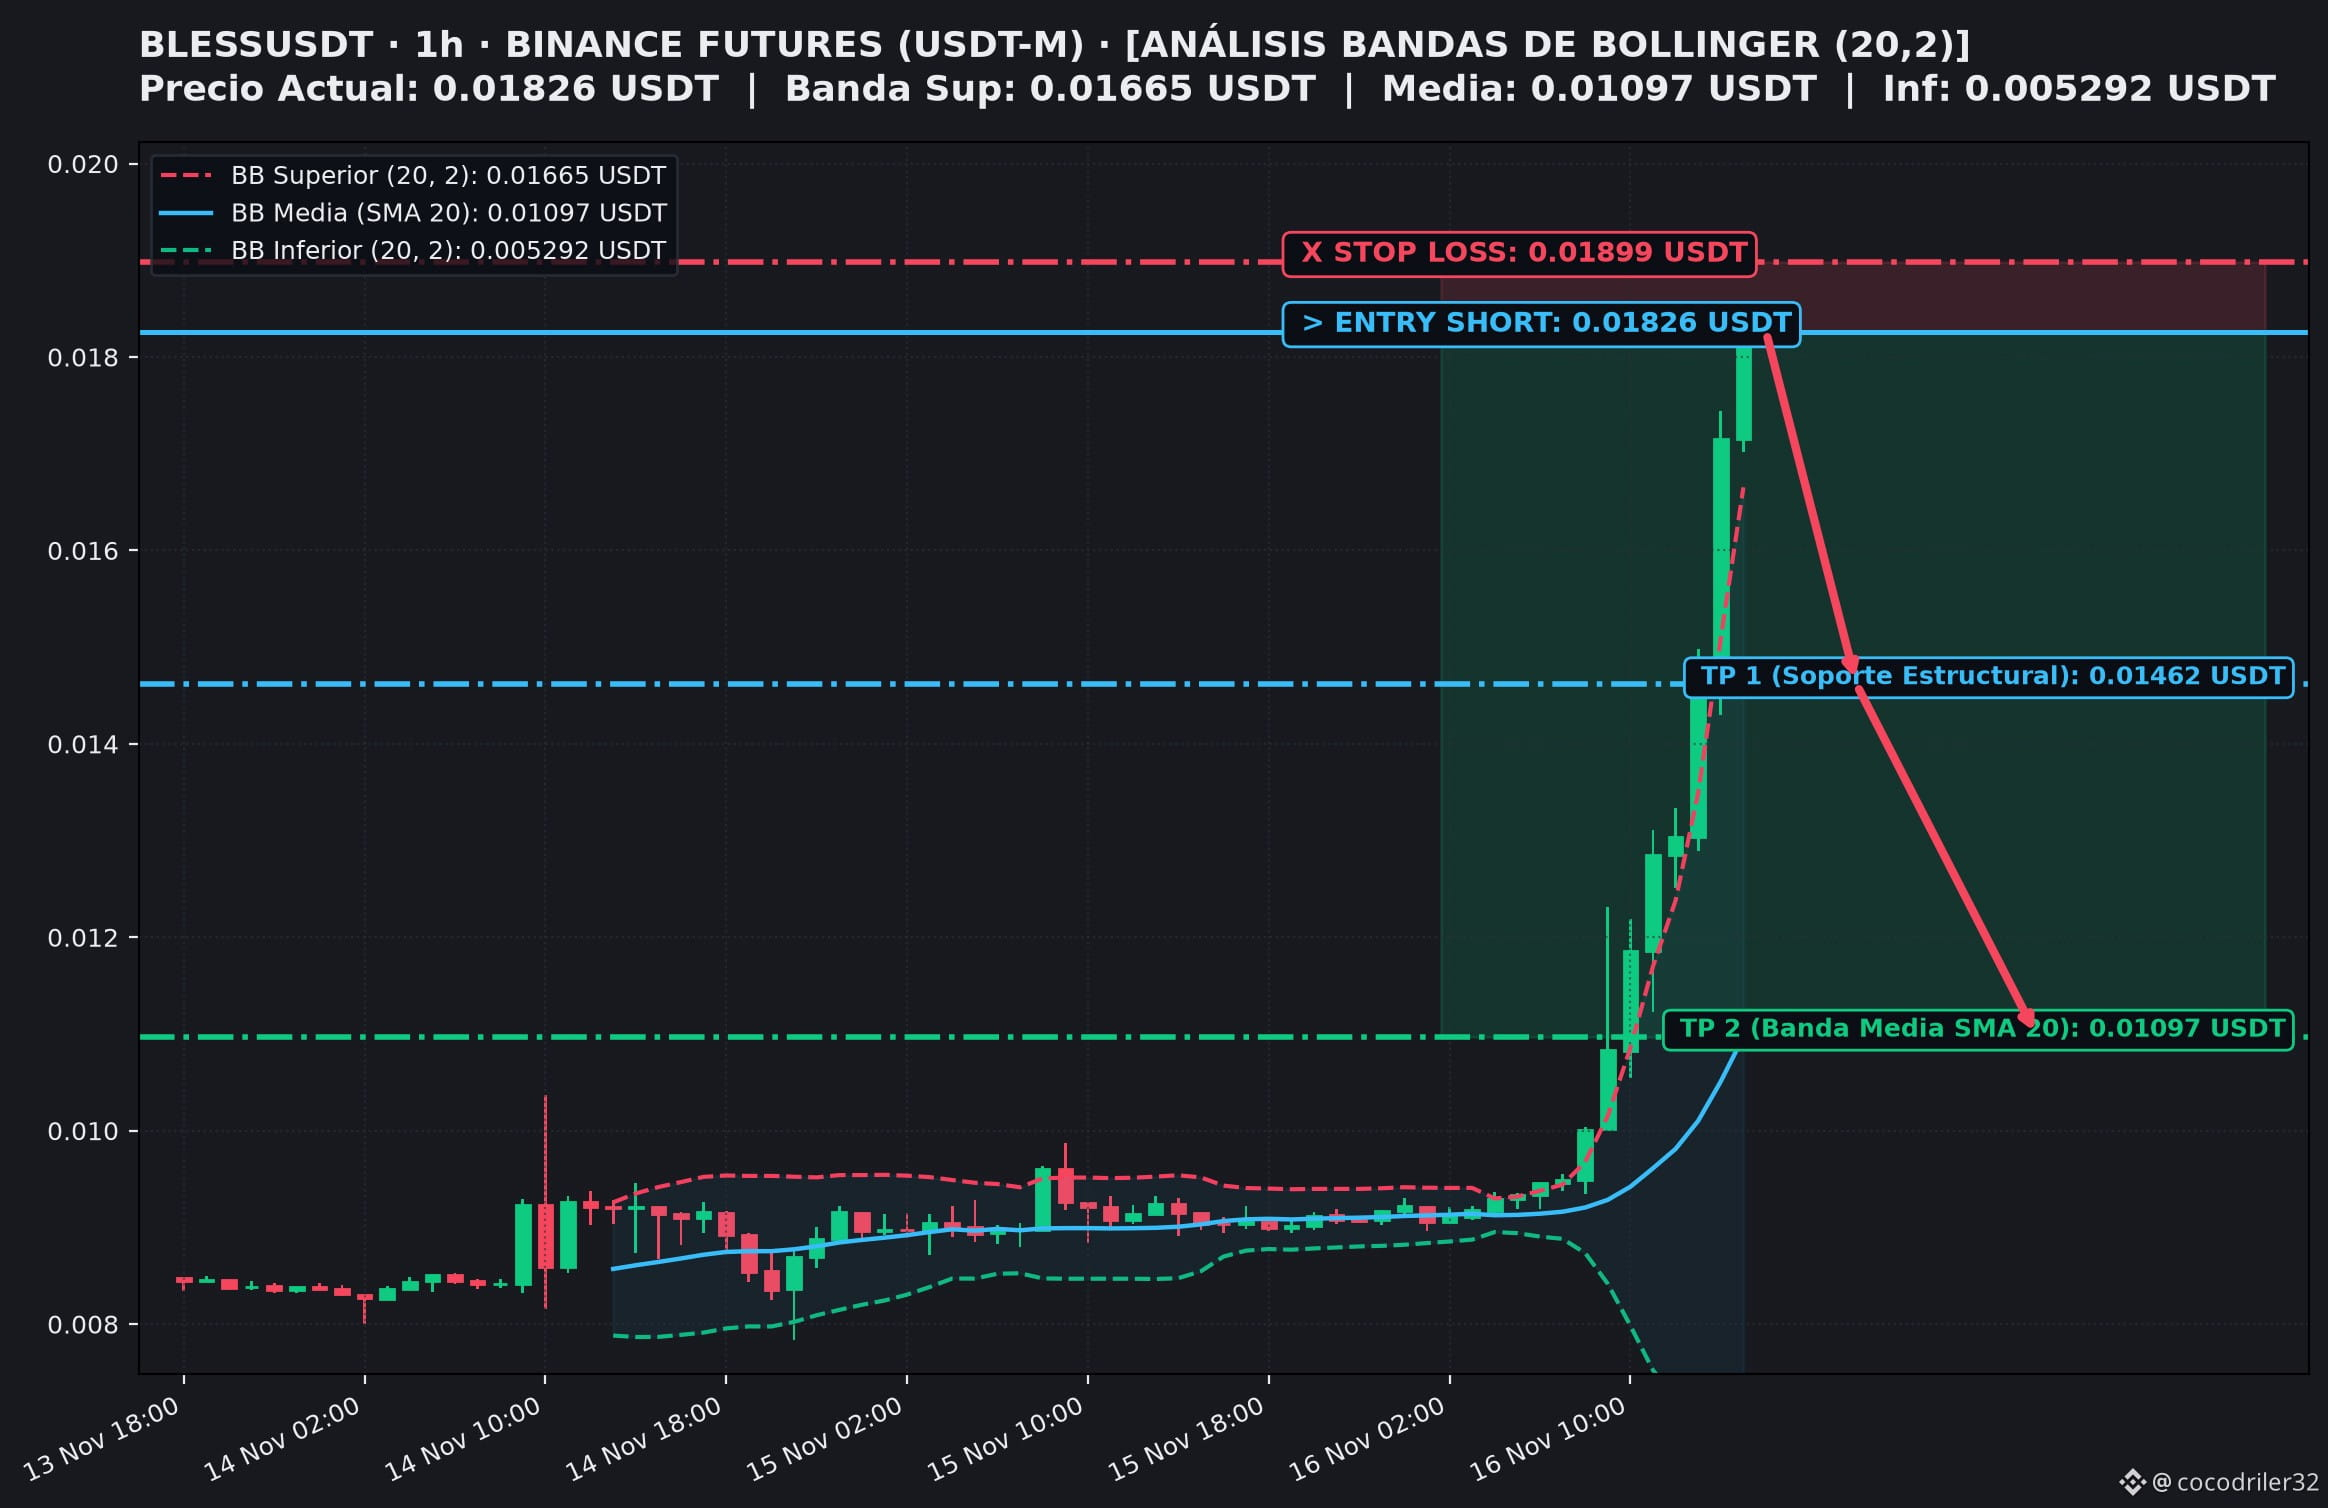
4
829
·
--
ANALYSIS $PLAY (1H): Upper Band Rejection and Short Setup for Mean Reversion 📉⚡
The PLAYUSDT pair (Binance Futures) has experienced a sharp vertical surge that pierced the Upper Bollinger Band (0.007455 USDT), encountering clear rejection at 0.007820 USDT. With an RSI above 93 on the 1H timeframe, the asset has entered an extreme overbought zone, and bullish momentum is becoming exhausted.
📌 Key Setup Points (Short / Bollinger Bands):
🎯 Entry Point: 0.007620 USDT (overextension zone outside the bands)
🛑 Stop Loss: 0.008016 USDT (strict, above the local highs)
💰 Target 1 (TP1): 0.006900 USDT (natural return to the Middle Band / SMA 20)
🚀 Target 2 (TP2): 0.006346 USDT (bearish expansion toward the Lower Band)
⚖️ R:R Ratio: 1:1.82 at TP1 | 1:3.22 at TP2
🧠 Technical Rationale Using Bollinger Bands:
- Mean Reversion: Price is unlikely to remain outside the Bollinger Bands without pulling back toward the SMA 20 to rebalance liquidity.
- Upper Wick Rejection: The loss of buying strength after touching 0.00782 USDT confirms profit-taking and the entry of selling pressure.
- Risk Management: Secure profits upon reaching TP1 and move the Stop Loss to the entry price (Breakeven) to trade risk-free.
👉 Do you closely follow futures and trending token movements? Follow us for technical analysis and daily setups!
👇 Do you think PLAY will fall straight to the SMA 20 at 0.00690 USDT, or will it attempt another bounce? Share your opinion in the comments!
#BinanceSquare #CryptoTrading #BollingerBands #FuturesTrading $BTC $PLAY
ANALYSIS $PLAY (1H): Upper Band Rejection and Short Setup for Mean Reversion 📉⚡
The PLAYUSDT pair (Binance Futures) has experienced a sharp vertical surge that pierced the Upper Bollinger Band (0.007455 USDT), encountering clear rejection at 0.007820 USDT. With an RSI above 93 on the 1H timeframe, the asset has entered an extreme overbought zone, and bullish momentum is becoming exhausted.
📌 Key Setup Points (Short / Bollinger Bands):
🎯 Entry Point: 0.007620 USDT (overextension zone outside the bands)
🛑 Stop Loss: 0.008016 USDT (strict, above the local highs)
💰 Target 1 (TP1): 0.006900 USDT (natural return to the Middle Band / SMA 20)
🚀 Target 2 (TP2): 0.006346 USDT (bearish expansion toward the Lower Band)
⚖️ R:R Ratio: 1:1.82 at TP1 | 1:3.22 at TP2
🧠 Technical Rationale Using Bollinger Bands:
- Mean Reversion: Price is unlikely to remain outside the Bollinger Bands without pulling back toward the SMA 20 to rebalance liquidity.
- Upper Wick Rejection: The loss of buying strength after touching 0.00782 USDT confirms profit-taking and the entry of selling pressure.
- Risk Management: Secure profits upon reaching TP1 and move the Stop Loss to the entry price (Breakeven) to trade risk-free.
👉 Do you closely follow futures and trending token movements? Follow us for technical analysis and daily setups!
👇 Do you think PLAY will fall straight to the SMA 20 at 0.00690 USDT, or will it attempt another bounce? Share your opinion in the comments!
#BinanceSquare #CryptoTrading #BollingerBands #FuturesTrading $BTC $PLAY
The PLAYUSDT pair (Binance Futures) has experienced a sharp vertical surge that pierced the Upper Bollinger Band (0.007455 USDT), encountering clear rejection at 0.007820 USDT. With an RSI above 93 on the 1H timeframe, the asset has entered an extreme overbought zone, and bullish momentum is becoming exhausted.
📌 Key Setup Points (Short / Bollinger Bands):
🎯 Entry Point: 0.007620 USDT (overextension zone outside the bands)
🛑 Stop Loss: 0.008016 USDT (strict, above the local highs)
💰 Target 1 (TP1): 0.006900 USDT (natural return to the Middle Band / SMA 20)
🚀 Target 2 (TP2): 0.006346 USDT (bearish expansion toward the Lower Band)
⚖️ R:R Ratio: 1:1.82 at TP1 | 1:3.22 at TP2
🧠 Technical Rationale Using Bollinger Bands:
- Mean Reversion: Price is unlikely to remain outside the Bollinger Bands without pulling back toward the SMA 20 to rebalance liquidity.
- Upper Wick Rejection: The loss of buying strength after touching 0.00782 USDT confirms profit-taking and the entry of selling pressure.
- Risk Management: Secure profits upon reaching TP1 and move the Stop Loss to the entry price (Breakeven) to trade risk-free.
👉 Do you closely follow futures and trending token movements? Follow us for technical analysis and daily setups!
👇 Do you think PLAY will fall straight to the SMA 20 at 0.00690 USDT, or will it attempt another bounce? Share your opinion in the comments!
#BinanceSquare #CryptoTrading #BollingerBands #FuturesTrading $BTC $PLAY
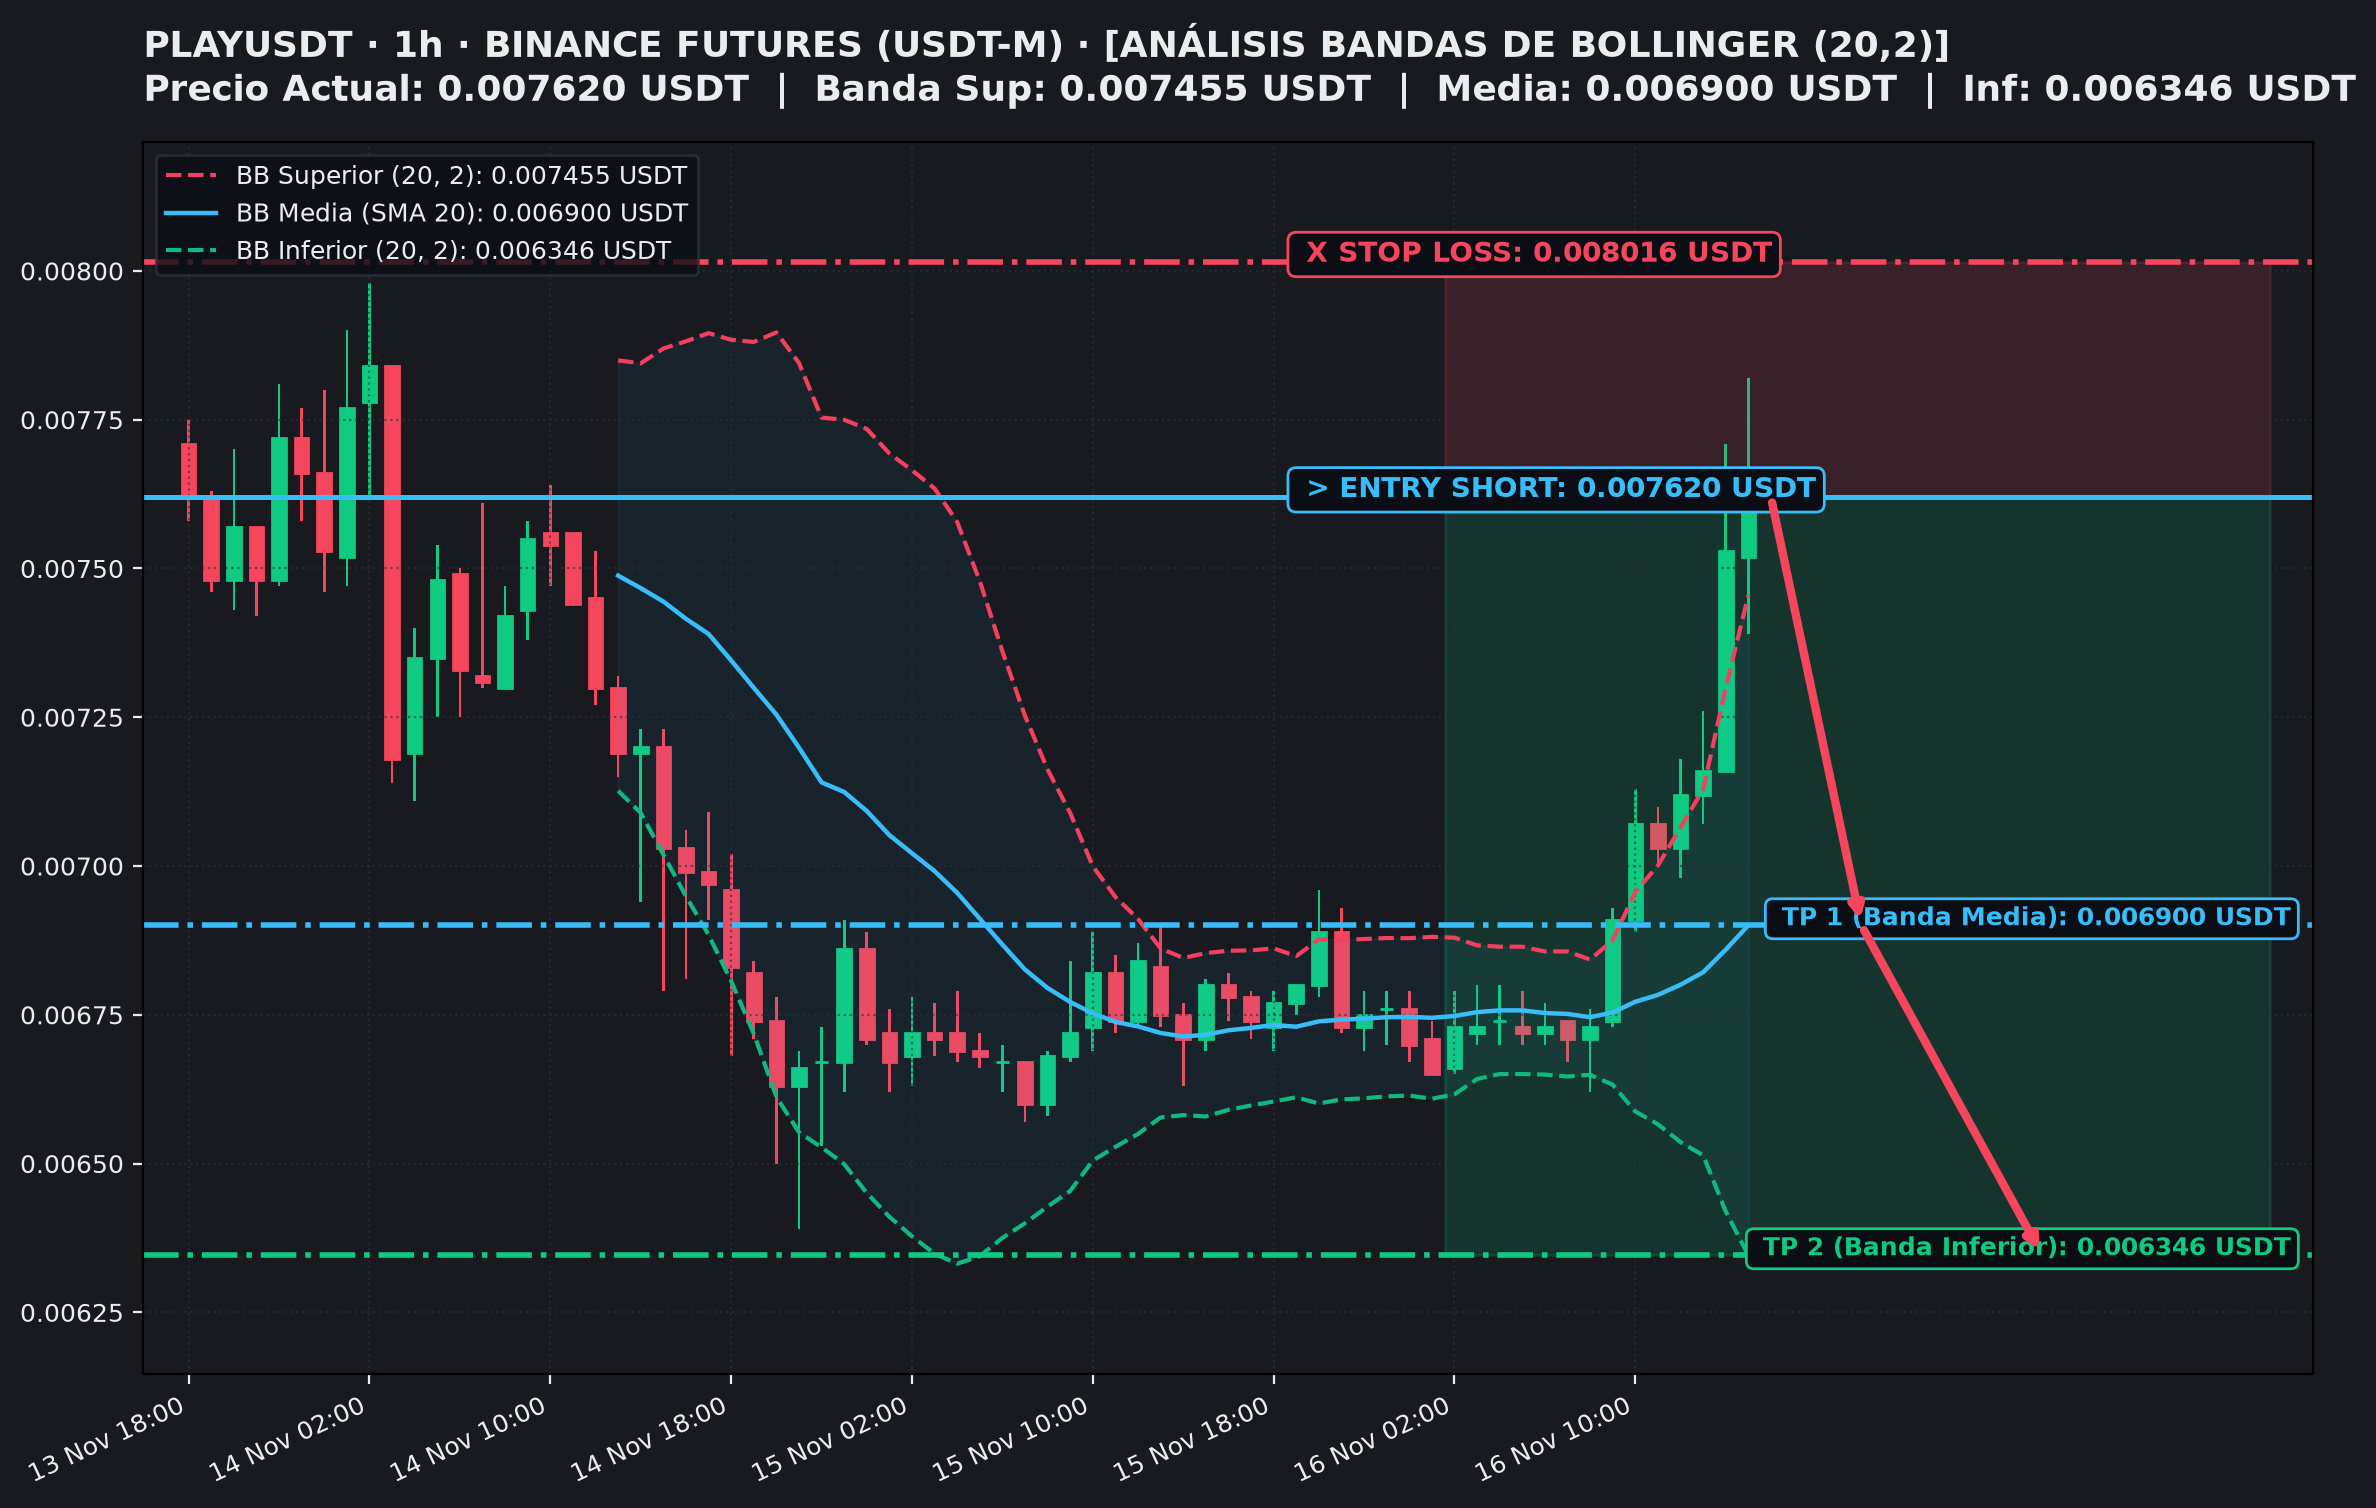
2
289
Log in to explore more content
Join global crypto users on Binance Square
⚡️ Get latest and useful information about crypto.
💬 Trusted by the world’s largest crypto exchange.
👍 Discover real insights from verified creators.
Email / Phone number
Trending Topics
1
#CanBTCReboundAfterFallingBelow60K?
355,715 views
1,482 Discussing
2
#GlobalStocksFaceLongestLosingStreakSince2023
117,251 views
1,055 Discussing
3
#BlackRockIBITPostsRecord$541MSingleDayOutflow
588 views
15 Discussing
4
#AnthropicPlungesTowardIPOPriceonDay2
56,610 views
564 Discussing
5
#TwentyOneCapitalAdds172.25BTC
8,795 views
138 Discussing
6
#HKBillWouldExcludeTokenizedDepositsFromVirtualAssets
819 views
14 Discussing
7
#BNBDropsBelow540USDTWith8.46%DailyDecline
30,205 views
247 Discussing
8
#HKBillProposesHK$100KFineForUnauthorizedCryptoTitles
999 views
14 Discussing
9
#BitMineFaces$10.1BUnrealizedETHLoss
1,955 views
18 Discussing
10
#StrategyReports$35BNetReserves
1,814 views
17 Discussing